. 2022 Jan;17(1):98-106.
doi: 10.1038/s41565-021-01000-4. Epub 2021 Nov 18.

Intercellular nanotubes mediate mitochondrial trafficking between cancer and immune cells

Affiliations

Intercellular nanotubes mediate mitochondrial trafficking between cancer and immune cells

Tanmoy Saha et al. Nat Nanotechnol. 2022 Jan.

Abstract

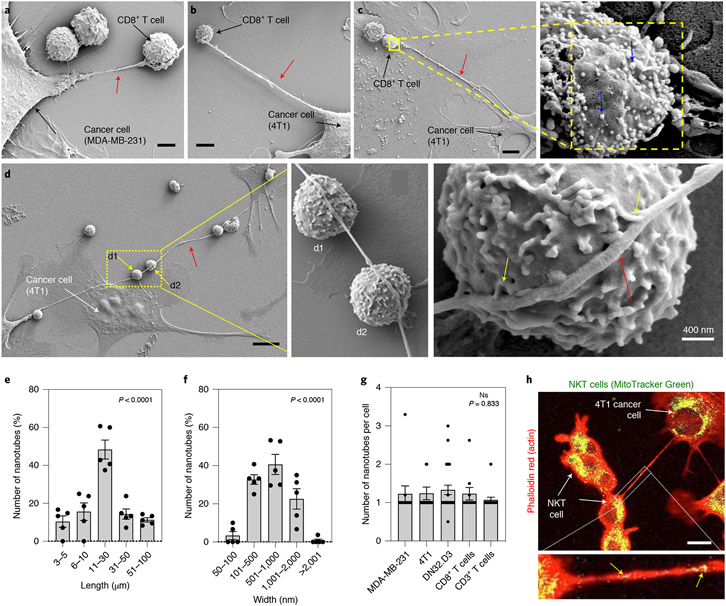
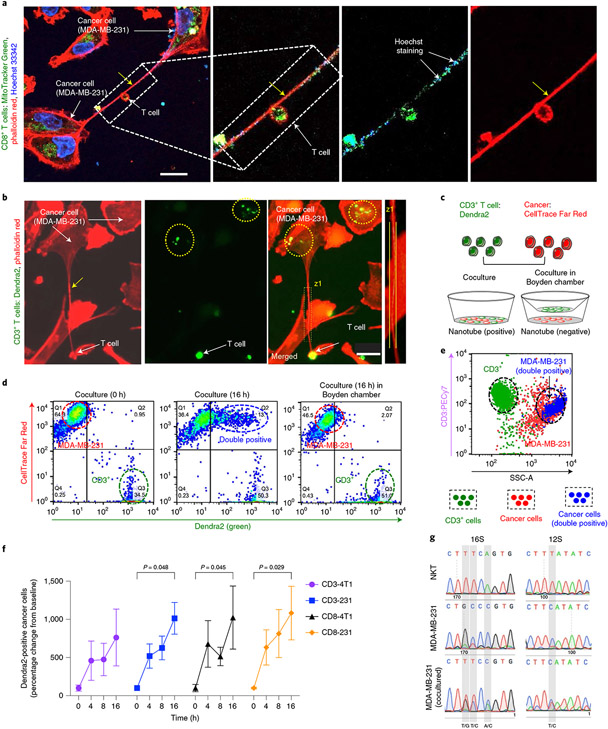
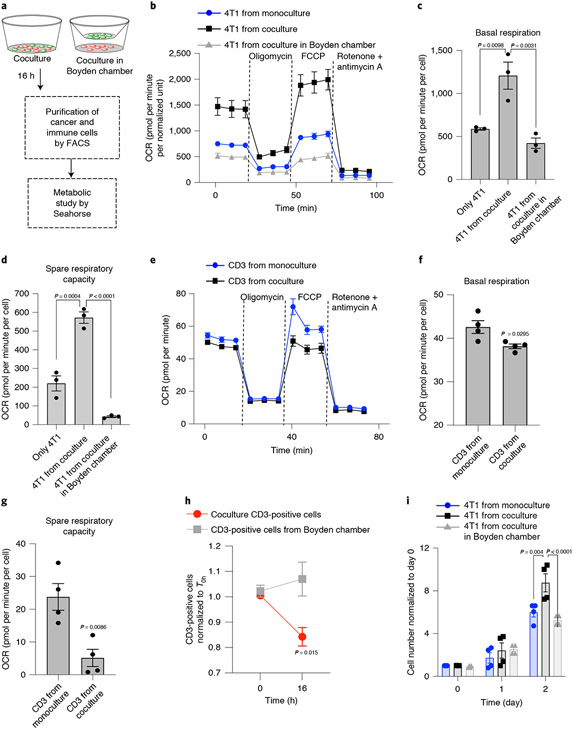
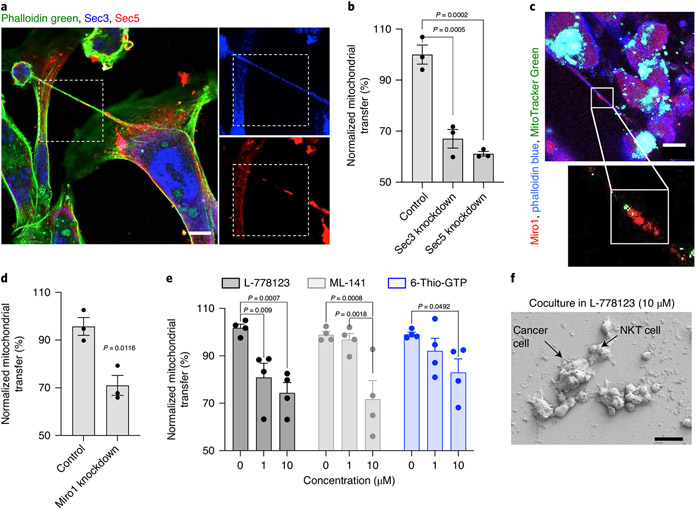
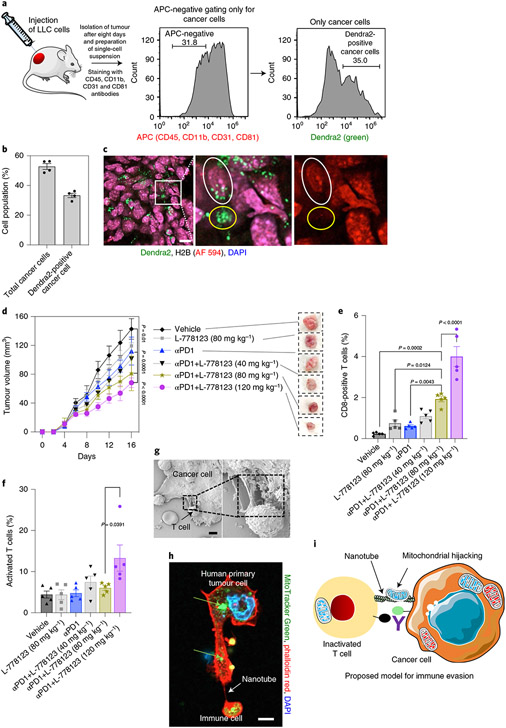
Cancer progresses by evading the immune system. Elucidating diverse immune evasion strategies is a critical step in the search for next-generation immunotherapies for cancer. Here we report that cancer cells can hijack the mitochondria from immune cells via physical nanotubes. Mitochondria are essential for metabolism and activation of immune cells. By using field-emission scanning electron microscopy, fluorophore-tagged mitochondrial transfer tracing and metabolic quantification, we demonstrate that the nanotube-mediated transfer of mitochondria from immune cells to cancer cells metabolically empowers the cancer cells and depletes the immune cells. Inhibiting the nanotube assembly machinery significantly reduced mitochondrial transfer and prevented the depletion of immune cells. Combining a farnesyltransferase and geranylgeranyltransferase 1 inhibitor, namely, L-778123, which partially inhibited nanotube formation and mitochondrial transfer, with a programmed cell death protein 1 immune checkpoint inhibitor improved the antitumour outcomes in an aggressive immunocompetent breast cancer model. Nanotube-mediated mitochondrial hijacking can emerge as a novel target for developing next-generation immunotherapy agents for cancer.


Figures

Fig. 1 ∣
Fig. 1 ∣. Cancer cells and effector immune cells connect via physical nanotubes.
a,b, FESEM images showing nanotubes (red arrow) between breast cancer cells and immune cells. CD8+/CD3+ T cells were added to either MDA-MB-231 (a) or 4T1 cells (b). In a, the nanotube appears to branch around the T cell. Scale bars, 2 μm (a) and 4 μm (b). c, Left: FESEM image showing a nanotube (red arrow) between immunogold-labelled CD8+ T cells and 4T1 cancer cells. Scale bar, 4 μm. Right: gold nanoparticles (diameter, 10 nm) are visible (blue arrows) on the surface of the T cells at higher magnification. d, Left: FESEM image showing that a single nanotube can connect a cancer cell (4T1) with multiple T cells (yellow arrows). Scale bar, 10 μm. Middle: magnified view showing the interaction between the nanotube and immune cells. Right: yellow arrows show the buds from the nanotube fusing with the immune cells. e,f, Graphs showing the distribution of lengths and widths of nanotubes connecting the cancer cells and immune cells, as calculated from the FESEM images. Data shown are mean ± s.e.m. (ANOVA followed by Tukey’s multiple comparisons test). Each data point represents a cell pair, that is, CD3+ T/4T1 (n = 7), CD8+ T/MDA-MB-231 (n = 18), TALL/MDA-MB-231 (n = 11), NKT/MDA-MB-231 (n = 28) and NKT/4T1 (n = 11). g, Graph showing the number of nanotubes between cancer cells and immune cells formed per cell (calculated using the FESEM images). Data are represented as mean ± s.e.m. (ANOVA followed by Tukey’s multiple comparisons test; NS, not significant). h, Top: representative confocal image shows a nanotube connecting the NKT and 4T1 cells. Scale bar, 10 μm. The mitochondria in NKT cells (DN32.D3) were labelled with MitoTracker Green dye before coculture with cancer cells (4T1). Rhodamine phalloidin (red) was used to label the actin filaments in all cells. The presence of the green signal (appears yellow in the merged image) in the cancer cell represents the transfer of MitoTracker-Green-tagged mitochondria from the immune cell to the cancer cell. Bottom: MitoTracker localization (yellow arrows) with actin in the nanotube.
Fig. 2 ∣
Fig. 2 ∣. Nanotubes mediate organelle transfer between immune cells and cancer cells.
a, Confocal image showing nanotube-mediated transfer of MitoTracker-Green-tagged mitochondria from CD8+ T cell to MDA-MB-231 cells. Scale bar, 20 μm. The colocalization of Hoechst 33342 (which stains mitochondrial DNA) and MitoTracker in the merged image supports nanotube-mediated mitochondrial trafficking. b, Fluorescence image showing the nanotube and transfer of Dendra2-positive mitochondria in the coculture of CD3+ T cell (from PhAMexcised mice expressing a mitochondria-specific version of Dendra2) and MDA-MB-231 cells. Scale bar, 20 μm. Actin was stained with rhodamine phalloidin. c, Experimental design to quantify mitochondrial hijacking by cancer cells from immune cells. CTFR-labelled MDA-MB-231 cells were cultured with Dendra2-positive CD3+ T cell in direct contact or separated in a Boyden chamber by a porous membrane. d, Dot plots showing the transfer of Dendra2-positive mitochondria from CD3+ T cell to MDA-MB-231 cells. At time 0 h (T0h), the MDA-MB-231 cells and CD3+ T cells are displayed as two distinct populations corresponding to their fluorescent labelling. After 16 h, a new dual red and green population (top right) appears, consistent with the transfer of mitochondria from the immune cells to cancer cells. Minimal transfer of mitochondria was observed in the coculture in the Boyden chamber. e, Representative plot of the above coculture at 16 h after staining the T cells with anti-CD3 (PE-Cy7) antibody and sorting the cells based on side scattering (SSC). The green population represents Dendra2-positive CD3+ T cells and the red population represents CTFR-stained cancer cells. The blue population indicates cells having both red and green fluorescence. The blue population superimposed with the population of the cancer cells as seen in the SSC signify the transport of mitochondria from the immune cell to the cancer cell. f, Graph showing the time-dependent transfer of mitochondria from Dendra2-positive CD3+/CD8+ T cells to cancer cells. The data are normalized to the T0h values, and presented as mean ± s.e.m. (n = 3; P = 0.048, 0.045, 0.029; two-way ANOVA with Tukey’s multiple comparisons test). g, Mitochondrial genotyping using species-specific SNPs show mitochondrial transfer from mouse DN32.D3 cells into human MDA-MB-231 cancer cells.
Fig. 3 ∣
Fig. 3 ∣. Metabolic effect of mitochondrial hijacking.
a, Schematic showing the experimental design. After 16 h of coculture, the cancer cells and immune cells were separated using FACS, and the metabolic state of each cell type was measured using the Seahorse XFe24 platform. b, Oxygen consumption rate (OCR) from Seahorse XF Mito stress test of cancer cells isolated from a coculture in which they form direct contact with immune cells shows increased mitochondrial respiration. Data are normalized according to the total protein concentration in each well after the assay and represented as mean ± s.e.m. (n = 3). c,d, Graphs showing basal respiration (c) and spare respiratory capacity (d) in 4T1 cells. Data are represented as mean ± s.e.m. (n = 3; P = 0.0098 and P = 0.0031 for basal respiration and P = 0.0004 and P < 0.0001 for spare respiratory capacity; one-way ANOVA with Tukey’s multiple comparisons test). e, Seahorse XF Mito stress test profile shows decreased mitochondrial respiration in CD3+ T cells when they are cultured in the presence of cancer cells. The cells were separated by FACS after 10 h and used for the metabolism assay using Seahorse XFe96. Data are represented as mean ± s.e.m. (n = 3). f,g, Graphs showing basal respiration (f) and spare respiratory capacity (g) of cocultured and monocultured CD3+ T cells. Data are shown as mean ± s.e.m. (n = 4; P = 0.0295 for basal respiration and P = 0.0086 for spare respiratory capacity; unpaired two-tailed t-test). h, Graph showing the reduction in T cell population when cocultured with 4T1 cancer cells versus when they are cocultured in a Boyden assay. Data are normalized to the T0h population (n = 3; P = 0.004 and P < 0.0001 at 48 h; two-way ANOVA with Bonferroni’s multiple comparisons test). i, Graph showing the proliferation of cancer cells post-coculture with immune cells. The 4T1 cells were isolated using FACS after 16 h of coculture and further maintained as monocultures for an additional 48 h. Data are normalized according to the population at 0 h for each condition. Data are shown as mean ± s.e.m. (n = 4; P = 0.0032 and 0.0021 at 48 h; two-way ANOVA with Bonferroni’s multiple comparisons test).
Fig. 4 ∣
Fig. 4 ∣. Mechanism underlying nanotube formation and mitochondrial transfer.
a, Representative confocal image showing the localization of exocyst proteins, namely, Sec3 (blue) and Sec5 (red), at the base and within a nanotube between MDA-MB-231 cells and NKT cells. Actin was stained with phalloidin green. Scale bar, 10 μm. b, Graph showing the induced transfer of mitochondria after siRNA-mediated partial knockdown of Sec3 and Sec5 in MDA-MB-231 cells. Data are normalized to mitochondrial transfer in controls and represented as mean ± s.e.m. (n = 3; P = 0.0005 and 0.0002 for Sec3 and Sec5, respectively; one-way ANOVA with Dunnett’s multiple comparisons test). c, Immunofluorescence image showing the colocalization of mitochondrial Rho GTPase-1 (Miro1) with MitoTracker-labelled mitochondria. NKT cells loaded with MitoTracker Green were cocultured with MDA-MB-231 cells. The coculture was fixed at 16 h, and immunolabelled with anti-Miro1 antibody (red). Phalloidin blue was used to stain actin. The image shows the colocalization of mitochondria (green) and Miro1 (red) in the nanotube. Scale bar, 10 μm. d, Graph showing the decrease in transfer of mitochondria after siRNA-targeting partial knockdown of Miro1 in MDA-MB-231 cells. The transfected cancer cells were labelled with CTFR and cocultured with MitoTracker-Green-loaded NKT cells. Data are normalized to the control and represented as mean ± s.e.m. (n = 3; P = 0.0116; unpaired two-tailed t-test). e, Graph showing the drug-concentration-dependent reduction in mitochondrial transfer from immune cells to cancer cells. The transfer of mitochondria was monitored by flow cytometry and the data are normalized according to mitochondrial transfer in the control condition. Data are shown as mean ± s.e.m. (n = 4; P = 0.009; P = 0.0007 for L-778123; P = 0.0008; P = 0.0018 for ML-141; P = 0.0492 for 6-Thio-GTP; two-way ANOVA with Tukey’s multiple comparisons test). f, Scanning electron microscopy images of cocultures of NKT and MDA-MB-231 cell culture in the presence of L-778123 (10 μM) for 16 h showing the distinct change in interactions between the cells and the absence of nanotubes. Scale bar, 20 μm.
Fig. 5 ∣
Fig. 5 ∣. Targeting nanotube-mediated mitochondrial hijacking augments antitumour immune response in vivo.
a, Left: LLC cells were subcutaneously injected into syngeneic C57BL/6 J PhAMexcised mice. The infiltrating cells were stained with CD45, CD11b, CD31 and CD81 antibodies (all are APC labelled). The cancer cells were selected by gating the APC-negative cell population. Middle: histogram showing the selection of cancer cells that are not labelled with CD45, CD11b, CD31 and CD81 antibodies. Right: histogram showing the fraction of cancer cells containing Dendra2-positive mitochondria. b, Bar graph showing the total cancer cells, and the fraction of Dendra2-positive cancer cells. Data are represented as mean ± s.e.m. (n = 4). c, Confocal image showing Dendra2-positive mitochondria in cancer cells. Scale bar, 10 μm. Tumour sections were labelled with cancer-cell-specific H2B antibody and DAPI. The green signal in H2B-antibody-labelled cells signifies the presence of trafficked Dendra2-positive mitochondria in the cancer cell. Yellow circle shows Dendra2-positive mitochondria in infiltrated stromal cells, whereas the white outline highlights an H2B cell that has acquired Dendra2-positive mitochondria. d, Tumour growth curves and representative images of tumours showing the effect of eight cycles of L-778123, PD1 inhibitor, or a combination of these two on 4T1 tumours in immunocompetent BALB/c female mice. Data represent mean tumor volume ± s.e.m. (n = 5). e, Graph showing the immunomodulatory effect of L-778123 and PD1 inhibitors on the population of CD8+ T cells in the tumour, as measured by flow cytometry. Data are shown as mean ± s.e.m. (two-way ANOVA followed by Tukey’s multiple comparisons test). f, Graph showing the effect of treatments on the population of activated CD69+ T cells. Data are shown as mean ± s.e.m. (two-way ANOVA followed by Tukey’s multiple comparisons test). g, FESEM image showing the nanotube between a primary human tumour explant and an autologous immune cell. Scale bar, 2 μm. h, Representative confocal image showing nanotube formation and MitoTracker-Green-labelled mitochondrial transfer (green arrows) from PBMCs occurs to the tumour explant. Scale bar, 5 μm. i, In our proposed model, the cancer cell can communicate with the immune cell via physical nanotubes, and metabolically impair the immune cell by hijacking the mitochondria. Next-generation immunotherapies will need to target immune checkpoints as well as mitochondrial hijacking. Panel i adapted from Servier Medical Art under a Creative Commons licence (https://creativecommons.org/licenses/by/3.0/).

Comment in

  • Cancer cells hijack T-cell mitochondria.
    Baldwin JG, Gattinoni L. Baldwin JG, et al. Nat Nanotechnol. 2022 Jan;17(1):3-4. doi: 10.1038/s41565-021-01006-y. Nat Nanotechnol. 2022. PMID: 34795442 No abstract available.

References

    1. Wei SC et al. Distinct cellular mechanisms underlie anti-CTLA-4 and anti-PD-1 checkpoint blockade. Cell 170, 1120–1133.e17 (2017). - PMC - PubMed
    1. Sharma P & Allison JP Dissecting the mechanisms of immune checkpoint therapy. Nat. Rev. Immunol 20, 75–76 (2020). - PubMed
    1. Wolchok J Putting the immunologic brakes on cancer. Cell 175, 1452–1454 (2018). - PubMed
    1. Kulkarni A et al. A designer self-assembled supramolecule amplifies macrophage immune responses against aggressive cancer. Nat. Biomed. Eng 2, 589–599 (2018). - PMC - PubMed
    1. Wei SC, Duffy CR & Allison JP Fundamental mechanisms of immune checkpoint blockade therapy. Cancer Discov. 8, 1069–1086 (2018). - PubMed

Publication types

Substances