. 2021 Nov 2:12:757607.
doi: 10.3389/fimmu.2021.757607. eCollection 2021.

In-Depth Molecular Characterization of Neovascular Membranes Suggests a Role for Hyalocyte-to-Myofibroblast Transdifferentiation in Proliferative Diabetic Retinopathy

Affiliations

In-Depth Molecular Characterization of Neovascular Membranes Suggests a Role for Hyalocyte-to-Myofibroblast Transdifferentiation in Proliferative Diabetic Retinopathy

Stefaniya Konstantinova Boneva et al. Front Immunol. .

Abstract

Background: Retinal neovascularization (RNV) membranes can lead to a tractional retinal detachment, the primary reason for severe vision loss in end-stage disease proliferative diabetic retinopathy (PDR). The aim of this study was to characterize the molecular, cellular and immunological features of RNV in order to unravel potential novel drug treatments for PDR.

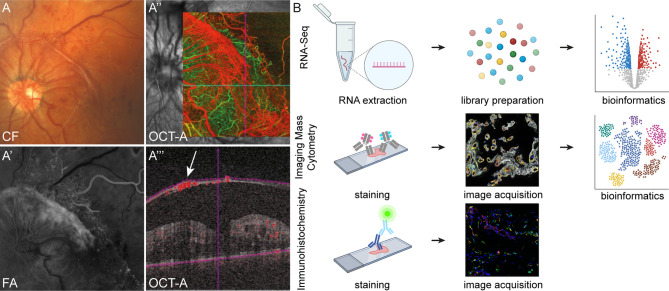
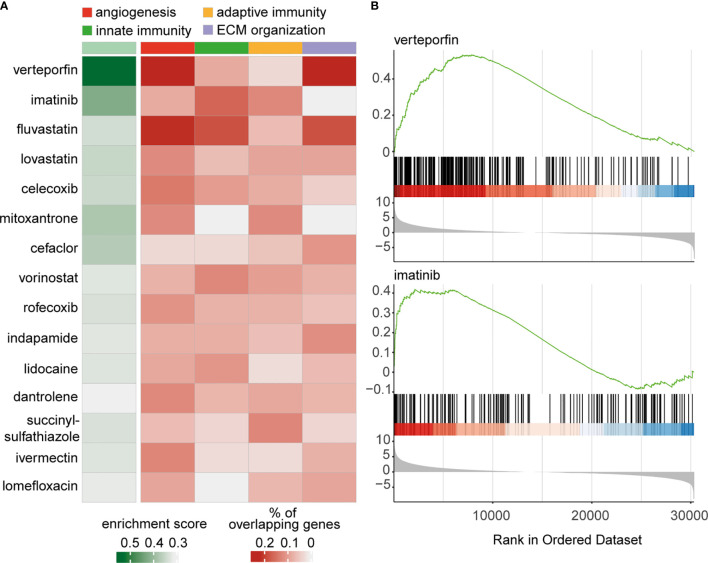
Methods: A total of 43 patients undergoing vitrectomy for PDR, macular pucker or macular hole (control patients) were included in this study. The surgically removed RNV and epiretinal membranes were analyzed by RNA sequencing, single-cell based Imaging Mass Cytometry and conventional immunohistochemistry. Immune cells of the vitreous body, also known as hyalocytes, were isolated from patients with PDR by flow cytometry, cultivated and characterized by immunohistochemistry. A bioinformatical drug repurposing approach was applied in order to identify novel potential drug options for end-stage diabetic retinopathy disease.

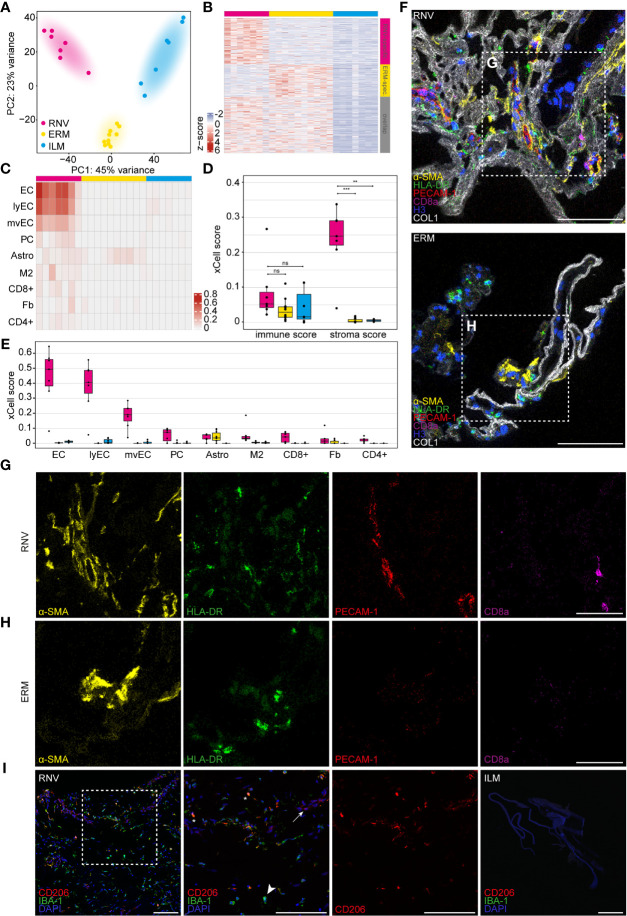
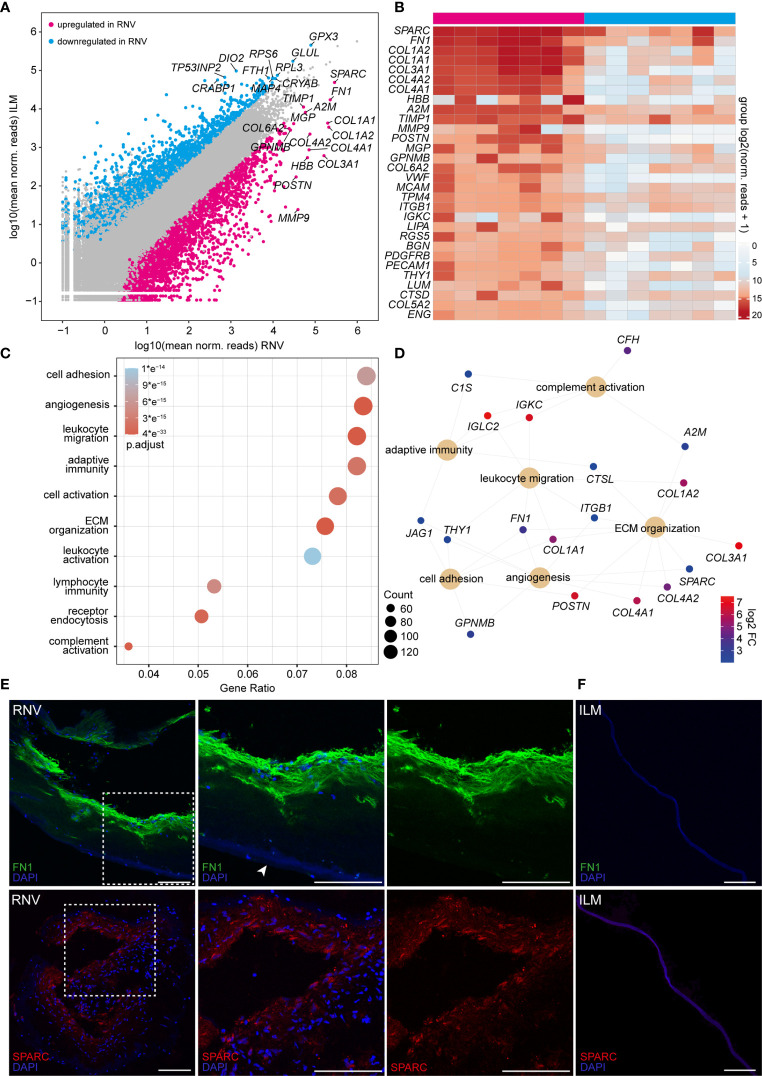
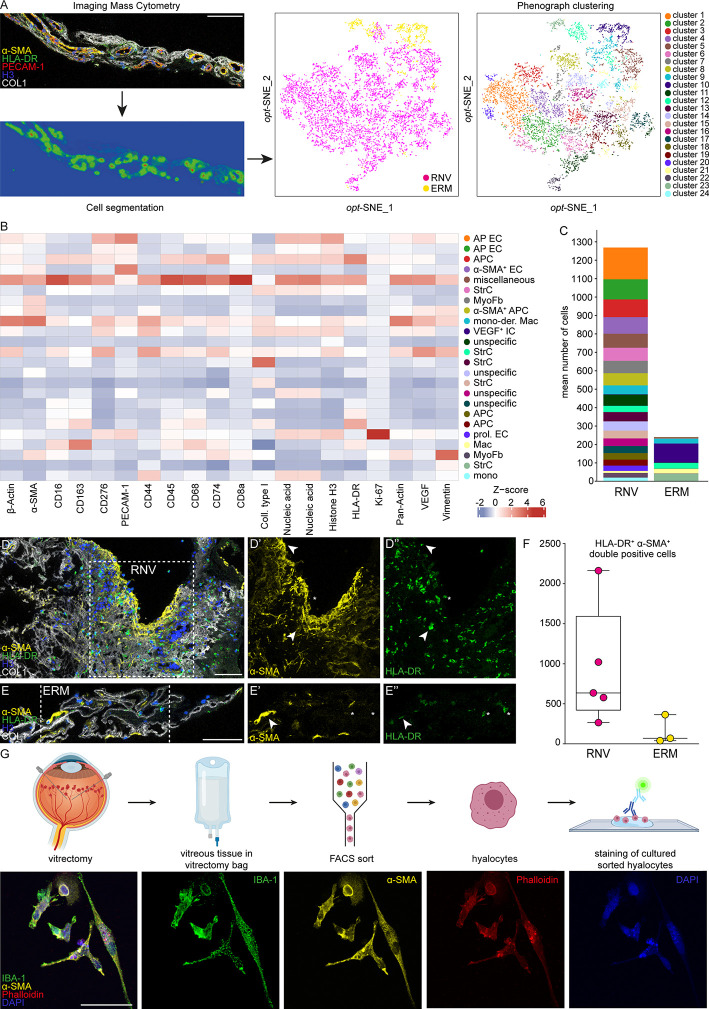
Results: The in-depth transcriptional and single-cell protein analysis of diabetic RNV tissue samples revealed an accumulation of endothelial cells, macrophages and myofibroblasts as well as an abundance of secreted ECM proteins such as SPARC, FN1 and several types of collagen in RNV tissue. The immunohistochemical staining of cultivated vitreal hyalocytes from patients with PDR showed that hyalocytes express α-SMA (alpha-smooth muscle actin), a classic myofibroblast marker. According to our drug repurposing analysis, imatinib emerged as a potential immunomodulatory drug option for future treatment of PDR.

Conclusion: This study delivers the first in-depth transcriptional and single-cell proteomic characterization of RNV tissue samples. Our data suggest an important role of hyalocyte-to-myofibroblast transdifferentiation in the pathogenesis of diabetic vitreoretinal disease and their modulation as a novel possible clinical approach.

Keywords: Imaging Mass Cytometry; RNA sequencing; hyalocytes; myofibroblasts; proliferative diabetic retinopathy (PDR); retinal neovascularization (RNV); transdifferentiation.


Conflict of interest statement

The authors declare that the research was conducted in the absence of any commercial or financial relationships that could be construed as a potential conflict of interest.

Figures

Figure 1
Figure 1
Experimental setup. Retinal neovascularization membranes (RNV) were visualized prior to surgery via funduscopic examination (A) color fundus, CF), fluorescein angiography, FA (A’) and optical coherence tomography angiography, OCT-A (A’’ and A’’’). A’’’ The arrow points to a preretinal membrane interspersed with blood vessels. (B) Workflow for tissue processing. RNV and control tissue samples (epiretinal membrane and internal limiting membrane, not shown) for RNA sequencing were stored in RNAlater immediately upon resection before RNA extraction and generation of first-strand cDNA were performed (upper panel). Following library preparation and RNA sequencing, bioinformatic analyses were conducted. For Imaging Mass Cytometry (IMC), excised tissue samples were collected in formalin, processed for paraffin embedding (FFPE, middle panel) and sectioned. For staining of tissue sections, a compilation of 27 metal isotope-conjugated antibodies was applied before image acquisition. In the following, segmentation of IMC data via supervised machine learning was conducted prior to high-dimensional data analysis. Conventional immunohistochemistry (IHC, lower panel) was performed on cryo-conserved tissue sections and visualized by confocal microscopy.
Figure 2
Figure 2
Diabetic retinal neovascularization membranes (RNV) differ significantly in their cellular and molecular composition from epiretinal (ERM) and internal limiting membranes (ILM). (A) Principal component analysis (PCA) plot demonstrating the distribution of the three analyzed entities: RNV (magenta), ERM (yellow) and ILM (blue). (B) Heatmap of the genes upregulated in RNV (upper magenta bar) and ERM (upper yellow bar) when compared to ILM (upper blue bar). The side bars mark RNV-specific (side magenta bar), ERM-specific (side yellow bar) genes or the overlap between both (grey bar), each in comparison to ILM (log2 fold change >2, adjusted p value <0.05). Color coding of the transcripts according to the z-score (deviation from a gene’s mean expression in standard deviation units). (C) Heatmap of significantly enriched cell types in RNV (magenta) vs. ILM (blue) according to the xCell analysis. Each row represents one cell type, each column one sample. The rows are ordered according to the fold change of the mean enrichment scores between RNV and ILM. EC, endothelial cells. ly, lymphatic. mv, microvascular. PC, pericytes. Astro, astrocytes. M2, M2 macrophages. CD8+, CD8+ central memory T cell. Fb, fibroblasts. CD4+, CD4+ naive T cells. Color coding for cell types. (D) Boxplots of the xCell immune and stroma scores in RNV (magenta), ERM (yellow) and ILM (blue). Each dot represents one sample. *p <0.05, **p <0.005, ***p <0.0005. ns, not significant (Mann-Whitney U test). (E) Boxplots of significantly enriched cell types in RNV (magenta) vs. ILM (blue), ordered according to the log2 fold change between RNV and ILM. (F) Imaging Mass Cytometry on RNV and ERM tissue samples. Images are representative for all stained samples. Multiplexed staining for α-SMA (α-smooth muscle actin, yellow), HLA-DR (human leukocyte antigen – DR isotype, green), PECAM-1 (platelet endothelial cell adhesion molecule, red), CD8a (magenta), Histone H3 (blue) and COL1 (collagen type I, white) is presented. Higher magnification of the sections within the dashed white square is shown respectively in the panels in (G, H) Scale bars correspond to 100 μm (F) and 50 μm (G, H). (I) Immunohistochemical staining for CD206 (Cluster of Differentiation 206) and IBA-1 (ionized calcium-binding adapter molecule 1) in RNV and ILM samples. Higher magnification of the section within the dashed white square is shown to the right. Double-positive CD206+IBA-1+ cells are tagged by an asterisk. Arrow points to a CD206+IBA-1- cell. Arrowhead points toward a CD206-IBA-1+ cell. Nuclei are counterstained with DAPI. Scale bars correspond to 100 μm.
Figure 3
Figure 3
High-throughput sequencing identifies a variety of pro-angiogenic, inflammatory and pro-fibrotic factors enriched in retinal neovascularization (RNV) membranes. (A) Readplot of differentially expressed genes in RNV (upregulated genes in magenta, downregulated genes in blue, not differentially expressed genes in grey; the most strongly expressed genes from each group are labeled). (B) Heatmap of the most prominent transcripts in human RNV membranes according to the mean expression. Color coding of the transcripts according to the number of normalized counts (log2-scaled). (C) Most significant Gene ontology (GO) biological process clusters of the significantly upregulated mRNA transcripts in RNV. Color coding of the dots according to the adjusted p value, size of the dots according to the count of transcripts associated with the respective GO term. ECM, extracellular matrix. (D) Cnetplot of the top expressed genes in the most disease-relevant GO biological processes. Color coding of the transcripts according to the log 2 fold change of mean expression. (E) Immunohistochemical staining for FN1 (upper panel) and SPARC (lower panel) in RNV samples. Higher magnification of the sections within the dashed white square is shown to the right. Arrowhead points to the ILM, adjacent to the RNV. Nuclei are counterstained with DAPI. (F) Immunohistochemical staining for FN1 (upper panel) and SPARC (lower panel) in internal limiting membrane (ILM) samples. Nuclei are counterstained with DAPI. Scale bars correspond to 100 μm.
Figure 4
Figure 4
Single-cell protein analysis of retinal neovascularization (RNV) reveals a pro-fibrotic inflammatory phenotype. (A) Highly multiplexed Imaging Mass Cytometry data was segmented into cellular masks via supervised machine learning. Finally, single-cell data was extracted and cells were attributed to 24 distinct clusters using Phenograph on an opt-SNE map. The data were further plotted to the cellular origin (RNV samples in magenta and epiretinal membrane (ERM) samples in yellow). (B) Heatmap of marker signal intensity in the Phenograph clusters depicted in A. Z-score: deviation from a marker’s mean expression in standard deviation units. Annotation of clusters was performed according to specific marker expression. AP EC, antigen-presenting endothelial cells. APC, antigen-presenting cells. α-SMA+ EC, α-smooth muscle actin positive endothelial cells. StrC, stroma cells. MyoFb, myofibroblasts. mono-der. Mac, monocyte-derived macrophages. VEGF+ IC, vascular endothelial growth factor positive immune cells. prol. EC, proliferating endothelial cells. (C) Cluster assembly was compared between RNV and ERM and visualized in stacked bar charts displaying mean counts per group. Multiplexed staining for HLA-DR (human leukocyte antigen – DR isotype, green), α-SMA (α-smooth muscle actin, yellow), Histone H3 (blue) and COL1 (collagen type I, white) was performed on RNV (D) and ERM (E) samples. The single stainings (α-SMA and HLA-DR) for the section within the dashed white square are shown in the panels to the right. Arrowheads point to double-positive HLA-DR+α-SMA+ cells. Asterisks indicate α-SMA-HLA-DR+ cells. Scale bars correspond to 100 μm. (F) Absolute cell counts of double-positive HLA-DR+α-SMA+ cells were compared between RNV (magenta) and ERM (yellow) tissue samples. Data are presented as box-and-whiskers plots. Each dot represents one sample. (G) Upper panel: schematic illustrating the workflow for cultivation and staining of human hyalocytes. Lower panel: immunohistochemical staining of hyalocytes from a PDR patient for IBA-1 (green), α-SMA (yellow) and Phalloidin (red). Nuclei are counterstained with DAPI (4′,6-Diamidin-2-phenylindol). Scale bars correspond to 50 μm.
Figure 5
Figure 5
Transcriptome-based drug repurposing for application in retinal neovascularization. (A) Heatmap of drugs for potential application in treatment of retinal neovascularization. The enrichment score was calculated for drugs, associated with the modulation of four disease-relevant processes: “angiogenesis” (red), “innate immunity” (green), “adaptive immunity” (ocher) and “extracellular structure organization” (lilac). The drugs are ordered according to the sum of enrichment score and mean of percentage of overlapping genes associated with the four biological processes. (B) Gene set enrichment analysis (GSEA) enrichment score curves for the most prominent drugs in above-mentioned analysis – verteporfin and imatinib. The green curves in the upper part of both graphs depict the enrichment score, which is the running sum of the weighted enrichment score for the respective drug. The lower parts show the ranked list of RNV genes ordered by llog2 fold change (RNV vs. ILM); every gene, which is downregulated by the indicated drug, is represented by a black bar in the middle of the plots.

References

    1. Cheung N, Mitchell P, Wong TY. Diabetic Retinopathy. Lancet (2010) 376:124–36. doi: 10.1016/S0140-6736(09)62124-3 - DOI - PubMed
    1. Lange CA, Stavrakas P, Luhmann UF, de Silva DJ, Ali RR, Gregor ZJ, et al. . Intraocular Oxygen Distribution in Advanced Proliferative Diabetic Retinopathy. AmJOphthalmol (2011) 152:406–12. doi: 10.1016/j.ajo.2011.02.014 - DOI - PubMed
    1. Lange CAK, Bainbridge JWB. Oxygen Sensing in Retinal Health and Disease. Ophthalmologica (2012) 227:115–31. doi: 10.1159/000331418 - DOI - PubMed
    1. Stitt AW, Curtis TM, Chen M, Medina RJ, McKay GJ, Jenkins A, et al. . The Progress in Understanding and Treatment of Diabetic Retinopathy. Prog Retinal Eye Res (2016) 51:156–86. doi: 10.1016/j.preteyeres.2015.08.001 - DOI - PubMed
    1. El Rami H, Barham R, Sun JK, Silva PS. Evidence-Based Treatment of Diabetic Retinopathy. Semin Ophthalmol (2017) 32:67–74. doi: 10.1080/08820538.2016.1228397 - DOI - PubMed

Publication types

MeSH terms