. 2021 Dec;16(12):124004.
doi: 10.1088/1748-9326/ac3288. Epub 2021 Nov 15.

Regional disparities and seasonal differences in climate risk to rice labour

Affiliations

Regional disparities and seasonal differences in climate risk to rice labour

Charles Simpson et al. Environ Res Lett. 2021 Dec.

Abstract

The 880 million agricultural workers of the world are especially vulnerable to increasing heat stress due to climate change, affecting the health of individuals and reducing labour productivity. In this study, we focus on rice harvests across Asia and estimate the future impact on labour productivity by considering changes in climate at the time of the annual harvest. During these specific times of the year, heat stress is often high compared to the rest of the year. Examining climate simulations of the Coupled Model Intercomparison Project 6 (CMIP6), we identified that labour productivity metrics for the rice harvest, based on local wet-bulb globe temperature, are strongly correlated with global mean near-surface air temperature in the long term (p ≪ 0.01, R 2 > 0.98 in all models). Limiting global warming to 1.5 °C rather than 2.0 °C prevents a clear reduction in labour capacity of 1% across all Asia and 2% across Southeast Asia, affecting the livelihoods of around 100 million people. Due to differences in mechanization between and within countries, we find that rice labour is especially vulnerable in Indonesia, the Philippines, Bangladesh, and the Indian states of West Bengal and Kerala. Our results highlight the regional disparities and importance in considering seasonal differences in the estimation of the effect of climate change on labour productivity and occupational heat-stress.

Keywords: agriculture; climate change; heat stress; seasonal.


Figures

Figure 1.
Figure 1.
Geographical distribution of rice production across Asia (green shading). Sub-national locations mentioned in the article are labelled. Data sourced from RiceAtlas.
Figure 2.
Figure 2.
Rice harvest weight and area in Asia, plotted against month. Data from RiceAtlas.
Figure 3.
Figure 3.
Locations of a rice harvests by season. Areas with a rice harvest in a given season are shown in blue. Data from RiceAtlas.
Figure 4.
Figure 4.
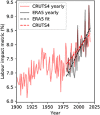
Annual Asia-wide mean labour impact, weighted by total rice production, calculated from CRU-TS 4.03 (red lines) and ERA5 (black line), with trend lines (dashed) shown for the period 1980–2018.
Figure 5.
Figure 5.
Relationship between rice labour impact and GSAT change in the 14 analysed CMIP6 climate models; Changes are relative to 1.0 C of warming relative to 1850–1900, which is assumed to represent the present. Three levels of warming relative to 1850–1900 and relative to the present are shown for context. The present estimated range of warming is shown by the grey shading. (a) Change in labour impacts against GSAT for 20 year periods; each shape/colour corresponds to a different model The black trend line is illustrative only: fit statistics mentioned in the text are based on fitting each climate model individually. (b) Change in labour impacts at three levels of warming, with box plot to show climate model spread. Points are linearly interpolated to the three levels of warming. Boxes show 1st (Q1) and 3rd quartile (Q3); orange line at the median; lower whiskers at lowest point above Q1–1.5*(Q3–Q1), upper whiskers highest point below Q1 + 1.5*(Q3–Q1); circles are points outside the whisker range. We define hazard gradient as the gradient between GSAT and local labour impact.
Figure 6.
Figure 6.
Histograms showing the distribution of hazard gradient across harvest seasons and locations. The effect of seasonal weighting assumptions on the hazard gradient is shown: the blue histogram represents the assumption that the whole year is equally weighted, while the orange histogram shows the result if only the rice harvest season is included. The histograms are weighted by the harvest weight in millions of tonnes.
Figure 7.
Figure 7.
Map of Asia with shading representing proportion of rice production in harvests for which labour capacity is identified as being in the higher 50% of hazard-gradient.
Figure 8.
Figure 8.
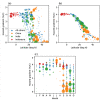
Scatter plots, with marker size proportional to total harvest weight, of hazard gradient for each location and season: (a) plotted against latitude, selecting only the peak of the rice harvest; (b) plotted against latitude, averaged over the whole year equally; (c) plotted against peak month of harvest. Colours identify points belonging to China, India, and Indonesia. Hazard gradients are multi-model means. In order to reduce the number of markers, some aggregation was performed: in both cases the mean weighted by total weight of harvested rice was taken; the results were aggregated to the 2nd level HASC geocode, independently for each month.

References

    1. International Labour Organization Employment by sex and economic activity—ILO modelled estimates. 2019. available at: https://ilostat.ilo.org/
    1. Moyce S, Mitchell D, Armitage T, Tancredi D, Joseph J, Schenker M. Heat strain, volume depletion and kidney function in California agricultural workers. Occup. Environ. Med. 2017;74:402–9. doi: 10.1136/oemed-2016-103848. - DOI - PMC - PubMed
    1. Crowe J, Wesseling C, Solano B R, Umaña M P, Ramírez A R, Kjellstrom T, Morales D, Nilsson M. Heat exposure in sugarcane harvesters in Costa Rica. Am. J. Ind. Med. 2013;56:1157–64. doi: 10.1002/ajim.22204. - DOI - PubMed
    1. Sahu S, Sett M, Kjellstrom T. Heat exposure, cardiovascular stress and work productivity in rice harvesters in India: implications for a climate change future. Ind. Health. 2013;51:424–31. doi: 10.2486/indhealth.2013-0006. - DOI - PubMed
    1. Zhao Y, Ducharne A, Sultan B, Braconnot P, Vautard R. Estimating heat stress from climate-based indicators: present-day biases and future spreads in the CMIP5 global climate model ensemble. Environ. Res. Lett. 2015;10:084013. doi: 10.1088/1748-9326/10/8/084013. - DOI

LinkOut - more resources