. 2021 Aug 30;21(5):e33.
doi: 10.4110/in.2021.21.e33. eCollection 2021 Oct.

Induction of Unique STAT Heterodimers by IL-21 Provokes IL-1RI Expression on CD8+ T Cells, Resulting in Enhanced IL-1β Dependent Effector Function

Affiliations

Induction of Unique STAT Heterodimers by IL-21 Provokes IL-1RI Expression on CD8+ T Cells, Resulting in Enhanced IL-1β Dependent Effector Function

Dong Hyun Kim et al. Immune Netw. .

Abstract

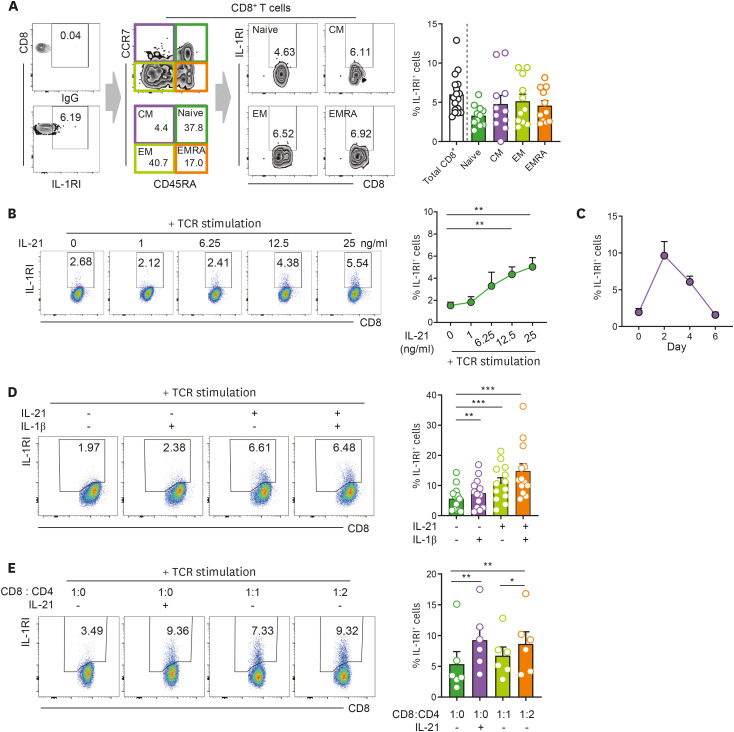
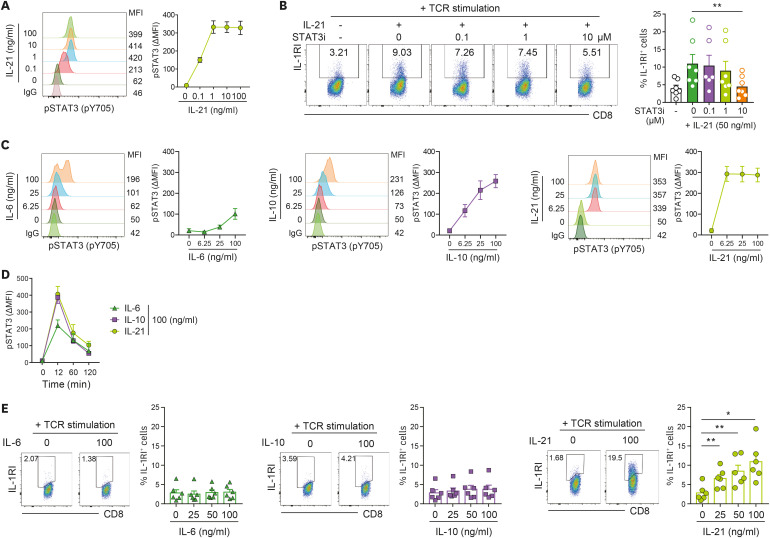
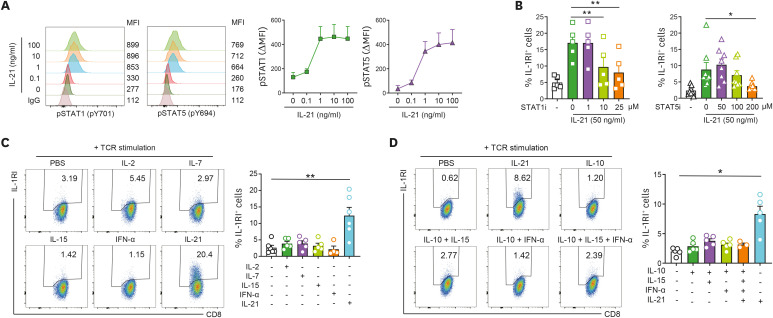
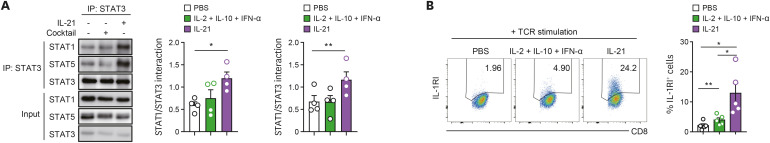
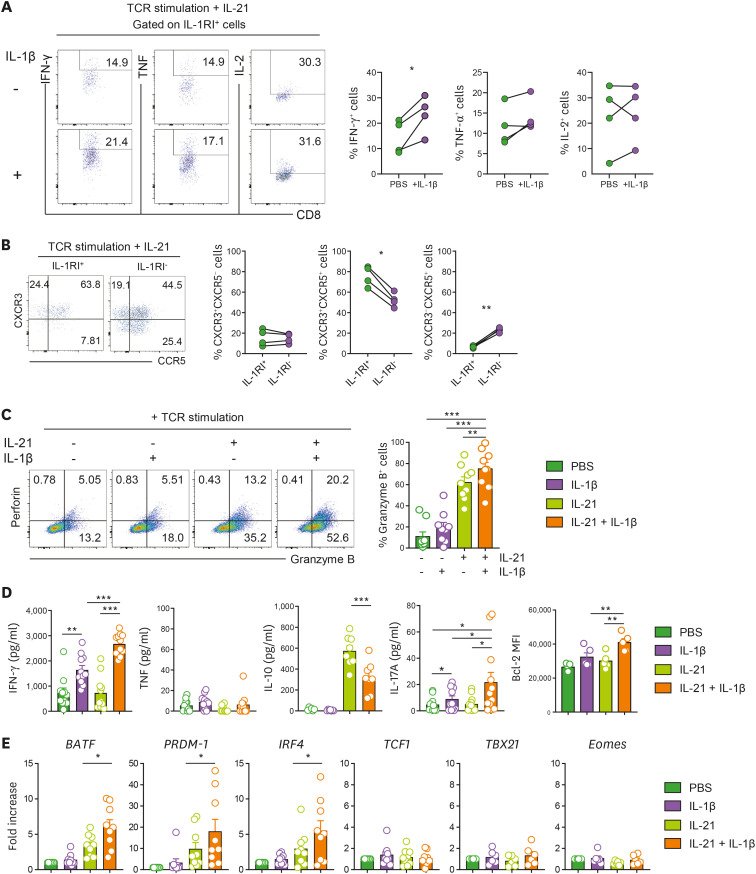
IL-1β plays critical roles in the priming and effector phases of immune responses such as the differentiation, commitment, and memory formation of T cells. In this context, several reports have suggested that the IL-1β signal is crucial for CTL-mediated immune responses to viral infections and tumors. However, little is known regarding whether IL-1β acts directly on CD8+ T cells and what the molecular mechanisms underlying expression of IL-1 receptors (IL-1Rs) on CD8+ T cells and features of IL-1R+CD8+ T cells are. Here, we provide evidence that the expression of IL-1R type I (IL-1RI), the functional receptor of IL-1β, is preferentially induced by IL-21 on TCR-stimulated CD8+ T cells. Further, IL-1β enhances the effector function of CD8+ T cells expressing IL-21-induced IL-1RI by increasing cytokine production and release of cytotoxic granules containing granzyme B. The IL-21-IL-1RI-IL-1β axis is involved in an augmented effector function through regulation of transcription factors BATF, Blimp-1, and IRF4. Moreover, this axis confers a unique effector function to CD8+ T cells compared to conventional type 1 cytotoxic T cells differentiated with IL-12. Chemical inhibitor and immunoprecipitation assay demonstrated that IL-21 induces a unique pattern of STAT activation with the formation of both STAT1:STAT3 and STAT3:STAT5 heterodimers, which are critical for the induction of IL-1RI on TCR-stimulated CD8+ T cells. Taken together, we propose that induction of a novel subset of IL-1RI-expressing CD8+ T cells by IL-21 may be beneficial to the protective immune response against viral infections and is therefore important to consider for vaccine design.

Keywords: Cytotoxic T Lymphocyte; IL-1 Beta; IL-1 Receptor; IL-21; STAT transcription factors; Tc1 cells.


Conflict of interest statement

Conflict of Interest: The authors declare no potential conflicts of interest.

Figures

Figure 1
Figure 1. IL-21 induces the expression of IL-1RI on TCR-stimulated CD8+ T cells. (A) Representative flow cytometric plot of IL-1RI expression on total CD8+ T cells, naive (CD45RA+CCR7+), CM (CD45RACCR7+), EM (CD45RACCR7), and EMRA (CD45RA+CCR7) cell subsets from healthy controls. Frequency (%) of IL-1RI+ cells in indicated T-cell populations. (B) Representative flow cytometric plot and the frequency (%) of IL-1RI expression on TCR-stimulated CD8+ T cells in the presence of the indicated concentration of rhIL-21. (C) Time kinetics of IL-21-induced IL-1RI expression on TCR-stimulated CD8+ T cells. (D) Representative flow cytometric plot and frequency (%) of IL-1RI on TCR-stimulated CD8+ T cells treated with rhIL-21 (25 ng/ml) and/or rhIL-1β (25 ng/ml) at day 2 post-stimulation. (E) Co-culture of purified human CD4+ and CD8+ T cells in the presence of TCR stimulation. Purified cells were seeded at the indicated ratio and cultured with anti-CD3/28 coated microbeads in the absence or presence of rhIL-21 (50 ng/ml) for 2 days. Bar graphs show the mean±SEM. The statistical significance was measured by 2-tailed paired t-test.
CM, central memory; EM, effector memory; EMRA, CD45RA+ effector memory. *p<0.05, **p<0.01, ***p<0.005.
Figure 2
Figure 2. STAT3 activation is necessary, but not sufficient, for induction of IL-1RI on TCR-stimulated CD8+ T cells. (A) Phosphorylation of STAT3 (pY705) in IL-21-stimulated CD8+ T cells. The cells were stimulated with the indicated concentration of rhIL-21 for 12 min. A phospho-protein specific flow cytometric analysis (Phosflow assay) was used to detect pSTAT3. (B) Representative flow cytometric plot and the frequency (%) of IL-1RI expression on TCR-stimulated CD8+ T cells. Cells were treated with rhIL-21 (50 ng/ml) in the presence of the indicated concentrations of the 5,15-DPP STAT3i. (C) Flow cytometric analysis of pSTAT3 (pY705) in IL-6 (100 ng/ml), IL-10 (100 ng/ml), or IL-21 (100 ng/ml)-stimulated CD8+ T cells. Cells were stimulated with the indicated concentration of cytokines for 12 min (n=4). (D) Kinetics of STAT3 phosphorylation in CD8+ T cells treated with IL-6, IL-10, or IL-21 (n=4). (E) Representative flow cytometric plot and the frequency (%) of IL-1RI expression on TCR-stimulated CD8+ T cells treated with exogenous IL-6, IL-10, or IL-21 for 2 days. Bar graphs and line graphs show the mean±SEM. The statistical significance was measured by 2-tailed paired t-test.
MFI, mean fluorescence intensity. *p<0.05, **p<0.01.
Figure 3
Figure 3. An IL-21-specific STAT signaling pathway is preferentially involved in the induction of IL-1RI on CD8+ T cells. (A) Phosphorylation of STAT1 (pY701) and STAT5 (pY694) in IL-21-stimulated CD8+ T cells. (B) Frequency (%) of IL-1RI expression on TCR-stimulated CD8+ T cells treated with rhIL-21 (50 ng/ml) in the presence of the indicated concentrations of Fludarabine, STAT1i, or CAS 285986-31-4, a STAT5i, at day 2 post-stimulation. (C) Representative flow cytometric plot and the frequency (%) of IL-1RI expression on TCR-stimulated CD8+ T cells treated with various STAT1- or STAT5-activating cytokines (rhIL-2 [250 IU/ml], rhIL-7 [50 ng/ml], rhIL-15 [50 ng/ml], IFN-α [50 ng/ml], or rhIL-21 [50 ng/ml]). (D) Representative flow cytometric plot and the frequency (%) of IL-1RI expression on CD8+ T cells stimulated with anti-CD3/28 coated microbeads and various combinations of STAT1, STAT3, and STAT5-activating cytokines (rhIL-10 [50 ng/ml], rhIL-15 [50 ng/ml], IFN-α [50 ng/ml], or rhIL-21 [50 ng/ml]). Bar graphs and line graphs show the mean±SEM of independent experiments. The statistical significance was measured by 2-tailed paired t-test.
*p<0.05, **p<0.01.
Figure 4
Figure 4. The induction of IL-1RI expression is attributable to the IL-21 mediated formation of STAT1:STAT3 and STAT3:STAT5 heterodimers. (A) STAT3 interacts with both STAT1 and STAT5 in IL-21-stimulated CD8+ T cells. Purified human CD8+ T cells were stimulated for 30 min with anti-CD3/CD28 and rhIL-21 (100 ng/ml) or a combination of STAT1, STAT3, and STAT5-activating cytokines (IFN-α [100 ng/ml], IL-10 [100 ng/ml], and IL-2 [500 IU/ml]). Anti-STAT1, STAT3, or STAT5 Ab immunoblot of anti-STAT3 Ab immunoprecipitates. (B) Representative flow cytometric plot and the frequency (%) of IL-1RI expression on TCR-stimulated CD8+ T cells in the presence of the indicated cytokines at day 2 post-stimulation. Bar graphs show the mean±SEM of independent experiments. The statistical significance was measured by 2-tailed paired t-test.
*p<0.05, **p<0.01.
Figure 5
Figure 5. IL-1β signaling mediated by IL-21-induced IL-1RI enhances the effector function of CD8+ T cells. (A) Representative flow cytometric plot and the frequency of IFN-γ, TNF, or IL-2-producing IL-1RI+CD8+ T cells. Cells were stimulated for 3 days with anti-CD3/28 coated microbeads and rhIL-21 (50 ng/ml) in the absence or presence of IL-1β (50 ng/ml). (B) Representative flow cytometric plot and the frequency (%) of CXCR3 and CCR5-expressing IL-1RI+CD8+ and IL-1RI-CD8+ T cells at day 2 post-stimulation. (C-E) Enhanced effector function of CD8+ T cells by IL-21 and IL-1β. Purified naive CD8+ T cells were stimulated for 5 days with anti-CD3/28 coated microbeads and rhIL-21 (50 ng/ml) in the absence or presence of rhIL-1β (50 ng/ml). Representative flow cytometric plot and the frequency (%) of GzmB+ cells (C). The amount of IFN-γ, TNF, IL-10, and IL-17A in the culture supernatant (ELISA) (D). Relative gene expression of transcription factors BATF, PRDM-1 (Blimp-1), IRF4, TCF1, TBX21, and Eomes. (E). Quantitative PCR analysis of target gene expression by CD8 T cells under the indicated conditions. Expression was normalized to β-actin, and the comparative Ct method was used for the quantification of gene expression. Bar graphs show the mean±SEM of independent experiments. The statistical significance was measured by 2-tailed paired t-test.
PRDM1, encoding the Blimp1 transcription factor. *p<0.05, **p<0.01, ***p<0.005.

References

    1. Ren K, Torres R. Role of interleukin-1beta during pain and inflammation. Brain Res Brain Res Rev. 2009;60:57–64. - PMC - PubMed
    1. Lasigliè D, Traggiai E, Federici S, Alessio M, Buoncompagni A, Accogli A, Chiesa S, Penco F, Martini A, Gattorno M. Role of IL-1 beta in the development of human T(H)17 cells: lesson from NLPR3 mutated patients. PLoS One. 2011;6:e20014. - PMC - PubMed
    1. Sims JE, Smith DE. The IL-1 family: regulators of immunity. Nat Rev Immunol. 2010;10:89–102. - PubMed
    1. Sha Y, Markovic-Plese S. A role of IL-1R1 signaling in the differentiation of Th17 cells and the development of autoimmune diseases. Self Nonself. 2011;2:35–42. - PMC - PubMed
    1. Garlanda C, Dinarello CA, Mantovani A. The interleukin-1 family: back to the future. Immunity. 2013;39:1003–1018. - PMC - PubMed