. 2021 Nov 1;5(11):e2021GH000490.
doi: 10.1029/2021GH000490. eCollection 2021 Nov.

Modeling Untreated Wastewater Evolution and Swimmer Illness for Four Wastewater Infrastructure Scenarios in the San Diego-Tijuana (US/MX) Border Region

Affiliations

Modeling Untreated Wastewater Evolution and Swimmer Illness for Four Wastewater Infrastructure Scenarios in the San Diego-Tijuana (US/MX) Border Region

Falk Feddersen et al. Geohealth. .

Abstract

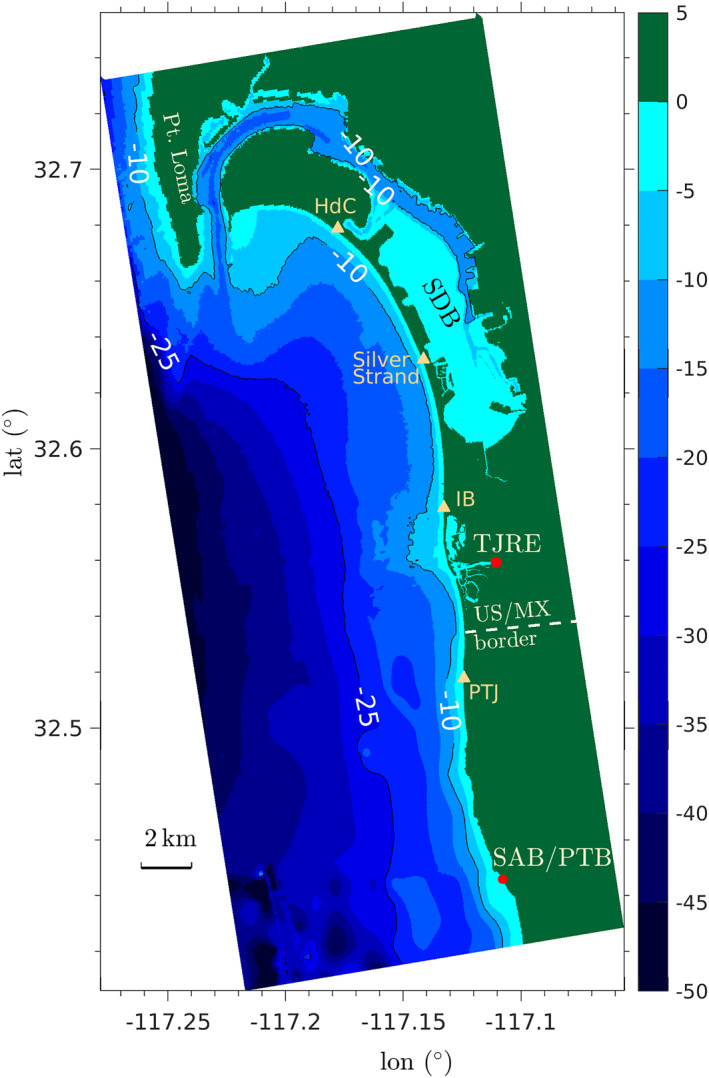
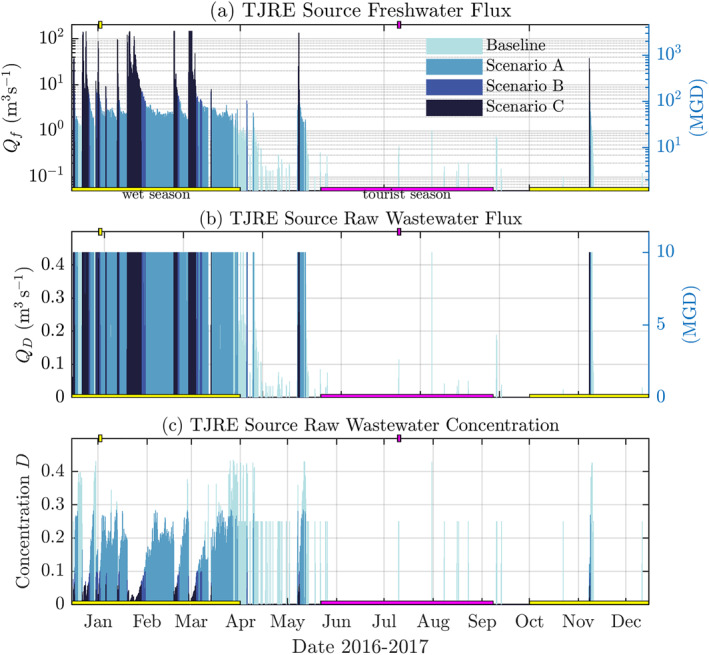
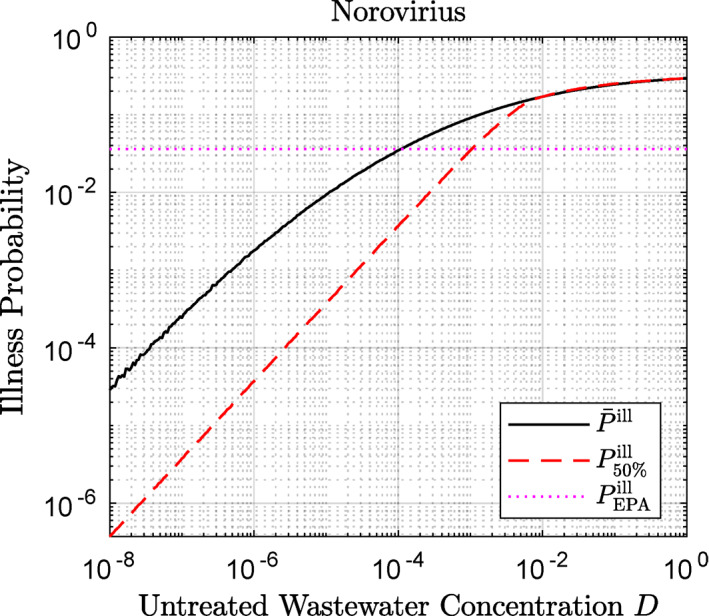
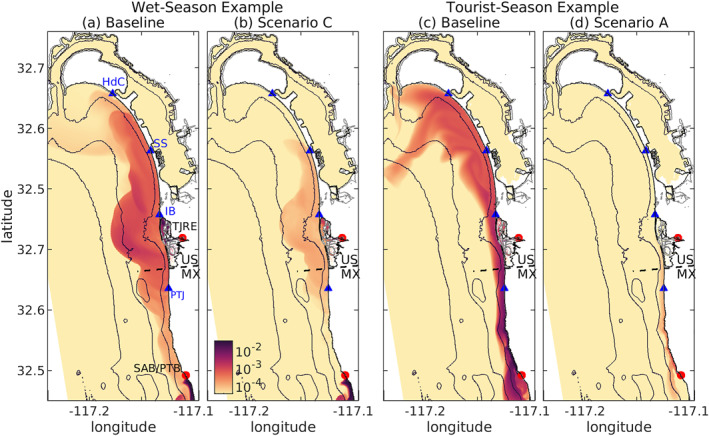
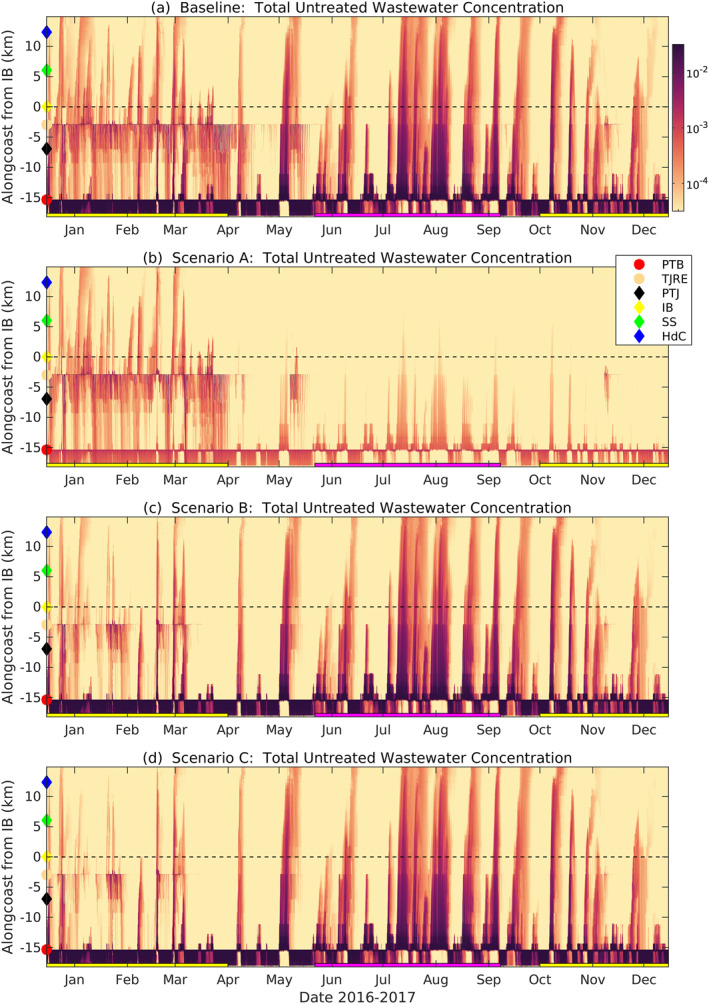
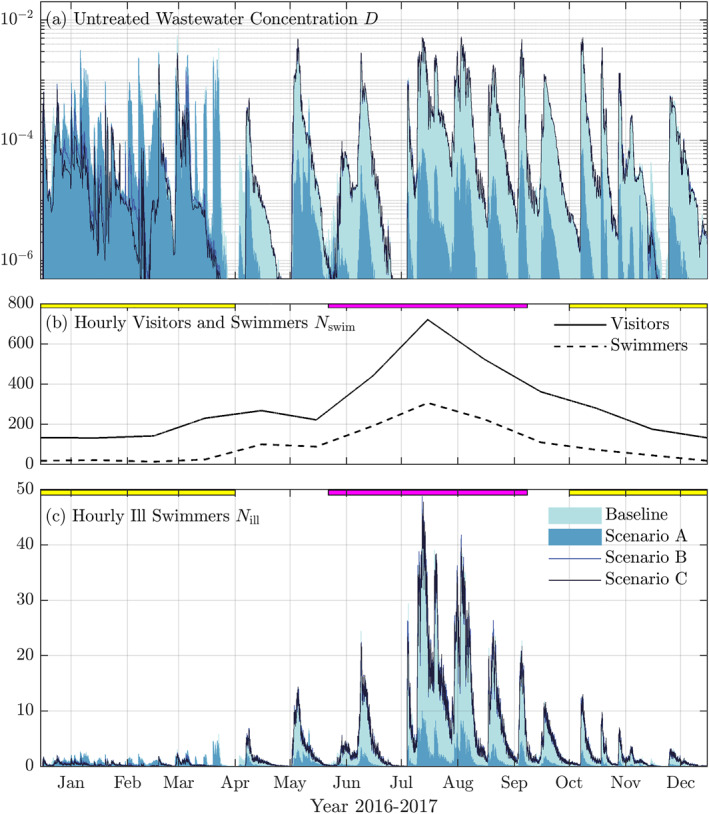
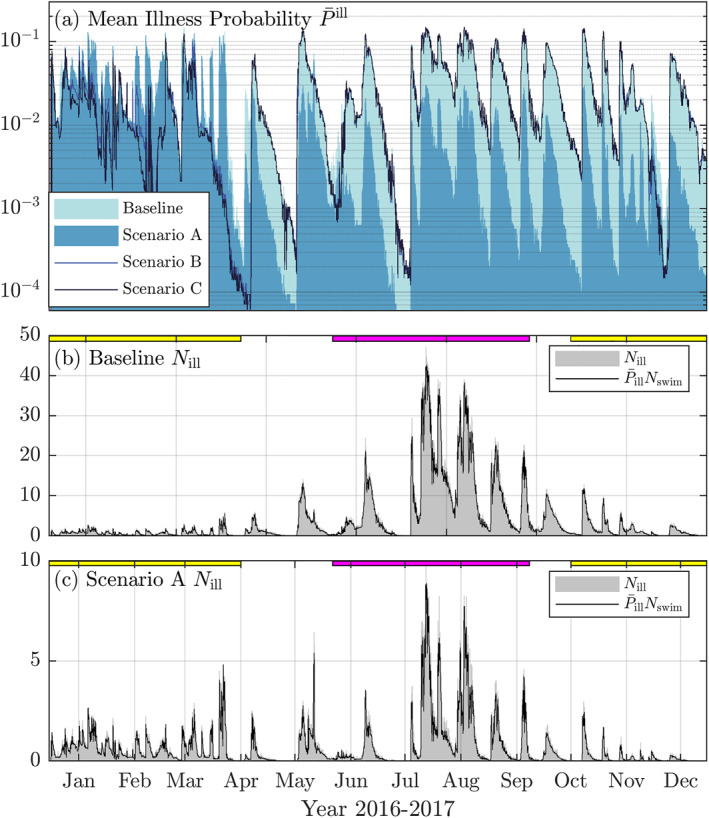
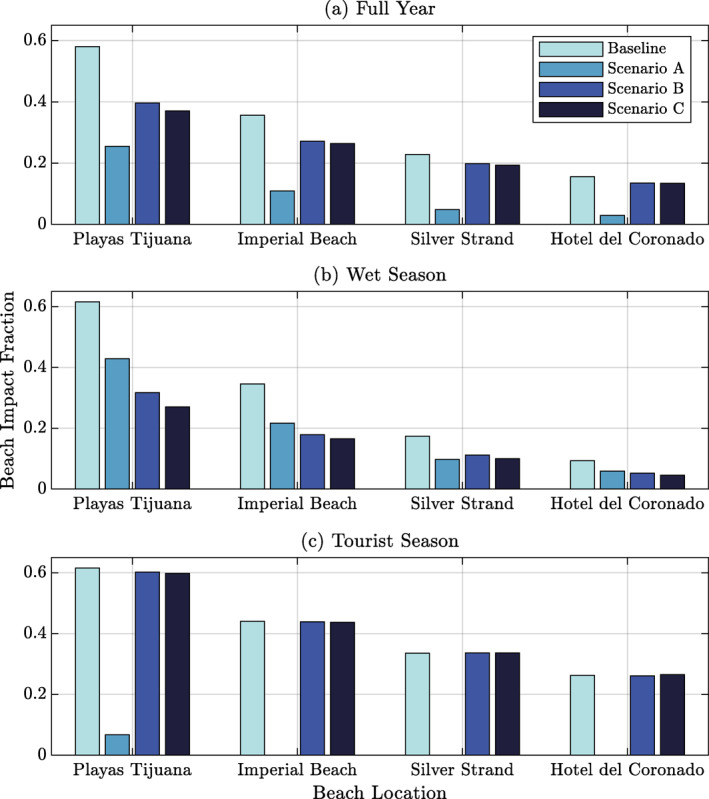
The popular beaches of the San Diego-Tijuana (US/MX) border region are often impacted by untreated wastewater sourced from Mexico-via the Tijuana River Estuary (TJRE) and San Antonio de los Buenos outfall at the Pt. Bandera (SAB/PTB) shoreline, leading to impacted beaches and human illness. The US-Mexico-Canada trade agreement will fund border infrastructure projects reducing untreated wastewater discharges. However, estimating project benefits such as reduced human illness and beach impacts is challenging. We develop a coupled hydrodynamic, norovirus (NoV) pathogen, and swimmer illness risk model with the wastewater sources for the year 2017. The model is used to evaluate the reduction in human illness and beach impacts under baseline conditions and three infrastructure diversion scenarios which (Scenario A) reduce SAB/PTB discharges and moderately reduce TJRE inflows or (Scenarios B, C) strongly reduce TJRE in inflows only. The model estimates shoreline untreated wastewater and NoV concentrations, and the number of NoV ill swimmers at Imperial Beach CA. In the Baseline, the percentage of swimmers becoming ill is 3.8% over 2017, increasing to 4.5% during the tourist season (Memorial to Labor Day) due to south-swell driven SAB/PTB plumes. Overall, Scenario A provides the largest reduction in ill swimmers and beach impacts for the tourist season and full year. The 2017 tourist season TJRE inflows were not representative of those in 2020, yet, Scenario A likely still provides the greatest benefit in other years. This methodology can be applied to other coastal regions with wastewater inputs.

Keywords: San Diego; Tijuana; human health; norovirus; surfzone; transport and dilution.


Conflict of interest statement

The authors declare no conflicts of interest relevant to this study.

Figures

Figure 1
Figure 1
San Diego Bight (US/Mexico border region) model domain as a function of latitude and longitude spanning Pt. Loma to south of Punta Bandera (PB) Mexico with bathymetry shown in color. The untreated wastewater sources at the Tijuana River Estuary (TJRE) and the San Antonio de los Buenos outfall located at the shoreline of Punta Bandera (SAB/PTB) are indicated as red dots. Point Loma and the US‐Mexico border are labeled. Orange triangles indicate the popular beach locations of Playas Tijuana (PTJ), Imperial Beach (IB), Silver Strand State Beach, and Hotel del Coronado (HdC).
Figure 2
Figure 2
Timeseries of Tijuana River Estuary (TJRE) inputs over the year 2017 (December 15, 2016 to December 15, 2017) for the four scenarios: (a) freshwater flux Q f (m3 s−1) and (right) million gallons per day MGD, (b) untreated wastewater flux Q D (m3 s−1), and (c) resulting source untreated wastewater concentration D. Colors indicate the Baseline, Scenario A (35 MGD diversion limit), Scenario B (100 MGD diversion limit), and Scenario C (163 MGD diversion limit) as indicated in the legend (see also Table 1). A scenario color is only shown if the diversion limit is exceeded. Thus, a time‐period with Scenario C inflows (darkest blue) also have identical inflows for all Scenarios. However, a time period of Scenario A inflows, has identical Baseline inflows, but no Scenario B or C inflows. At the bottom of all panels, magenta and yellow bars indicate the tourist season (22 May to 8 September) and wet season (1 October to 1 April), respectively. Yellow and magenta markers at the top of each panel indicate the time of the wet and tourist season examples (Figure 4).
Figure 3
Figure 3
P ill versus untreated wastewater concentration D showing expected (mean) probability P¯ill, median probability P50%ill, and the EPA threshold PEPAill=0.036 (USEPA, 2012) as indicated in the legend.
Figure 4
Figure 4
(a and b) Wet‐season case example from January 3, 2017 10:00 UTC of modeled surface (a) Baseline and (b) Scenario C untreated wastewater concentration D. (c and d) Tourist season case example from July 11, 2017 14:00 UTC of modeled surface (c) Baseline and (d) Scenario A untreated wastewater concentration D. Red dots indicate locations of Tijuana River Estuary (TJRE) and San Antonio de los Buenos outfall at the Pt. Bandera (SAB/PTB) sources. Blue triangles mark specific beaches: Playas Tijuana (PTJ), Imperial Beach Pier (IB), Silver Strand State Beach (SS), and the Hotel del Coronado (HdC). The dashed line marks the US‐Mexico border. These example times are indicated in Figure 2. For the wet season examples (a and b), the TJRE freshwater and untreated wastewater flux (averaged over the preceding 48 hr) are Q f  = {4.04, 0.32} m3 s−1 and Q D  = {0.44, 0.018} m3 s−1, respectively for the Baseline and Scenario C. For the tourist season examples (c and d), the TJRE freshwater and untreated wastewater flux (averaged over the preceding 48 hr) are Q f  = {0.04, 0} m3 s−1 and Q D  = {0.01, 0} m3 s−1, respectively for the Baseline and Scenario A. Note, in wet season (a and b), Scenario A is very similar to the Baseline and Scenario B is similar with slightly elevated D to Scenario C. In tourist season (c and d), Scenarios B and C are nearly identical to the Baseline.
Figure 5
Figure 5
Shoreline untreated wastewater concentration D versus time and alongcoast distance from Imperial Beach CA for the (a) Baseline, (b) Scenario A, (c) Scenario B, and (d) Scenario C. The San Antonio de los Buenos outfall at the Pt. Bandera (SAB/PTB) and Tijuana River Estuary (TJRE) sources are indicated on the ordinate as circles. Other alongcoast locations are indicated on the ordinate including Punta Bandera (PTB red), Playas Tijuana (PTJ, black), the mouth of TJRE (magenta), Imperial Beach (IB) pier (yellow, dashed line), Silver Strand State Beach (SS, green), and Hotel del Coronado (HdC, blue). The tourist (22 May to 8 September) and wet (1 October to 1 April) seasons are indicated with magenta and yellow bars, respectively, at the bottom of each panel.
Figure 6
Figure 6
Timeseries at Imperial Beach CA of shoreline (a) untreated wastewater concentration D, (b) hourly beach visitors and swimmers N swim and (c) hourly ill swimmers N ill for the four scenarios. Panels (a and c) colors correspond to the four scenarios (see legend). The wet and tourist seasons are indicated with yellow and magenta bars at top of panels (b and c). In panel (a), D is extracted along the dashed line in Figure 5. Note, during most of the tourist season, Scenario B and C are nearly identical to each other (and to the Baseline) leading to indistinguishable lines. Similarly during the wet season, Scenario A results in only slightly lower D and N ill relative to the Baseline which is nearly indistinguishable.
Figure 7
Figure 7
Timeseries at Imperial Beach CA of (a) mean norovirus illness probability P¯ill for the four scenarios (legend) and (b and c) number of hourly ill swimmers N ill and P¯illNswim (see legend) for (b) the Baseline and (c) Scenario A. Yellow and magenta bars at the top of panels (b and c) indicate the wet and tourist seasons. In (a) during most of tourist season, Scenarios B, C, and Baseline P¯ill are nearly identical. Similarly, during the wet season, Scenario A and Baseline P¯ill are very similar and thus nearly indistinguishable. In the Baseline (b), the squared correlation r 2 = 0.99 and the root‐mean‐square error (rmse) is 0.61 hourly swimmers over the full year between N ill and P¯illNswim. Similarly, for Scenario A (c), the squared correlation r 2 = 0.97 and the rmse is 0.57 over the full year. For reference, using P50%illNswim in (b and c) yields r 2 of 0.62 and 0.39 and rmse of 4.6 and 4.6, respectively.
Figure 8
Figure 8
Beach impact fraction at the four beach locations for the four scenarios (legend) over the (a) full year, (b) wet season, and (c) tourist season. Beach impact fraction is defined as the fraction of time that P¯ill>PEPAill (PEPAill=0.036, corresponding to D = 1.06 × 10−4). The locations Playas Tijuana, Imperial Beach, Silver Strand State Beach, and Hotel del Coronado are indicated in Figures 1, 4 and 5.

References

    1. ARCADIS . (2019). Tijuana river diversion study (Technical report). North American Development Bank. Retrieved from https://www.nadb.org/uploads/files/tijuana_river_diversion_study_final_r...
    1. Arnold, B. F. , Schiff, K. C. , Ercumen, A. , Benjamin‐Chung, J. , Steele, J. A. , Griffith, J. F. , et al. (2017). Acute illness among surfers after exposure to seawater in dry‐ and wet‐weather conditions. American Journal of Epidemiology, 186(7), 866–875. 10.1093/aje/kwx019 - DOI - PMC - PubMed
    1. Ayad, M. , Li, J. , Holt, B. , & Lee, C. (2020). Analysis and classification of stormwater and wastewater runoff from the Tijuana River using remote sensing imagery. Frontiers in Environmental Science, 8, 240. 10.3389/fenvs.2020.599030 - DOI
    1. Boehm, A. B. , Silverman, A. I. , Schriewer, A. , & Goodwin, K. (2019). Systematic review and meta‐analysis of decay rates of waterborne mammalian viruses and coliphages in surface waters. Water Research, 164, 114898. 10.1016/j.watres.2019.114898 - DOI - PubMed
    1. Boehm, A. B. , & Soller, J. (2020). Refined ambient water quality thresholds for human‐associated fecal indicator HF183 for recreational waters with and without co‐occurring gull fecal contamination. Microbial Risk Analysis, 16, 100139. 10.1016/j.mran.2020.100139 - DOI