Clinical Trial
. 2021 Sep;2(9):891-903.
doi: 10.1038/s43018-021-00234-4. Epub 2021 Jul 29.

Neoadjuvant Cabozantinib and Nivolumab Converts Locally Advanced HCC into Resectable Disease with Enhanced Antitumor Immunity

Affiliations
Clinical Trial

Neoadjuvant Cabozantinib and Nivolumab Converts Locally Advanced HCC into Resectable Disease with Enhanced Antitumor Immunity

Won Jin Ho et al. Nat Cancer. 2021 Sep.

Abstract

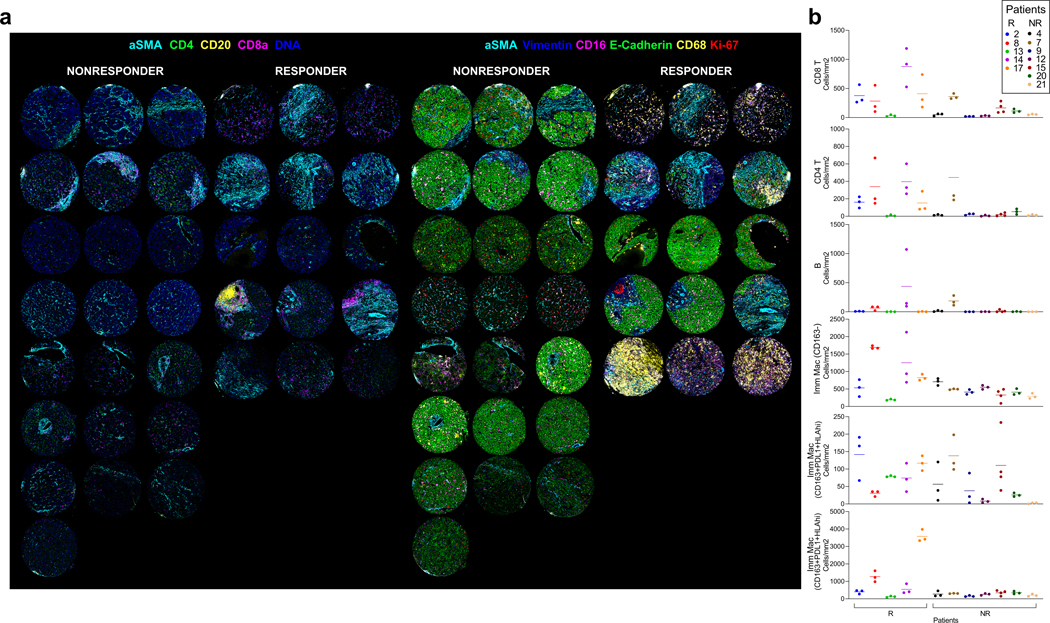
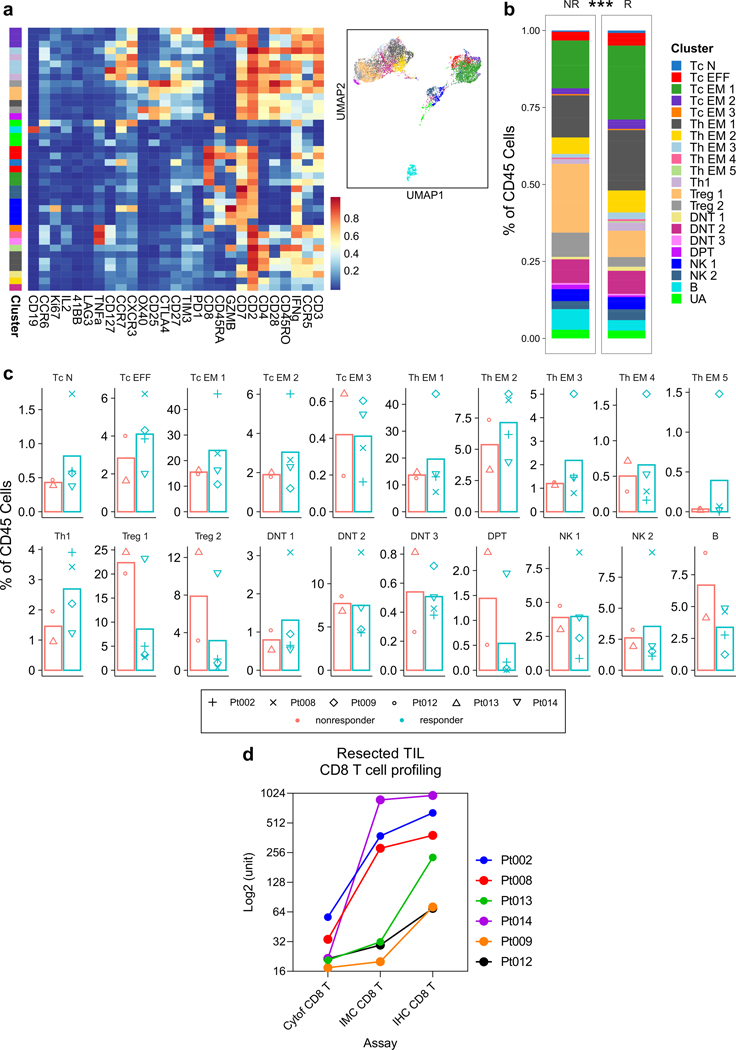
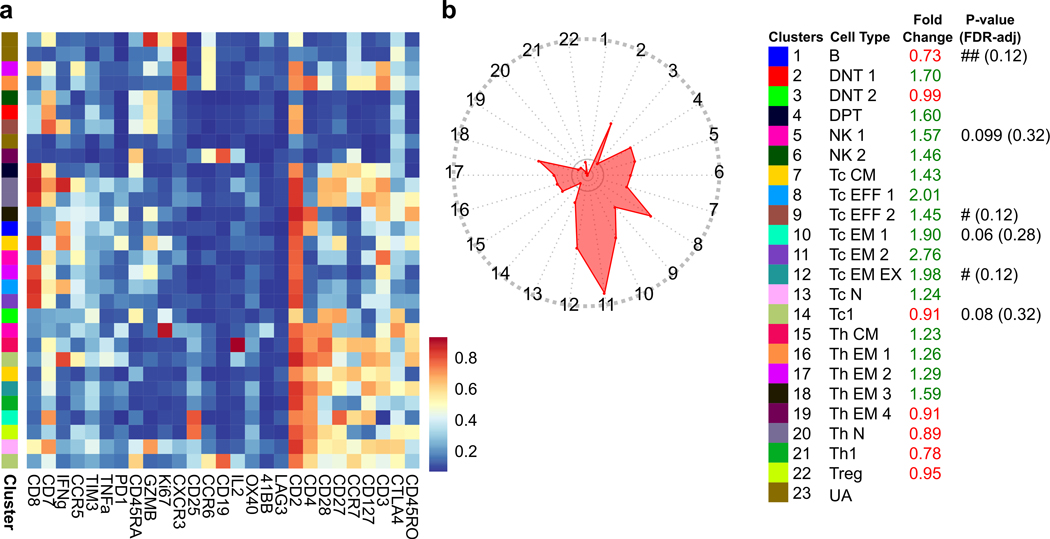
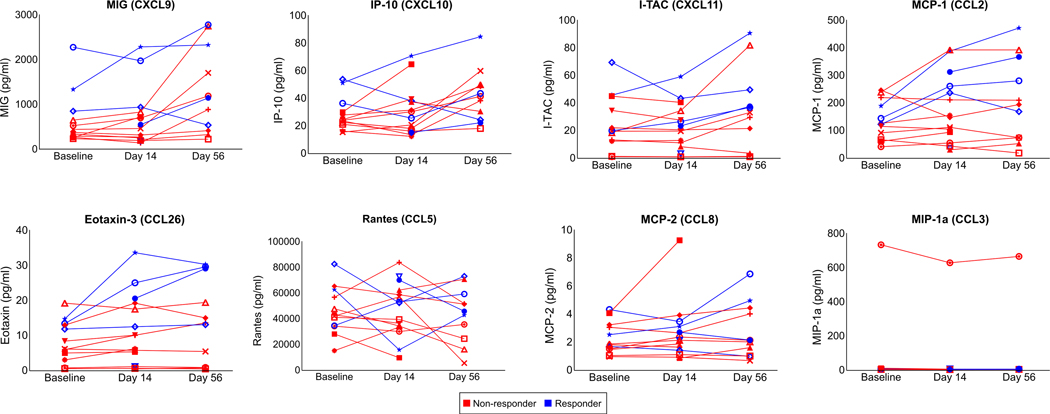
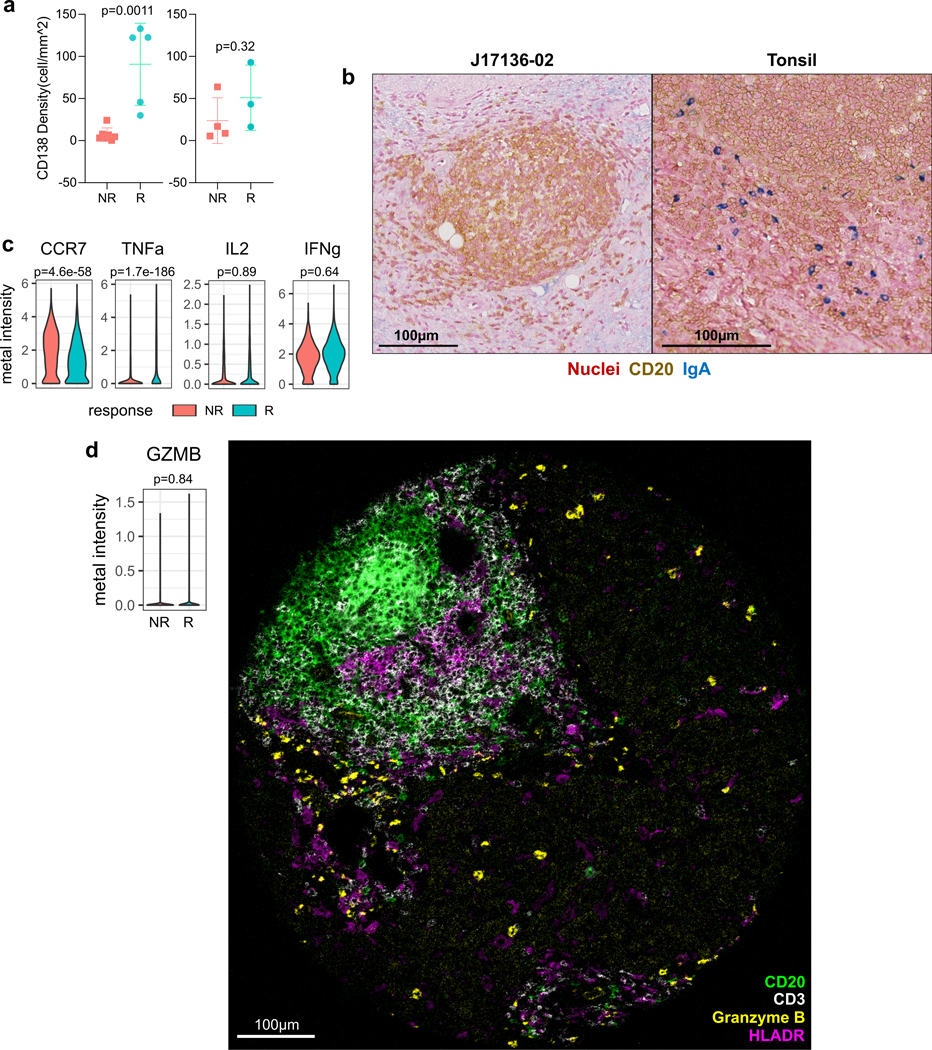
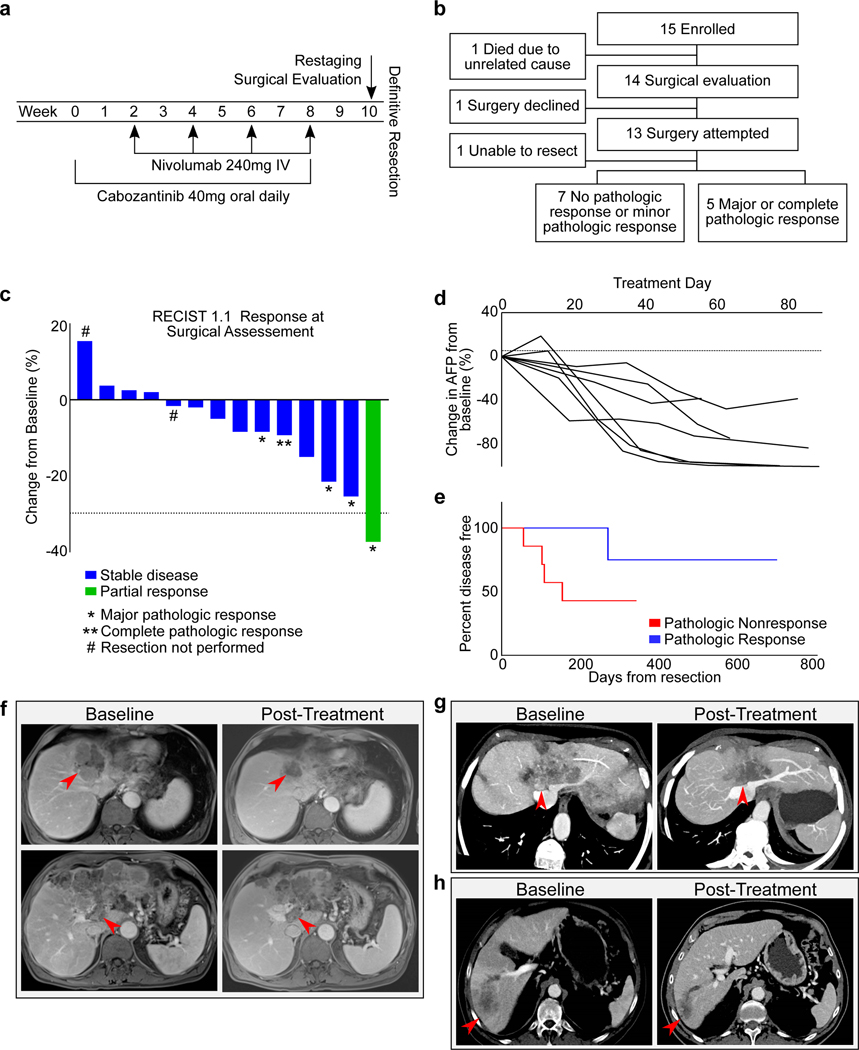
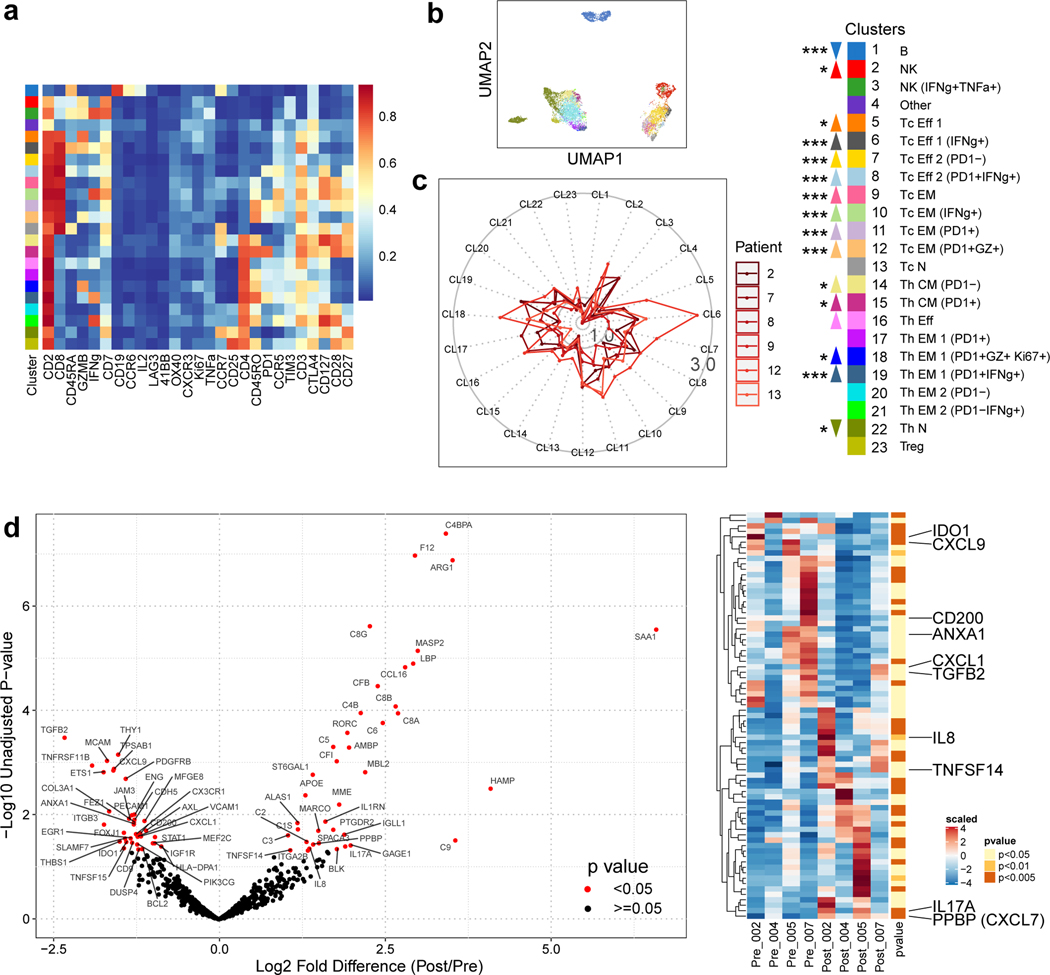
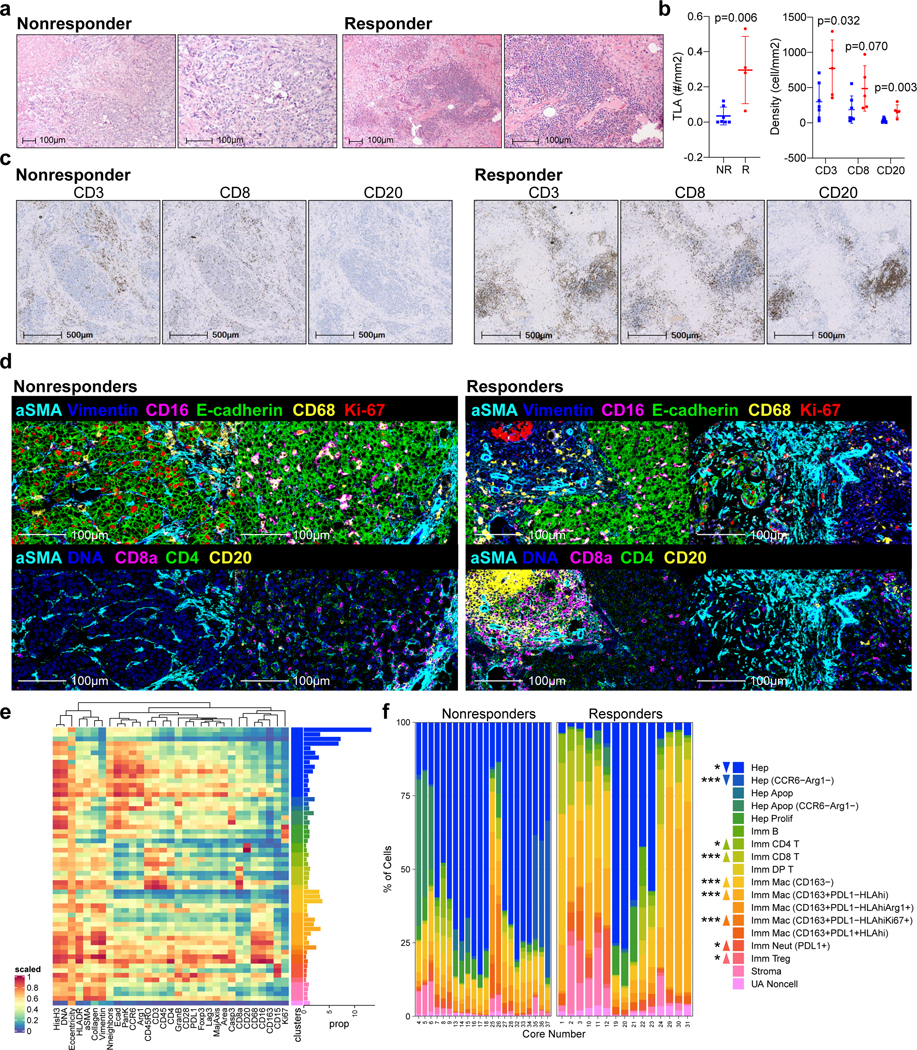
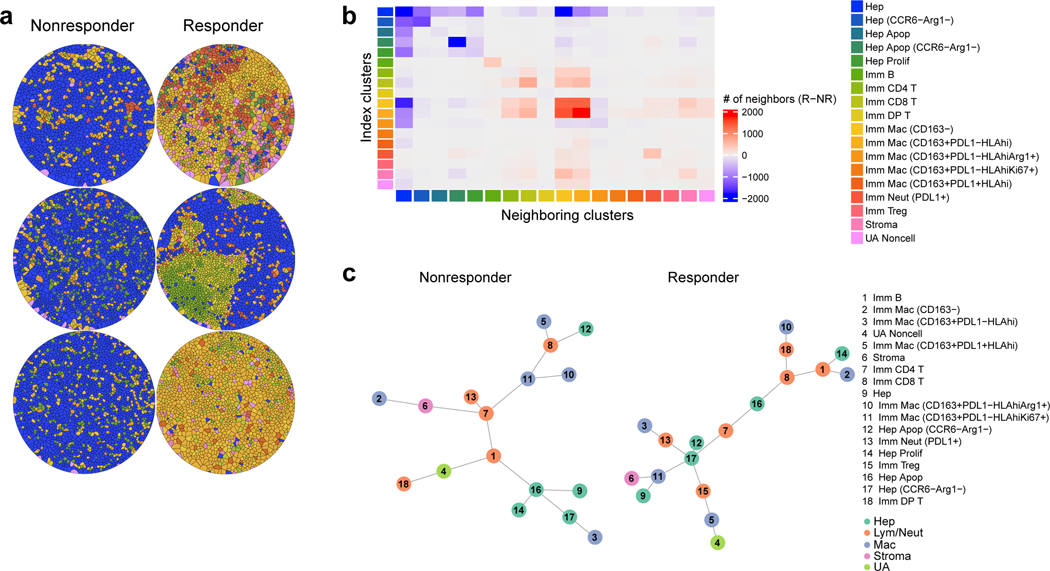
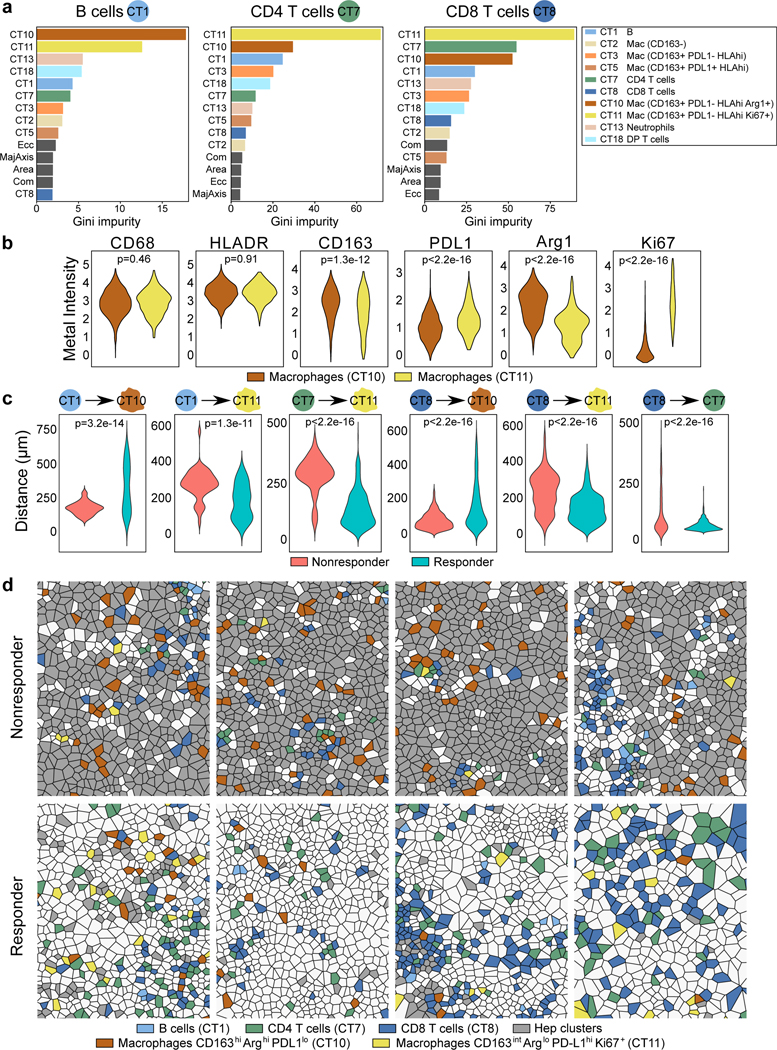
A potentially curative hepatic resection is the optimal treatment for hepatocellular carcinoma (HCC), but most patients are not candidates for resection and most resected HCCs eventually recur. Until recently, neoadjuvant systemic therapy for HCC has been limited by a lack of effective systemic agents. Here, in a single arm phase 1b study, we evaluated the feasibility of neoadjuvant cabozantinib and nivolumab in patients with HCC including patients outside of traditional resection criteria (NCT03299946). Of 15 patients enrolled, 12 (80%) underwent successful margin negative resection, and 5/12 (42%) patients had major pathologic responses. In-depth biospecimen profiling demonstrated an enrichment in T effector cells, as well as tertiary lymphoid structures, CD138+ plasma cells, and a distinct spatial arrangement of B cells in responders as compared to non-responders, indicating an orchestrated B-cell contribution to antitumor immunity in HCC.


Conflict of interest statement

Competing Interests The remaining authors declare no competing interests.

Figures

Extended Data Fig. 1
Extended Data Fig. 1. Cabozantinib induces changes in plasma correlates.
Concentrations (pg/ml) of VEGF-R2, VEGF-C, VEGF-A, c-MET, Angiopoietin-1, Angiopoietin-2, Tie-2, and AXL in longitudinally obtained plasma samples are shown as line graphs. AXL and c-MET are measured by ELISA assays. All other correlates were measured by Luminex multiplex assays. Data representative of two technical replicates. Each line represents an individual patient. Red and blue lines reflect pathologic non-responders and responders, respectively. Indicated are significant FDR-adjusted P values (<0.05, paired two-tailed t-tests).
Extended Data Fig. 2
Extended Data Fig. 2. T cell activation is observed in both Nanostring and CyTOF analysis.
T cell activation is observed in both Nanostring and CyTOF analysis. Pre- vs. post-cabozantinib changes in lymphoid cells, granzyme expression, and expression of IL2, IFNγ, PD1 in T cells are shown for two patients for whom the data was available. Y-axis represents a non-universal unit scale (expression levels for Nanostring and abundance levels or metal intensities for CyTOF) log2-transformed for ease of visualization. Abbreviation: N, naïve; NK, natural killer cells; ns, Nanostring; PB, peripheral blood; TIL, tumor infiltrating leukocytes.
Extended Data Fig. 3
Extended Data Fig. 3. Immunohistochemistry (IHC) analysis of immune cells.
Immunohistochemistry (IHC) analysis of immune cells. a, Each tissue section was manually annotated in image analysis software HALO™ into non-tumor and tumor regions (live, necrosis). b, Density of CD3, CD8, and CD20 in post-treatment surgical samples in the non-tumor regions by IHC (nonresponder, n=4 patients; responder, n=3 patients) (mean±s.d., all P>0.05, unpaired two-tailed t-test). c, Representative staining results of baseline core biopsies (PRE) and post-treatment surgical samples (POST) for CD3, CD8, and CD20 IHC (one patient selected from each group, representative of n=3 nonresponder, n=2 responder paired patient samples; quantitative data shown in panel b).
Extended Data Fig. 4
Extended Data Fig. 4. Workflow for imaging mass cytometry (IMC).
A tissue microarray of 37 cores was constructed from 12 total patients who underwent surgery after neoadjuvant cabozantinib and nivolumab. 5 patients were pathologic responders and 7 patients were nonresponders. This tissue microarray was then stained with a cocktail of metal-conjugated antibodies against 27 markers. Metal intensities from the stained slide are acquired by Hyperion™. The resulting images were evaluated using MCD Viewer™ and then segmented into single cell data using Ilastik and CellProfiler.
Extended Data Fig. 5
Extended Data Fig. 5. Representative IMC data.
a, Representative multicolored images for every core in the tissue microarray constructed from post-treatment surgical samples for aSMA, CD4, CD20, CD8a, and DNA, stratified by response in one set, and aSMA, Vimentin, CD16, E-Cadherin, CD68, and Ki-67, stratified by response in another. b, Abundances of major immune cell types assessed by IMC across the three representative cores from non-responder (NR) and responder (R) patient samples are shown.
Extended Data Fig. 6
Extended Data Fig. 6. Combination of cabozantinib and nivolumab promotes local T cell responses.
a, Six post-treatment surgical samples were enzymatically dissociated into single-cell tumor infiltrating leukocytes and were assayed by a 27-marker CyTOF panel dedicated to phenotyping T cells. FlowSOM algorithm was employed to generate 40 metaclusters which were annotated into 21 final clusters. Scaled expression profile for each of the clusters are shown in the heatmap and UMAP. b, Stacked bar plots show immune cell subtype distribution at the single cell level for non-responder (NR, n=79939 cells) and responder (R, n=25086 cells) samples. ***P<2.2e-16 (Chi-squared). c, Abundance of each subtype as a percentage of CD45 cells for each patient sample. Abbreviations: DNT, double-negative T; DPT, double-positive T; EFF, effector; EM, effector memory; EX, exhaustion marker positive; N, naïve; NK, natural killer; UA, unassigned. d, Comparison of CD8 T cell quantification by CyTOF, IMC, and IHC.
Extended Data Fig. 7
Extended Data Fig. 7. Combination of cabozantinib and nivolumab promotes systemic T cell responses.
a, PBMCs from eight paired pre- and post-treatment samples were assayed by a 27-marker CyTOF panel dedicated to phenotyping T cells. FlowSOM algorithm was employed to generate 30 metaclusters which were then annotated into 23 final clusters. Scaled expression profile for each of the clusters are shown in the heatmap. b, Radar plot showing average fold changes for the abundance of every T cell subtype. Color legends apply to both panels A and B. P-values (edgeR) are annotated. Abbreviations: CM, central memory, DNT, double-negative T; DPT, double-positive T; Eff, effector; EM, effector memory; EX, exhaustion marker positive; N, naïve; NK, natural killer; UA, unassigned.
Extended Data Fig. 8
Extended Data Fig. 8. Treatment alters levels of immunomodulatory chemokines in plasma.
Concentrations (pg/ml) of MIG (CXCL9), IP-10 (CXCL10), I-TAC (CXCL11), MCP-1 (CCL2), Eotaxin-3 (CCL26), Rantes (CCL5), MCP-2 (CCL8), and MIP-1a (CCL3) in longitudinally obtained plasma samples are shown as line graphs. All correlates were measured by Luminex multiplex assays. Data representative of two technical replicates. Each line represents an individual patient. Red and blue lines reflect pathologic non-responders and responders, respectively. All comparisons not statistically significant by FDR-adjusted P values (<0.05 considered significant, paired two-tailed t-tests).
Extended Data Fig. 9
Extended Data Fig. 9. B cells indirectly contribute to antitumor immune response.
a, Results from immunohistochemistry of CD138 in nonresponders (NR) and responders (R) for tumor regions (left; NR, n=7; R, n=5 patients) and non-tumor regions (right; NR, n=4; R, n=5). Data represented as mean±s.d.; P values based on unpaired two-tailed t-test. b, Representative dual CD20-IgA staining result of a responder patient (left) and a positive control tonsil tissue (right). Image selected from one of five responder patient. c, Violin plots of per-cell metal intensities for CCR7, TNFα, IL2, and IFNγ in NR vs. R samples measured by CyTOF (NR, n=2789 cells; R, n=1593 cells). Indicated are FDR-adjusted P values (linear modeling). d, Violin plot (left) of per-cell granzyme B (GZMB) metal intensity in NR (n=2789 cells) vs. R (n=1593 cells). FDR-adjusted P value (linear modeling). Representative multicolored image of IMC in a responder core exhibiting a tertiary lymphoid aggregate with a prominent focus of B cells along with CD3, HLADR, and granzyme B expression. Image selected from one of 15 responder cores.
Figure 1.
Figure 1.
Clinical responses to neoadjuvant cabozantinib and nivolumab. a, Study schema. b, Flowchart of outcomes. Of the 15 patients with borderline resectable or locally advanced HCC, 12 underwent a margin negative resection. c, The change from baseline in the target lesion diameter according to Response Evaluation Criteria in Solid Tumors (RECIST), version 1.1, for all evaluable patients (n=14 patients) following neoadjuvant therapy. *, major pathologic response; **, complete pathologic response; # resection not performed. d, Change in AFP tumor marker for all patients with an elevated AFP at baseline (n=7 patients). e, Disease free survival (DFS) for all patients (n=12 patients) undergoing resection, stratified by pathologic response. All responders had DFS >233 days, whereas 4/7 nonresponders developed early progression between 56 and 155 days. f, A 69 year-old male with a multinodular and infiltrative HCC with portal vein (PV) tumor thrombus, having progressed after prior TACE therapy. Pre-treatment MRI shows the tumor occluding middle hepatic vein (HV), left HV, left portal pedicle (PP), and abutting the cava, right HVs, and right PP. With neoadjuvant therapy, the tumor no longer abutted the right HV/PP, the PV was less distended, and the tumor thrombus was not enhancing. AFP declined from 106,732 to 806.9 (>99% reduction). The patient had a margin negative extended left hepatectomy and remains without recurrence with a normal AFP >1 year from resection. g, Multiplanar reconstruction of baseline and post-treatment imaging for a 75 year-old female with a multinodular and infiltrative HCC. At baseline, the tumor occluded middle and left HVs with abutment of cava, right HV confluence, and left and right PPs. After neoadjuvant therapy, the tumor no longer enhanced, was less involved at the cava and the right HV/PP, enabling a margin negative resection. The patient remains without disease recurrence at 2 years from resection. h, Multiplanar reconstruction of baseline and post-treatment imaging of a 71 year-old male with an infiltrative HCC with a satellite lesion and extensive PV tumor thrombus. With treatment, the AFP declined from >30,000 to 12.9 (>99% reduction) and demonstrated a partial response by RECIST 1.1. The patient remains without disease recurrence >2 years from resection.
Figure 2.
Figure 2.
Cabozantinib enhances systemic and local antitumor T cell responses. a, Serially obtained peripheral blood mononuclear cells (PBMCs) from six paired pre- and post-cabozantinib (cabo) samples were assayed by a 27-marker CyTOF panel dedicated to phenotyping T cells. FlowSOM algorithm as employed to generate 23 annotated final clusters. Scaled expression profile for each of the clusters identified from the entire dataset and hierarchically clustered are shown in the heatmap. b, UMAP representation of the annotated clusters. c, Radar plots showing post-cabo versus baseline fold changes for each patient. Inner solid boundary, 1-fold difference; outer solid boundary, 3-fold difference. Color legends are shared by panels A-C. Upward or downward arrows reflect direction of change due to cabo (***, P<0.005; **, P<0.01; *, P<0.05; FDR-adjusted, paired modeling by patient, edgeR). d, Volcano plots showing the results of nCounter® PanCancer Immune Profiling Panel for four paired pre- and post-cabo samples extracted from FFPE core biopsies. Red, unadjusted P-value <0.05 by linear modeling. Adjacent heatmap shows scaled levels of markers in each sample. Unadjusted p-values are annotated by color. Abbreviations: CM, central memory; Eff, effector; EM, effector memory; N, naïve; NK, natural killer; Tc, cytotoxic T; Th, helper T.
Figure 3.
Figure 3.
Response to cabozantinib and nivolumab is characterized by an immune-rich TME. a, Representative H&Es, one from 7 nonresponders and one from 5 responders, of dense immune-rich foci, i.e. tertiary lymphoid structures (TLA) in the surgically resected tumors post-cabozantinib and nivolumab. b, Quantification of TLAs along with CD3+ cells, CD8+ cells, and CD20+ cells per tumor area (mm) in non-responders (NR, n=7 patients) and responders (R, n=5 patients ) as detected by immunohistochemistry (IHC). (mean±s.d., unpaired two-tailed T-tests). c, Representative IHC staining for CD3, CD8, and CD20 (one patient selected from each group for representation; quantitative data shown in panel b). d, Representative multicolored images from IMC for non-responders and responders (two patients selected from each group for representation). e, Scaled heatmap of IMC parameters for a total of 59,453 single cells identified from 37 cores representing 12 surgically resected post-treatment samples. The dataset was clustered by FlowSOM into 60 metaclusters annotated into 18 final clusters. The proportion (prop) of each cluster out of the entire dataset is shown as horizontal bar graphs. f, Abundance of each annotated cell type cluster as a percentage of total cells within each core stratified into non-responder and responder groups. Cell type color legends apply to both panels E (horizontal bar graph) and F. Upward or downward arrows reflect the levels in responders relative to non-responders (***, P<0.005; *, P<0.05; FDR-adjusted, edgeR). Abbreviations: Apop, apoptotic; DP, double-positive; Hep, Hepatocellular carcinoma; Imm, immune subtype; Mac, macrophage; Neut, neutrophil; UA, unassigned.
Figure 4.
Figure 4.
Spatial relationships among the cell types are distinct with respect to response. a, Representative Voronoi tessellations of three cores for each response group (each core is from a unique patient; representative of n=6 patients). b, Heatmap displaying top neighboring cell types (columns) for each given index cell type (rows). The difference between responder and non-responder cells in their absolute number of top two neighboring cell types are indicated by color (red, more in responders; blue, more in non-responders). Cell type clusters are annotated by color along the rows and columns Color legends apply to panels A and C (data representative of n=12 patients total). c, Minimum spanning tree representations of spatial relationships among the cell types in the non-responder (n=37196 cells) and responder (n=22257 cells) groups based on minimum Euclidean distances from each cell to all other cell types. Abbreviations: Apop, apoptotic; DP, double-positive; Hep, Hepatocellular carcinoma; Imm, immune subtype; Lym, lymphocyte; Mac, macrophage; Neut, neutrophil; NR, non-responder; R, responder; Tc, cytotoxic T; Th, helper T; UA, unassigned.
Figure 5.
Figure 5.
Proximity between lymphoid and macrophage subtypes are key determinants of response to cabozantinib and nivolumab. a, Results from random forest algorithm evaluating minimum Euclidean distances among immune cell types shown as Gini impurity statistics. Distances to all other immune cell types from B cells (“CT1”, left box), CD4+ T cells (“CT7”, middle box), and CD8+ T cells (“CT8”, right box) are ranked by order of importance in response prediction. Data for panels a-c are representative of all evaluable n=12 patients.b, Metal intensities of functional markers for the two macrophage subtypes (indicated are FDR-adjusted P values, linear modeling) n=1452 CT10 vs. 359 CT11. c, Most important minimum Euclidean distances from each index cell type (B, CD4+ T, or CD8+ T; shown as the circle on the left) to other cell types are shown at the per-cell level as violin plots (indicated are FDR-adjusted P values, linear modeling). R vs. NR: n=73 vs. 103 B cells, n=349 vs. 172 CD4+ T cells, n=598 vs. 401 CD8+ T cells. d, Voronoi diagrams visualizing spatial relationships among B cells, CD4+ T cells, CD8+ T cells, and the two macrophage subtypes for non-responders and responders (represents four unique patient samples for each group). Hep clusters are depicted in grey. Abbreviations: Com, compactness; DP, double-positive; Ecc, eccentricity; Mac, macrophage; MajAxis, major axis diameter.

References

    1. Park J-W et al. Global patterns of hepatocellular carcinoma management from diagnosis to death: the BRIDGE Study. Liver Int. 35, 2155–2166 (2015). - PMC - PubMed
    1. Yang JD et al. A global view of hepatocellular carcinoma: trends, risk, prevention and management. Nature Reviews Gastroenterology and Hepatology vol. 16 589–604 (2019). - PMC - PubMed
    1. Siegel RL, Miller KD & Jemal A. Cancer statistics, 2020. CA. Cancer J. Clin 70, 7–30 (2020). - PubMed
    1. Tobe T. et al. Primary liver cancer in Japan. Clinicopathologic features and results of surgical treatment. Ann. Surg 211, 277–287 (1990). - PMC - PubMed
    1. Parker GA et al. Intraoperative ultrasound of the liver affects operative decision making. Ann. Surg 209, 569–577 (1989). - PMC - PubMed

Methods-only References

    1. Cesano A. nCounter® PanCancer Immune Profiling Panel (NanoString Technologies, Inc., Seattle, WA). J. Immunother. Cancer 3, (2015). - PMC - PubMed
    1. Weber LM, Nowicka M, Soneson C. & Robinson MD diffcyt: Differential discovery in high-dimensional cytometry via high-resolution clustering. Commun. Biol 2, (2019). - PMC - PubMed
    1. Mahnke YD, Brodie TM, Sallusto F, Roederer M. & Lugli E. The who’s who of T-cell differentiation: Human memory T-cell subsets. European Journal of Immunology vol. 43 2797–2809 (2013). - PubMed
    1. Hartmann FJ et al. Comprehensive Immune Monitoring of Clinical Trials to Advance Human Immunotherapy. Cell Rep. 28, 819–831.e4 (2019). - PMC - PubMed
    1. Becht E. et al. Dimensionality reduction for visualizing single-cell data using UMAP. Nat. Biotechnol 37, 38–47 (2019). - PubMed

Publication types

Associated data