Review
. 2022 Feb;9(4):e2103879.
doi: 10.1002/advs.202103879. Epub 2021 Nov 18.

Lithium-Sulfur Batteries Meet Electrospinning: Recent Advances and the Key Parameters for High Gravimetric and Volume Energy Density

Affiliations
Review

Lithium-Sulfur Batteries Meet Electrospinning: Recent Advances and the Key Parameters for High Gravimetric and Volume Energy Density

Yongshang Zhang et al. Adv Sci (Weinh). 2022 Feb.

Abstract

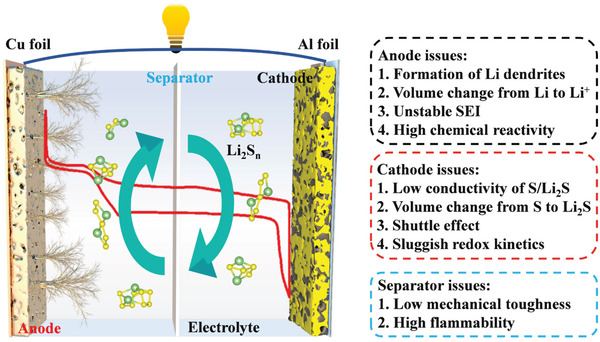
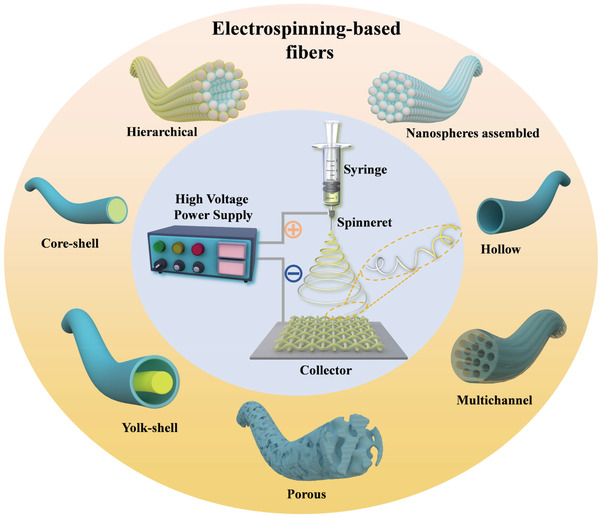
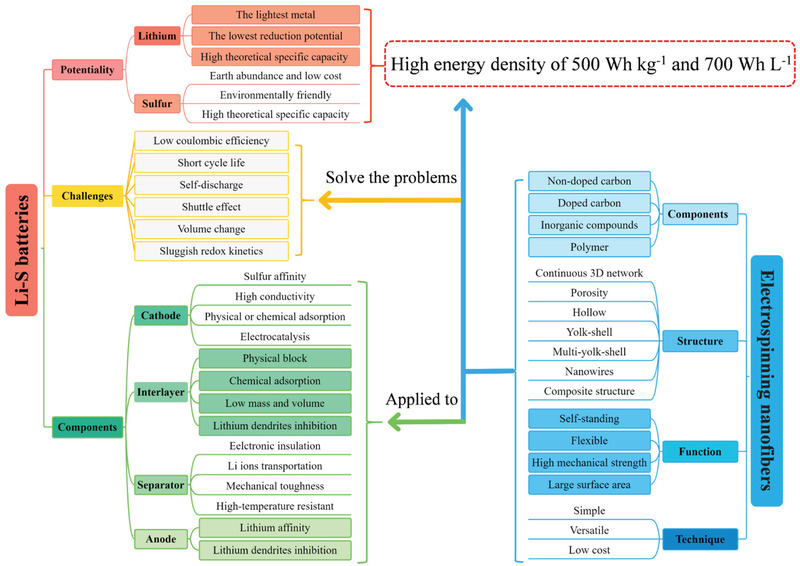
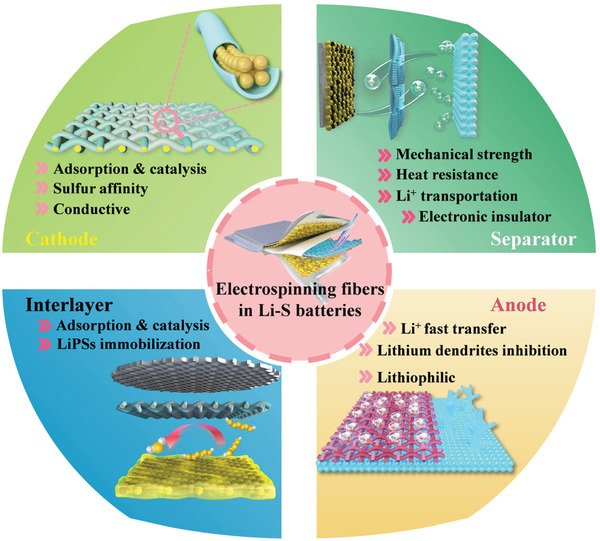
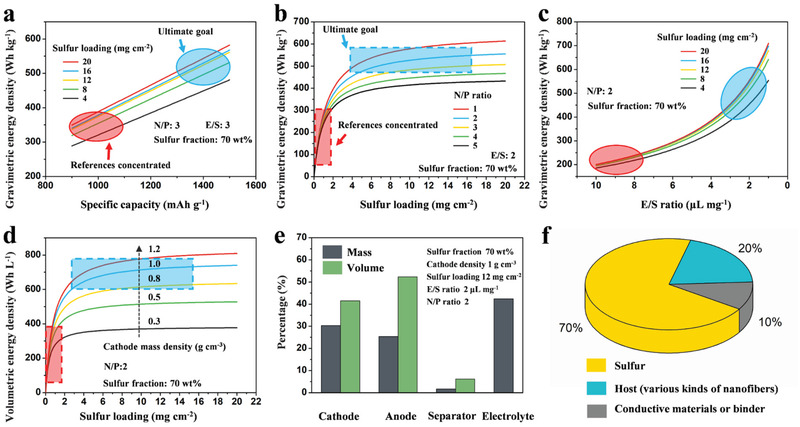
Lithium-sulfur (Li-S) batteries have been regarded as a promising next-generation energy storage technology for their ultrahigh theoretical energy density compared with those of the traditional lithium-ion batteries. However, the practical applications of Li-S batteries are still blocked by notorious problems such as the shuttle effect and the uncontrollable growth of lithium dendrites. Recently, the rapid development of electrospinning technology provides reliable methods in preparing flexible nanofibers materials and is widely applied to Li-S batteries serving as hosts, interlayers, and separators, which are considered as a promising strategy to achieve high energy density flexible Li-S batteries. In this review, a fundamental introduction of electrospinning technology and multifarious electrospinning-based nanofibers used in flexible Li-S batteries are presented. More importantly, crucial parameters of specific capacity, electrolyte/sulfur (E/S) ratio, sulfur loading, and cathode tap density are emphasized based on the proposed mathematic model, in which the electrospinning-based nanofibers are used as important components in Li-S batteries to achieve high gravimetric (WG ) and volume (WV ) energy density of 500 Wh kg-1 and 700 Wh L-1 , respectively. These systematic summaries not only provide the principles in nanofiber-based electrode design but also propose enlightening directions for the commercialized Li-S batteries with high WG and WV .

Keywords: Li-S batteries; electrospinning; energy density; key parameters; mathematic model.


Conflict of interest statement

The authors declare no conflict of interest.

Figures

Figure 1
Figure 1
a) Statistics of publications based on electrospinning technique from 1 January 2002 to 1 July 2021 by searching “electrospinning” as “topic” in the website of Web of Science. b) Statistics of publications of Li–S batteries from 1 January 2009 to 1 July 2021 by searching “Li–S batteries” as “topic” in the website of Web of Science.
Figure 2
Figure 2
A brief timeline and representative structure based on electrospinning technique for the improvement of electrochemical performance of Li–S batteries, containing sulfur cathode host, interlayer, separator, and lithium anode host. Inserted represented works containing: The revival of Li–S batteries starts from Nazar group's work of confining sulfur in CMK‐3 as a cathode. Reproduced with permission.[ 2a ] Copyright 2009, Springer Nature. Carbonizing electrospinning PAN/PMMA as sulfur host. Reproduced with permission.[ 23 ] Copyright 2011, Royal Society of Chemistry. Electrospinning PAN/PMMA membrane as gel polymer electrolyte. Reproduced with permission.[ 24 ] Copyright 2012, Elsevier. Carbonization PAN nanofibers serve as sulfur cathode hosts. Reproduced with permission.[ 25 ] Copyright 2013, American Chemical Society. Mesoporous and microporous CNFs derived from carbonization PAN/PMMA nanofibers. Reproduced with permission.[ 26 ] Copyright 2014, Elsevier. ACNF paper serves as a cathode interlayer. Reproduced with permission.[ 27 ] Copyright 2015, Elsevier. Ni nanoparticles serve as hard templates for a hierarchical structure carbon/sulfur cathode. Reproduced with permission.[ 28 ] Copyright 2015, Elsevier. Lotus root‐like multichannel CNFs as sulfur host. Reproduced with permission.[ 29 ] Copyright 2015, Springer Nature. Core–shell PI‐ZnO nanofibers serve as lithium anode hosts. Reproduced with permission.[ 30 ] Copyright 2016, Springer Nature. CoS2@SeS2 decorated multichannel CNFs serve as sulfur hosts.[ 31 ] Copyright 2017, Wiley‐VCH. Grape cluster shape of the micrograde hierarchically structured sulfur host. Reproduced with permission.[ 16d ] Copyright 2017, Elsevier. The cohesive force from the CNFs for the trapping of LiPS. Reproduced with permission.[ 32 ] Copyright 2018, American Chemical Society. The “tube on cube” nanohybrids CNFs for the sulfur cathode. Reproduced with permission.[ 33 ] Copyright 2018, Royal Society of Chemistry. Electrospinning PVA‐BA‐PTFE derived PCNFs. Reproduced with permission.[ 34 ] Copyright 2019, Springer Nature. The three‐in‐one S‐CNTs/CoNCNFs/PVDF membrane. Reproduced with permission.[ 35 ] Copyright 2019, Wiley‐VCH. All‐purpose porous flexible conductive networks serve as sulfur hosts and lithium hosts. Reproduced with permission.[ 36 ] Copyright 2020, Wiley‐VCH. The CNF‐supported TiO2–MXene heterojunctions for sulfur cathode host. Reproduced with permission.[ 37 ] Copyright 2020, Royal Society of Chemistry. Flexible TiN–Ti4O7 core–shell nanofiber membrane reactor. Reproduced with permission.[ 38 ] Copyright 2020, Wiley‐VCH. The VG/TiC electrocatalyst was prepared by electrospinning coupled with the CVD method. Reproduced with permission.[ 39 ] Copyright 2021, Wiley‐VCH. Lotus‐root‐like structure as lithium anode. Reproduced with permission.[ 40 ] Copyright 2021, Wiley‐VCH.
Figure 3
Figure 3
The schematic illustration of the Li–S batteries and the challenges of anode, cathode, and separator. The inside red line is the charge–discharge curve of Li–S batteries.
Figure 4
Figure 4
Schematic illustration of electrospinning technique and various electrospun nanofibers.
Figure 5
Figure 5
Schematic description of Li–S battery system and the electrospinning‐based nanofibers.
Figure 6
Figure 6
Schematic illustration of the electrospinning‐based nanofiber materials used in the four main parts of Li–S batteries.
Figure 7
Figure 7
Key parameters of dominating W G and W V of Li–S battery: a) Dependence of W G on specific capacity with different areal sulfur loading. b) Dependence of W G on N/P ratio with different areal sulfur loading. c) Dependence of W G on E/S ratio with different areal sulfur loading. d) Dependence of W V on areal sulfur loading and cathode density. e) Volume and mass fraction of each component in full Li–S batteries. f) Schematic of a sulfur cathode component concluding of sulfur, host (various kinds of nanofibers), and conductive agent or binder. The area circled in red is where most of the references are concentrated, which means that the W G and W V of Li–S batteries from most reported works are less than 350 Wh kg−1and 400 Wh L−1, respectively. The area circled in blue is the ultimate goal of most researches, which is to achieve a high energy density of 500 Wh kg−1and 700 Wh L−1 for Li–S batteries.
Figure 8
Figure 8
a) A general picture of using the chemical crosslinking electrospinning method to synthesize PCNFs. b–d) SEM images of the as‐spun fibers, the oxidized fibers, and the PCNFs, e) EDS mapping spectrum of PCNFs, f) The proposed chemical model of B–N–F doped PCNFs, g) A digital photo of the as‐spun film with a size of 70 cm × 55 cm. Reproduced with permission.[ 34 ] Copyright 2019, Springer Nature. h) Schematic illustration of the synthesis of porous CNF/S composites: CNF/Fe3C containing graphitic carbon layer after carbonization; porous CNF after etching Fe3C and chemical activation; porous CNF/S by infiltrating sulfur. i,j) TEM and HRTEM images of PCNF/A550. k) TEM images and corresponding EDS elemental maps of PCNF/A550/S fiber. Reproduced with permission.[ 66 ] Copyright 2017, Wiley‐VCH.
Figure 9
Figure 9
a) Schematic illustration of the templated electrospinning strategy for the fabrication of the yolk‐shell carbon fiber network, b,c) SEM images of the BCN@HCS fibers, d,e) TEM images of the BCN@HCS fibers, f) EDX spectrum, g) TGA curve, h,i) TEM images, and j) STEM image and corresponding elemental mapping. Reproduced with permission.[ 68 ] Copyright 2018, Elsevier. k) Schematic illustration of the production of freestanding flexible Li2S@NCNF paper electrodes via Ar‐protected carbothermal reduction of Li2SO4@PVP fabrics made by electrospinning at ambient conditions. l) FESEM image of Li2S@NCNF paper, m) TEM image of a Li2S@NCNF fiber, n) HRTEM image showing the decoration of single‐crystalline Li2S nanoparticles in carbon nanofibers with disordered structure, o) elemental mapping visualizing the uniform distribution of sulfur and carbon elements in Li2S@NCNF, p) TEM image and corresponding elemental mapping showing the uniform distribution of sulfur, nitrogen, and carbon elements in Li2S@NCNF electrode after 200 cycles. Reproduced with permission.[ 71 ] Copyright 2017, Wiley‐VCH.
Figure 10
Figure 10
a) Schematic illustration of the fabrication process for multi‐yolk/shell structured CFTG‐1 composite. SEM and TEM images of the obtained b) CF, c) CFT, d,f–i) CFTG‐1 and e) CFTG‐2 composite. j) Schematic illustration of the Li2S nucleation and growth on CFTG‐1composite surface (left) and on carbon surface (right). Schematic illustration of LiPS redox reaction and Li2S nucleation on the k) CF and l) CFTG‐1 substrates. SEM images of m) CF/S and n) CFTG‐1/S cathodes at the discharged states with a sulfur loading of 1.2 mg cm−2 at 0.1 C. Reproduced with permission.[ 74 ] Copyright 2020, Elsevier. o) Schematic illustration of the fabrication process for the S/TiO2/G/NPCFs composite. p) SEM and q, r) TEM images of TiO2/G/NPCFs (inset is the column diagram of the TiO2 particles' size distribution). s) TEM and SAED images of S/TiO2/G/NPCFs. t) Elemental mapping of S/TiO2/G/NPCFs. Reproduced with permission.[ 75 ] Copyright 2017, Elsevier.
Figure 11
Figure 11
a) Schematic diagram showing the process for the fabrication SG/S composites and SEM images for b) CNFs, c) VG on CNFs, and d) SG/S. e,f) TEM and g) HRTEM images of SG/S. h) XPS C 1s spectra of VG on CNFs and SG/S. i) EDX mapping of the SG/S composite after 155 °C for 12 h. j) EDX mapping of the mixture of VG on CNFs and sulfur after 155 °C for 12 h. Scale bars: 200 nm for i,j). Reproduced with permission.[ 76 ] Copyright 2020, Elsevier. k) Synthesis strategy for developing freestanding TiO/CNF nanofiber mats. l) A schematic explaining the Ti—S bond formation through coordination between unsaturated Ti‐centers (Lewis acid) and terminal S (ST) of S x 2− (polysulfides). Reproduced with permission.[ 77 ] Copyright 2018, American Chemical Society.
Figure 12
Figure 12
a) Schematic illustration of the CNF/S/PANi electrode configuration. b) STEM image of single CNF/S/PANi and corresponding elemental mappings of C, S, and N elements revealing the uniform distribution of S and PANi. Reproduced with permission.[ 79 ] Copyright 2018, Wiley‐VCH. c) Schematic illustration of the synthesis process of TiO2‐CNFs@void@TiN@C/S cathode. d) TEM and HRTEM images of TiO2‐CNFs@void@TiN@C. e) Schematic illustration of the coaxial multilayered hollow structure of TiO2–CNFs@void@TiN@C. f) TEM image, linear elemental distributions, and area elemental distributions for C, N, O, Ti and S, of TiO2‐CNFs@void@TiN@C/S. Reproduced with permission.[ 80 ] Copyright 2020, Elsevier.
Figure 13
Figure 13
a,b) SEM images of NiCo2O4 nanofibers. c) TEM image of NiCo2O4 nanofibers and the corresponding SAED pattern. d) HRTEM image of NiCo2O4 nanofibers. e) XRD patterns of NiCo2O4 nanofibers and S/NiCo2O4 composite. The diffraction peaks of NiCo2O4 are marked with pound signs in the pattern of S/NiCo2O4 composite. f) TG curve of the S/NiCo2O4 composite in Ar atmosphere. Reproduced with permission.[ 81 ] Copyright 2019, Wiley‐VCH. g) Schematic representation for high‐rate performance of MTDNTs/S composites cathode. h) STEM image of MTDNTs/S composite and elemental mapping of Ti and S. Reproduced with permission.[ 82 ] Copyright 2017, Elsevier.
Figure 14
Figure 14
a) Schematic illustration for the synthetic procedure of SPAN/CNT electrodes. The inset orange boxes are digital pictures of the flexible and freestanding electrodes. b) TEM images of a single SPAN/CNT‐12 fiber and c–e) the corresponding elemental mapping of S, C, and N. The inset white boxes are images with high magnifications. f–h) Cross‐sectional SEM images of a single SPAN/CNT‐12 nanofiber at different discharge‐charge states. Reproduced with permission.[ 83 ] Copyright 2019, Wiley‐VCH.
Figure 15
Figure 15
a) Schematic of the synthesis of the MnS/CNF and CNF interlayer. b) Schematic of different interlayers suppressing the diffusion of polysulfides. Reproduced with permission.[ 86 ] Copyright 2020 the Royal Society of Chemistry. c) Schematic illustration for the cell configurations and fabricated process of PAN‐NC@Cathode. Reproduced with permission.[ 87 ] Copyright 2017, American Chemical Society. d) Schematic of the Li–S battery configuration with a flexible interlayer. e,f) Cross‐sectional SEM images of the interlayer. g,h) TEM images of the interlayer. Reproduced with permission.[ 88 ] Copyright 2017, Wiley‐VCH.
Figure 16
Figure 16
a) Chemical structures of PAN (top) and APP (down). b) Schematics of the multifunctional electrospinning PAN@APP separator with thermal‐triggered flame‐retardant properties for Li–S batteries. c) Elemental mapping images of C, N, and P in the selected region of PAN@APP. d,e) SEM images and cross‐section images of the PAN@APP membrane. The inset picture shows the digital photo of the PAN@APP separator. f) Flame‐retardant properties of PP, PAN, and PAN@APP separators. Reproduced with permission.[ 57 ] Copyright 2018, Wiley‐VCH. g) Schematic diagram of the design flow for E‐PAN/PAA and the blocking mechanism against polysulfide. h,i) SEM images of PAN6/PAA4 and E‐PAN6/PAA4. j) Thermal shrinkage after exposure at 150 °C for 1 h of different membranes. Reproduced with permission.[ 94 ] Copyright 2019 the Royal Society of Chemistry. k) A schematic of preparation of APANF. Top‐view and cross‐sectional SEM images of Li plating on Cu foil with l) Celgard, m) PANF, and n) APANF separators after 50 cycles. The morphology of o) Celgard, p) PANF, q) APANF, after cycling. The insets are high‐resolution images. r) Voltage profiles of symmetrical cells with different separators. Reproduced with permission.[ 95 ] Copyright 2020, Elsevier.
Figure 17
Figure 17
a) Schematic illustration of the cell configuration based on the CuNWs‐GN/PI/LLZO separator. b) Cross‐section SEM image of the CuNWsGN/PI/LLZO separator. c) SEM image of the CuNWs‐GN surface on polyimide membrane. d) The electrolyte contacts angle of varied separators. e) The thermal stability of varied separators at 150 °C for 0.5 h. f) Schematic illustration of the chemical anchoring and catalytic functionality of the copper nanowires‐graphene coating layers toward soluble polysulfide species (top picture: macroscale changes at the electrode level and down: microscale change at the molecular level). Reproduced with permission.[ 96 ] Copyright 2020, Wiley‐VCH. Schematic illustrations of g) the working principle of the conventional Li–S battery system and integrated flexible Li–S battery system, h) the fabrication of the integrated three‐in‐one fibrous membrane. SEM image of i) S‐CNTs, j) CoNCNFs layer, and k) PVDF fibrous layer. l) Cross‐sectional SEM image and EDS mappings of the three‐in‐one S‐CNTs/CoNCNFs/PVDF membrane. Reproduced with permission.[ 35 ] Copyright 2019, Wiley‐VCH.
Figure 18
Figure 18
a) Schematic illustration for the preparation of PEO/LLTO solid electrolytes and S/CNF cathode. b) SEM image of PEO/LLTO solid electrolytes. Reproduced with permission.[ 98 ] Copyright 2019, Elsevier. c) Schematic of the flexible solid electrolyte membrane. d,e) Thermal properties and flammability of the solid FRPC electrolyte. f) Schematic illustrating for the solid electrolytes by infiltrating PI nanofibers with solution Li6PS5Cl0.5Br0.5. Reproduced with permission.[ 100 ] Copyright 20, American Chemical Society.
Figure 19
Figure 19
a) Schematic illustrations of the Li dendrite growth on a bare current collector and the uniform Li deposition on a current collector with a CNF interlayer. SEM images of the Li deposition on a bare Cu foil at current densities of b) 0.5 mA cm−2, c) 1 mA cm−2 and d) 2 mA cm−2, respectively. SEM images of the Li deposition on a Cu foil with a CNF interlayer at current densities of e) 0.5 mA cm−2, f) 1 mA cm−2 and g) 2 mA cm−2, respectively. Reproduced with permission.[ 107 ] Copyright 2017, Elsevier. h) A cartoon illustrating the fabrication process of Li–S/CNF. i) Charge density difference plots showing the adsorption of a Li adatom on the substrate of LiF (111) (left) and Li3Bi (111) (right) (top row); the diffusion pathways of Li adatoms on the corresponding surfaces (bottom row). The green, purple, and brown balls represent lithium, fluorine, and bismuth atoms, respectively. j) A cartoon showing the coating strategy to derive MFC‐Li/CNF. k) TEM image of the protective layer stripped from the MFC‐Li electrode. l,m) TEM/EDS analysis of the protective layer. n) Representative cycling voltage profiles at 1.0 mAh cm−2 at 5.0 mA cm−2 for the symmetric cell assembled with the MFC‐Li/CNF electrode, the inset shows the average cell voltage versus the cycle index. o) Voltage profiles at different current densities. Reproduced with permission.[ 108 ] Copyright 2019, Nature.
Figure 20
Figure 20
a) Schematic representation of the synthesis of PCNFs with or without oxygenated functional groups. b) Low and c) high‐magnification SEM images of PCNF‐1.5‐HNO3. d) TEM image and e) HRTEM image of PCNF‐1.5‐HNO3. HRTEM images of f) neat CNF and g) PCNF‐1.5‐HNO3 showing distinct degrees of graphitization. h) Deconvoluted C1s spectra of PCNFs prepared with different etching agents and neat CNFs. i) Ex situ SEM and TEM images of the neat CNF and PCNF electrodes at different stages of Li plating. Reproduced with permission.[ 109 ] Copyright 2018, Wiley‐VCH.
Figure 21
Figure 21
a) Schematic illustration of the fabrication procedure of NCH@CFs. b,c) FESEM and d) TEM images of NCH@CFs. e) Voltage profiles of the Li plating on different hosts. f) CE and the g) voltage profiles of the NCH@CF and Cu hosts. h–j) FESEM images of the NCH@CF host with a plating capacity of 6 mAh cm−2. Reproduced with permission.[ 40 ] Copyright 2021, Wiley‐VCH. k) Illustration of lithium deposition on the MCNFs. l) Optical images of the MCNFs. m) Cross‐section and top‐view SEM images of MCNFs. n) TEM image and o) EDS mapping of MCNFs. p,q) Top‐view and cross‐section SEM images of the MCNFs with plated lithium of 1–10 mAh cm−2. Reproduced with permission.[ 110 ] Copyright 2021, Royal Society of Chemistry.
Figure 22
Figure 22
a) Schematic diagram of synthetic procedures of CoNi@PNCFs electrode and an electronic watch powered by Li–S full cell. b,c) SEM images of CoNi@PNCFs. d,e) TEM images and elemental mapping images of CoNi@PNCFs. f–h) SEM images of Cu electrode after 50 cycles of Li plating/stripping, i–k) CoNi@PNCFs electrode after 50 cycles of Li plating/stripping. l) Long‐term cycling performance of Cu and CoNi@PNCFs electrodes at current densities of 5 mA cm−2 and capacity of 10 mAh cm−2, m) between 40 and 50 h, and n) CE of CoNi@PNCFs and Cu electrodes. Reproduced with permission.[ 36 ] Copyright 2020, Wiley‐VCH. o) Synthesis schematic for the S/TiN‐VN@CNFs cathode, the Li/TiN‐VN@CNFs anode, and the S/TiN‐VN@CNFs || Li/TiN‐VN@CNFs full battery configuration. p) SEM images, q) TEM image, r) High‐resolution TEM (HRTEM) images, and s) TEM elemental mapping images of the TiN‐VN@CNFs. t) SEM images of the Li/TiN‐VN@CNFs. SEM images of u) the Li/TiN‐VN@CNFs and v) the bare Li electrodes after 100 cycles at 1 mA cm−2 with a fixed capacity of 1 mAh cm−2. w) Cycling performance between bare Li and Li/TiN‐VN@CNFs symmetrical cells. Reproduced with permission.[ 2b ] Copyright 2020, Wiley‐VCH.

References

    1. a) Lu S., Cheng Y., Wu X., Liu J., Nano Lett. 2013, 13, 2485; - PubMed
    2. b) Li M., Lu J., Chen Z., Amine K., Adv. Mater. 2018, 30, 1800561. - PubMed
    1. a) Ji X., Lee K. T., Nazar L. F., Nat. Mater. 2009, 8, 500; - PubMed
    2. b) Yao Y., Wang H., Yang H., Zeng S., Xu R., Liu F., Shi P., Feng Y., Wang K., Yang W., Wu X., Luo W., Yu Y., Adv. Mater. 2020, 32, 1905658; - PubMed
    3. c) Wang Z., Liu J., Zhang B., Sun L., Cong L., Lu L., Mauger A., Julien C. M., Xie H., Sun H., Energy Storage Mater. 2020, 24, 373;
    4. d) Wang M., Fan L., Sun X., Guan B., Jiang B., Wu X., Tian D., Sun K., Qiu Y., Yin X., Zhang Y., Zhang N., ACS Energy Lett. 2020, 5, 3041;
    5. e) Wang J., Li G., Luo D., Zhang Y., Zhao Y., Zhou G., Shui L., Wang X., Chen Z., Adv. Energy Mater. 2020, 10, 2002076;
    6. f) Zhang S., Zhang Y., Shao G., Zhang P., Nano Res. 2021, 14, 3942.
    1. a) Miao F., Lu N., Zhang P., Zhang Z., Shao G., Adv. Func. Mater. 2019, 29, 1808994;
    2. b) de las Casas C., Li W., J. Power Sources 2012, 208, 74;
    3. c) Shi H., Ren X., Lu J., Dong C., Liu J., Yang Q., Chen J., Wu Z. S., Adv. Energy Mater. 2020, 10, 2002271;
    4. d) Bruce P. G., Freunberger S. A., Hardwick L. J., Tarascon J. M., Nat. Mater. 2012, 11, 19; - PubMed
    5. e) Zhang P., Li Y., Zhang Y., Hou R., Zhang X., Xue C., Wang S., Zhu B., Li N., Shao G., Small Methods 2020, 4, 2000214.
    1. a) Su Y. S., Manthiram A., Nat. Commun. 2012, 3, 1166; - PubMed
    2. b) Al Salem H., Babu G., Rao C. V., Arava L. M. R., J. Am. Chem. Soc. 2015, 137, 11542; - PubMed
    3. c) Li Z., Zhang J., Lou X. W., Angew. Chem., Int. Ed. 2015, 54, 12886. - PubMed
    4. d) Li Y., Zhang P., Wan D., Xue C., Zhao J., Shao G., Appl. Surf. Sci. 2020, 504, 144361.
    5. e) Zhang P., Li Z., Zhang S., Shao G., Energy Environ. Mater. 2018, 1, 5.
    6. f) Zhao T., Ye Y., Peng X., Divitini G., Kim H.‐K., Lao C.‐Y., Coxon P. R., Xi K., Liu Y., Ducati C., Chen R., Kumar R. V., Adv. Funct. Mater. 2016, 26, 8418.
    1. a) He Y., Chang Z., Wu S., Zhou H., J. Mater. Chem. A 2018, 6, 6155;
    2. b) Yuan L., Qiu X., Chen L., Zhu W., J. Power Sources 2009, 189, 127;
    3. c) Wang M., Xia X., Zhong Y., Wu J., Xu R., Yao Z., Wang D., Tang W., Wang X., Tu J., Chem. ‐ Eur. J. 2019, 25, 3710. - PubMed

LinkOut - more resources