

Contrast-enhanced ultrasound-based ultrasomics score: a potential biomarker for predicting early recurrence of hepatocellular carcinoma after resection or ablation
- PMID: 34797687
- PMCID: PMC8822579
- DOI: 10.1259/bjr.20210748
Contrast-enhanced ultrasound-based ultrasomics score: a potential biomarker for predicting early recurrence of hepatocellular carcinoma after resection or ablation
Abstract
Objectives: This study aimed to construct a prediction model based on contrast-enhanced ultrasound (CEUS) ultrasomics features and investigate its efficacy in predicting early recurrence (ER) of primary hepatocellular carcinoma (HCC) after resection or ablation.
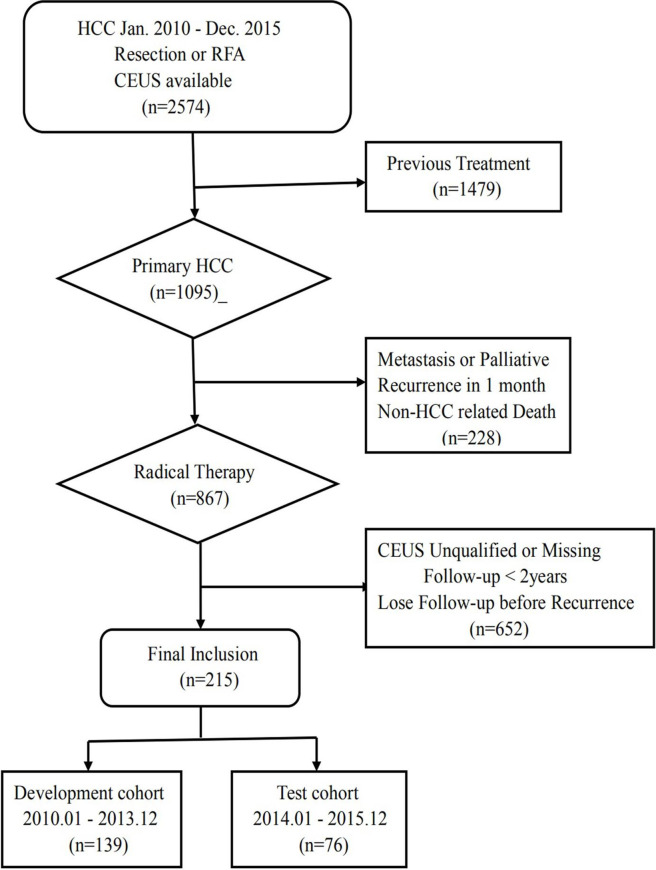
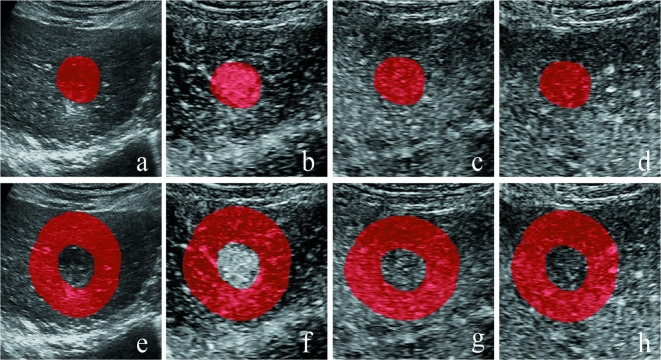
Methods: This study retrospectively included 215 patients with primary HCC, who were divided into a developmental cohort (n = 139) and a test cohort (n = 76). Four representative images-grayscale ultrasound, arterial phase, portal venous phase and delayed phase-were extracted from each CEUS video. Ultrasomics features were extracted from tumoral and peritumoral area inside the region of interest. Logistic regression was used to establish models, including a tumoral model, a peritumoral model and a combined model with additional clinical risk factors. The performance of the three models in predicting recurrence within 2 years was verified.
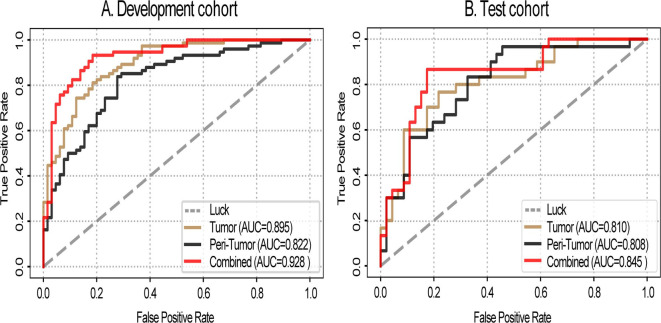
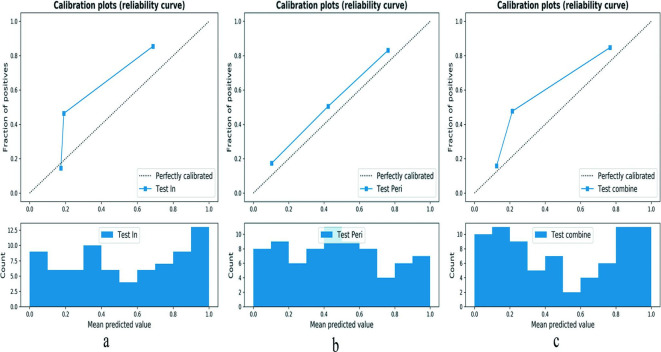
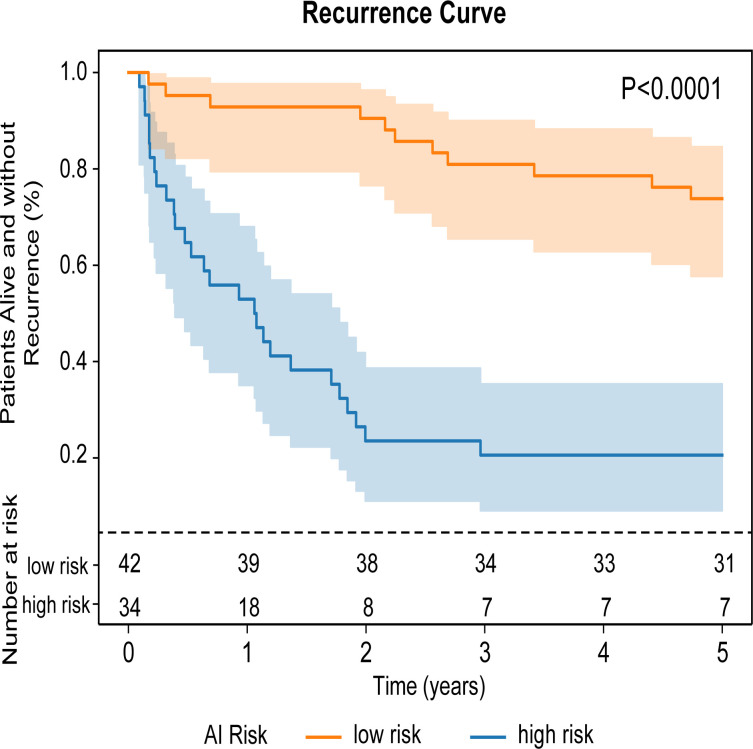
Results: The combined model performed best in predicting recurrence within 2 years, with an area under the curve (AUC) of 0.845, while the tumoral model had an AUC of 0.810 and the peritumoral model one of 0.808. For prediction of recurrence-free survival, the 2-year cumulative recurrence rate was significant higher in the high-risk group (76.5%) than in the low-risk group (9.5%; p < 0.0001).
Conclusion: These CEUS ultrasomics models, especially the combined model, had good efficacy in predicting early recurrence of HCC. The combined model has potential for individual survival assessment for HCC patients undergoing resection or ablation.
Advances in knowledge: CEUS ultrasomics had high sensitivity, specificity and PPV in diagnosing early recurrence of HCC, and high efficacy in predicting early recurrence of HCC (AUC > 0.8). The combined model performed better than the tumoral ultrasomics model and peritumoral ultrasomics model in predicting recurrence within 2 years. Recurrence was more likely to occur in the high-risk group than in the low-risk group, with 2-year cumulative recurrence rates, respectively, 76.5% and 9.5% (p < 0.0001).
Figures
Similar articles
-
Predictive Value of Conventional Ultrasound and Contrast-Enhanced Ultrasound in Early Recurrence of Hepatocellular Carcinoma after Surgical Resection.Ultrasound Med Biol. 2016 May;42(5):1042-8. doi: 10.1016/j.ultrasmedbio.2015.12.010. Epub 2016 Jan 21. Ultrasound Med Biol. 2016. PMID: 26803390
-
Dynamic Contrast-Enhanced Ultrasound Radiomics for Hepatocellular Carcinoma Recurrence Prediction After Thermal Ablation.Mol Imaging Biol. 2021 Aug;23(4):572-585. doi: 10.1007/s11307-021-01578-0. Epub 2021 Jan 22. Mol Imaging Biol. 2021. PMID: 33483803
-
CEUS in prediction of early recurrence of hepatocellular carcinoma after curative resection and to stratify the risk of early recurrence: a retrospective observational study.Abdom Radiol (NY). 2024 Jun;49(6):1870-1880. doi: 10.1007/s00261-024-04252-5. Epub 2024 Apr 1. Abdom Radiol (NY). 2024. PMID: 38557770
-
Preoperative Pathological Grading of Hepatocellular Carcinoma Using Ultrasomics of Contrast-Enhanced Ultrasound.Acad Radiol. 2021 Aug;28(8):1094-1101. doi: 10.1016/j.acra.2020.05.033. Epub 2020 Jul 2. Acad Radiol. 2021. PMID: 32622746
-
Contrast-enhanced US in Local Ablative Therapy and Secondary Surveillance for Hepatocellular Carcinoma.Radiographics. 2019 Sep-Oct;39(5):1302-1322. doi: 10.1148/rg.2019180205. Epub 2019 Jul 26. Radiographics. 2019. PMID: 31348734 Review.
Cited by
-
Artificial intelligence-aided ultrasound imaging in hepatopancreatobiliary surgery: where are we now?Surg Endosc. 2024 Sep;38(9):4869-4879. doi: 10.1007/s00464-024-11130-0. Epub 2024 Aug 19. Surg Endosc. 2024. PMID: 39160306 Free PMC article. Review.
-
Efficacy of Lipid Nanoparticle-Loaded Sorafenib Combined with Hepatic Artery Chemoembolization in the Treatment of Primary Hepatocellular Carcinoma Complicated with Microvascular Invasion.Dis Markers. 2022 May 20;2022:4996471. doi: 10.1155/2022/4996471. eCollection 2022. Dis Markers. 2022. PMID: 35634437 Free PMC article.
-
Circular RNA 0016142 Knockdown Induces Ferroptosis in Hepatocellular Carcinoma Cells via Modulation of the MicroRNA-188-3p/Glutathione Peroxidase 4 Axis.Biochem Genet. 2024 Feb;62(1):333-351. doi: 10.1007/s10528-023-10417-6. Epub 2023 Jun 21. Biochem Genet. 2024. PMID: 37344692
-
Complications Risk Assessment and Imaging Findings of Thermal Ablation Treatment in Liver Cancers: What the Radiologist Should Expect.J Clin Med. 2022 May 13;11(10):2766. doi: 10.3390/jcm11102766. J Clin Med. 2022. PMID: 35628893 Free PMC article. Review.
References
MeSH terms
Substances
LinkOut - more resources
Full Text Sources
Medical
