. 2021 Nov 19;7(47):eabg1530.
doi: 10.1126/sciadv.abg1530. Epub 2021 Nov 19.

Sniffing the human body volatile hexadecanal blocks aggression in men but triggers aggression in women

Affiliations

Sniffing the human body volatile hexadecanal blocks aggression in men but triggers aggression in women

Eva Mishor et al. Sci Adv. .

Abstract

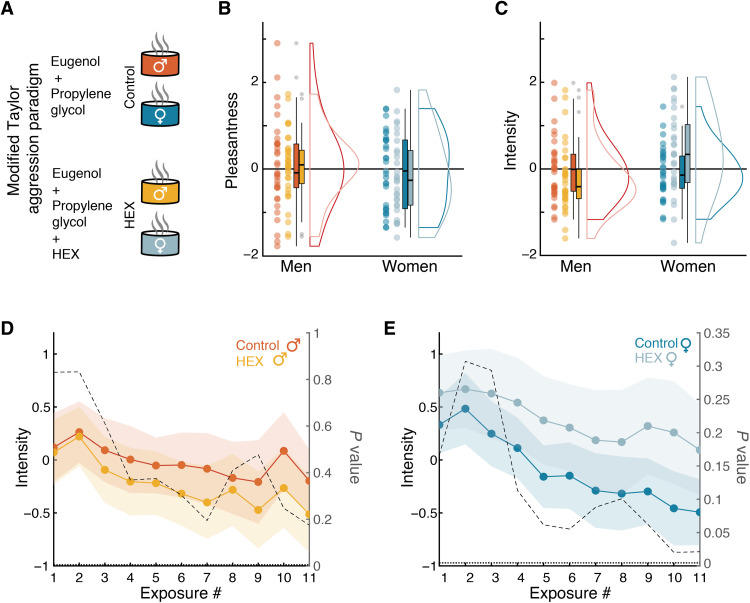
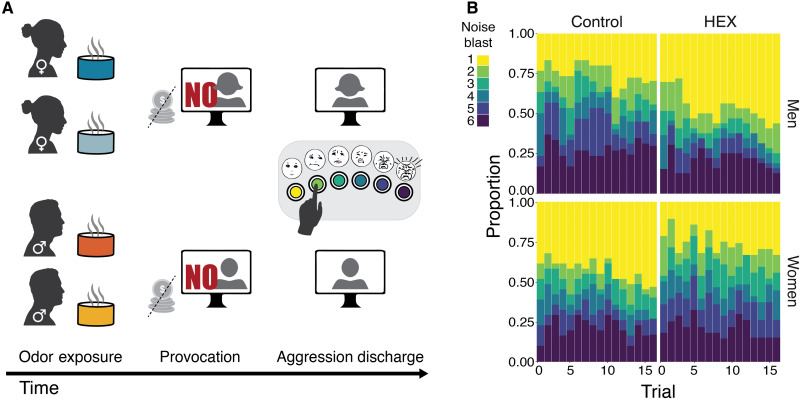
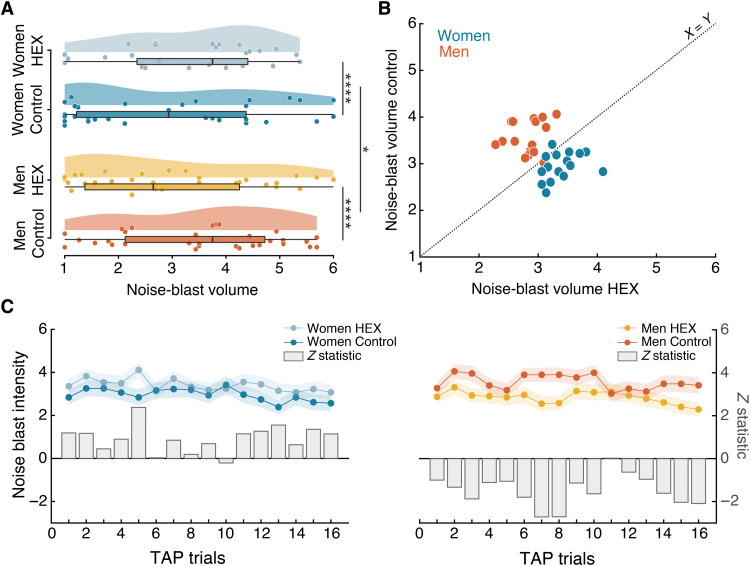
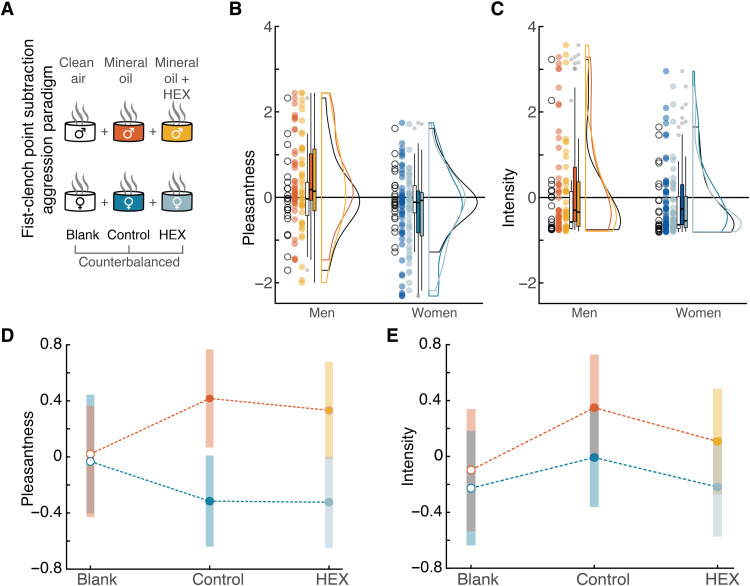
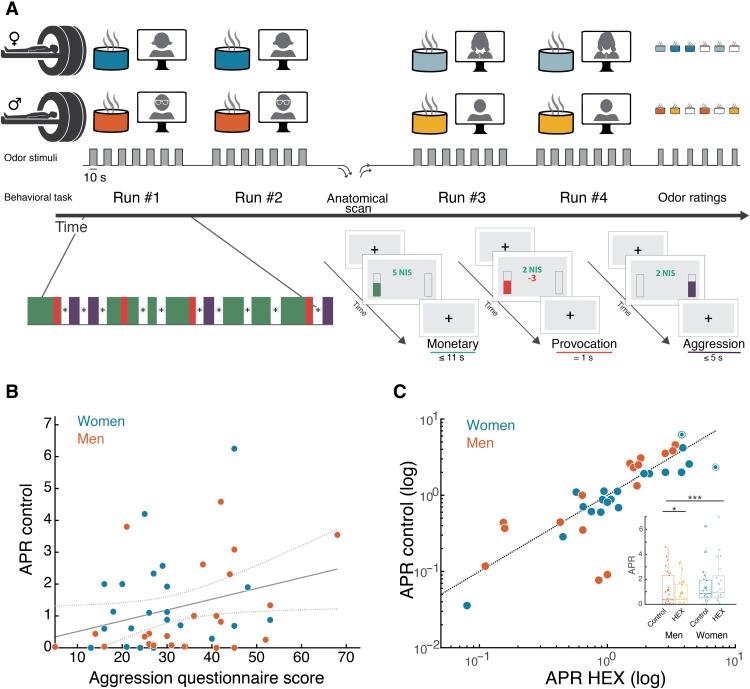
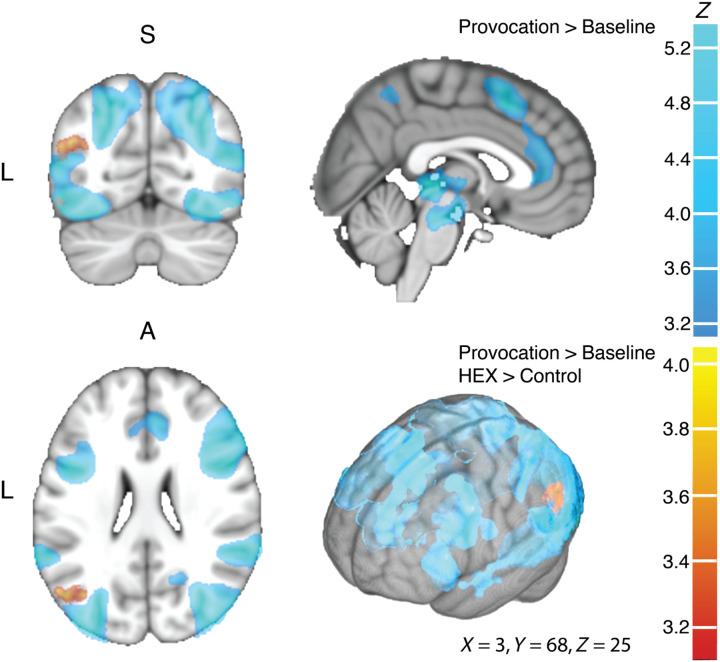
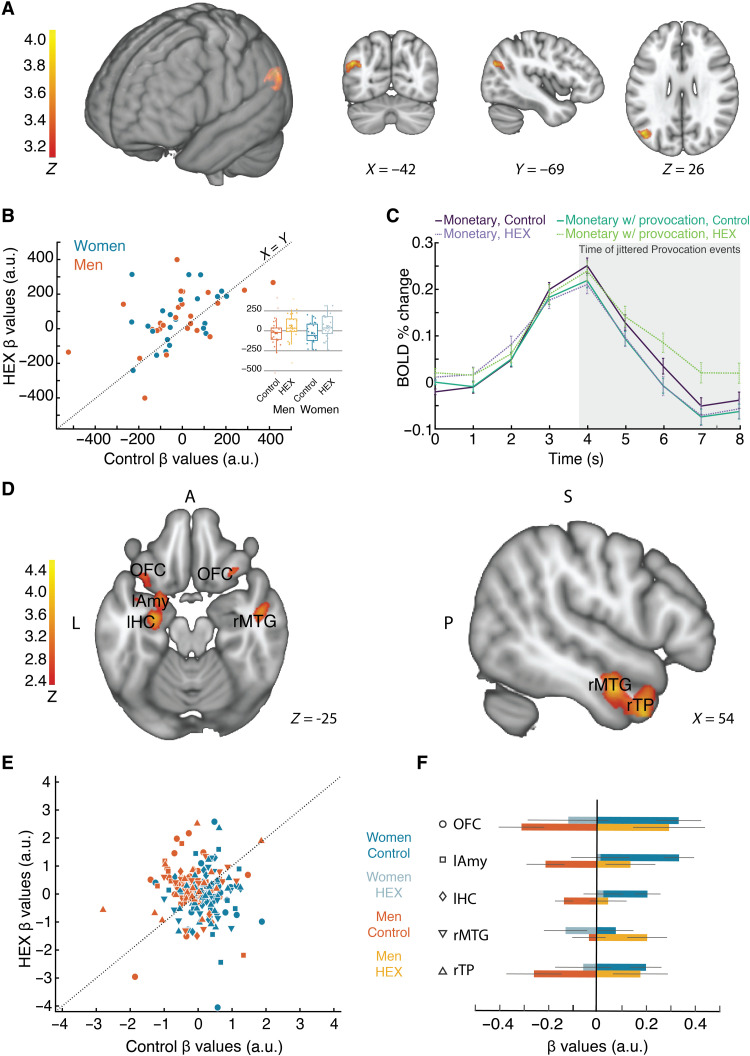
In terrestrial mammals, body volatiles can effectively trigger or block conspecific aggression. Here, we tested whether hexadecanal (HEX), a human body volatile implicated as a mammalian-wide social chemosignal, affects human aggression. Using validated behavioral paradigms, we observed a marked dissociation: Sniffing HEX blocked aggression in men but triggered aggression in women. Next, using functional brain imaging, we uncovered a pattern of brain activity mirroring behavior: In both men and women, HEX increased activity in the left angular gyrus, an area implicated in perception of social cues. HEX then modulated functional connectivity between the angular gyrus and a brain network implicated in social appraisal (temporal pole) and aggressive execution (amygdala and orbitofrontal cortex) in a sex-dependent manner consistent with behavior: increasing connectivity in men but decreasing connectivity in women. These findings implicate sex-specific social chemosignaling at the mechanistic heart of human aggressive behavior.


Figures

Fig. 1.
Fig. 1.. HEX did not significantly shift stimulus perception.
(A) The between-subjects TAP included four groups exposed to either control [100 μl, 10% eugenol in propylene glycol (PG)] or HEX (100 μl, 0.083 M HEX in 10% eugenol in PG). Control n = 34 men and 31 women, HEX n = 33 men and 29 women. Blue and orange refer to the sex of the recipient: blue for women and orange for men. The light and dark shades refer to the odor condition, HEX, and Control, respectively. (B) TAP odorant pleasantness ratings along the VAS. Each dot is a participant, the thick horizontal line is the median, the rectangle reflects the interquartile range (IQR) (25th to the 75th percentiles), and the whiskers are no more than 1.5 * IQR of the upper and lower hinges. Outlying points are plotted individually. (C) TAP odorant Intensity ratings along the VAS. Elements as in (B). (D) Mean Intensity and confidence interval of 95% for 11 consecutive exposures to HEX and Control in men. The dotted line is the point-by-point P value for the HEX-Control two-sample, two-tailed t test. The horizontal dotted line represents the significance threshold P value, corrected for multiple comparisons (Bonferroni correction), set to 0.0045. (E) Same as in (D) in women.
Fig. 2.
Fig. 2.. Path to provoking and gauging human aggressive behavior.
(A) In a between-subjects design, participants were exposed to an odorant (HEX or control) and then played a game where their online partner was unfair toward them in monetary distribution (provocation) and then another game where they could blast that same (nonexistent) person with noise blasts (aggression discharge). (B) Complete distribution of noise blasts applied in the study by men (n = 67) and women (n = 60) under HEX or control (yellow = mild, purple = harsh). The colors of the buttons on the response box were added here for illustration clarity.
Fig. 3.
Fig. 3.. Exposure to HEX modulated aggressive behavior in a sex-dependent manner across participants.
(A) Group-mean noise-blast volume. Men: n = 67 (34 Control). Women: n = 60 (31 Control). Each dot is the mean of a participant, the thick vertical line is the median, the rectangle reflects the IQR (25th to the 75th percentiles), and the whiskers are no more than 1.5 * IQR of the upper and lower hinges. (B) Trial-wise mean noise-blast volume. Each dot is the mean of a trial (1 to 16) of all men (orange) or women (blue) participants. The y axis reflects the trial mean during Control, and the x axis reflects the trial mean during HEX. The dotted line is the unit slope line (X = Y) such that data under the line reflect increased aggression in HEX and data above the line reflect decreased aggression in HEX. (C) Trial-by-trial depiction across participants. The dots reflect mean ratings, the shaded area reflects the SE, and the gray bars reflect a trial-by-trial Z statistic; both plots share the y axis. All tests were two-tailed, and all error bars represent SEM. *P < 0.05, ****P < 0.0005.
Fig. 4.
Fig. 4.. HEX did not shift stimulus perception.
(A) The within-subjects FC-PSAP included two groups: men (n = 25) and women (n = 24). Both were exposed to Blank (clean air), Control (mineral oil), and HEX (0.083 M HEX dissolved in mineral oil). Blue and orange refer to the sex of the recipient: blue for women and orange for men. The light and dark shades refer to the odor condition, HEX and Control, respectively. White color refers to the additional Blank air that participants were exposed to during the experiment. (B) FC-PSAP odorant pleasantness ratings along the VAS. Each dot is a participant, the thick horizontal line is the median, the rectangle reflects the IQR (25th to the 75th percentiles), and the whiskers are no more than 1.5 * IQR of the upper and lower hinges. Outlying points are plotted individually. (C) FC-PSAP odorant intensity ratings along the VAS. Elements as in (B). (D) FC-PSAP odorant pleasantness ratings mean and confidence interval of 95%. (E) FC-PSAP odorant intensity ratings mean and confidence interval of 95%.
Fig. 5.
Fig. 5.. Exposure to HEX modulated aggressive behavior in a sex-dependent manner within participants.
(A) In a within-subjects design, participants were exposed to an odorant (HEX and Control, counterbalanced for order), while they played a game where their online partner stole their money occasionally (provocation). During the game, they could aggress against that same (nonexistent) person by deducting money from them (Aggression). Each run duration was 8 min, and the anatomical scan duration was 5 min. (B) Pearson’s correlation between basal levels of aggression as measured here [aggression/provocation ratio (APR) in the control condition] and a standard AGQ, r = 0.30, P = 0.04. (C) Scatterplot of the APR under HEX and the APR in the control condition. Each dot is a participant, women (blue) and men (orange). The scatterplot is summarized in a box plot graph. Dotted circles represent outliers (>mean ± 3 SDs). In the box plot, empty circles represent values larger than 1.5 * IQR, thick horizontal lines represent the median, the X is the group mean, the rectangle reflects the IQR (25th to the 75th percentiles), and the whiskers are no more than 1.5 * IQR of the upper and lower hinges. All tests were two-tailed, all centers reflect mean, and all error bars reflect SEM. *P < 0.05, ***P < 0.005.
Fig. 6.
Fig. 6.. Provocation recruited an extensive brain network.
The group image for both women and men (n = 49), in coronal (top left), sagittal (top right), axial (bottom left), and surface (bottom right) views. In all panels, shades of blue reflect the Provocation > Baseline contrast, and shades of orange reflect the Provocation > Baseline with an additional HEX > Control contrast. In blue, provocation induced activity in the fusiform gyrus, OFC, insula, superior temporal gyrus, anterior cingulate cortex, inferior frontal gyrus, pre-SMA, precuneus, ventral tegmental area, periaqueductal gray area, and thalamus (for full list, coordinates, and peak activation, see table S2). In orange, HEX induced activation in left angular gyrus (AG). Z statistic images were thresholded using clusters determined by Z > 3.1 and a (corrected) cluster significance threshold of P = 0.05 (as described in Materials and Methods).
Fig. 7.
Fig. 7.. HEX drives sex-specific functional connectivity in the brain substrates of aggression.
(A) Contrast ANOVA statistical parametric map depicting activity greater during provocation versus baseline in HEX versus Control (P < 0.001, corrected). (B) β values extracted from the left AG. Each dot is a woman (blue) or man (orange) participant. The y axis reflects participant’s mean β during HEX, and the x axis reflects participant’s mean β during Control (all during a Provocation). The dotted line is the unit slope line (x = y) such that data under the line reflect increased activation in Control and data above the line reflect increased activation in HEX. (C) Percent signal change in blood oxygen level–dependent (BOLD) activity in the left AG ROI, depicted by condition. (D) Contrast statistical parametric map depicting functional connectivity with the left AG greater during provocation versus baseline in HEX versus Control in Men > Women (P < 0.01, corrected). OFC, orbitofrontal cortex; lAmy, left amygdala; lHC, left hippocampus; rMTG, right medial temporal gyrus; rTP, right temporal pole. (E) β values for functional connectivity with the angular gyrus. Each dot is a woman (blue) or man (orange) participant; shape of dot is as depicted in (F). (F) Bar graph of the β values of functional connectivity of Provocation > Baseline, HEX > Control, and Women > Men for whole-brain connectivity analysis with the AG as a seed region.

References

    1. Mykytowycz R., Goodrich B. S., Skin glands as organs of communication in mammals. J. Invest. Dermatol. 62, 124–131 (1974). - PubMed
    1. Novotny M., Harvey S., Jemiolo B., Alberts J., Synthetic pheromones that promote inter-male aggression in mice. Proc. Natl. Acad. Sci. U.S.A. 82, 2059–2061 (1985). - PMC - PubMed
    1. Chamero P., Marton T. F., Logan D. W., Flanagan K., Cruz J. R., Saghatelian A., Cravatt B. F., Stowers L., Identification of protein pheromones that promote aggressive behaviour. Nature 450, 899–902 (2007). - PubMed
    1. McGlone J. J., Curtis S. E., Banks E. M., Evidence for aggression-modulating pheromones in prepuberal pigs. Behav. Neural Biol. 47, 27–39 (1987). - PubMed
    1. Ferrero D. M., Moeller L. M., Osakada T., Horio N., Li Q., Roy D. S., Cichy A., Spehr M., Touhara K., Liberles S. D., A juvenile mouse pheromone inhibits sexual behaviour through the vomeronasal system. Nature 502, 368–371 (2013). - PMC - PubMed