. 2021 Nov 19;7(47):eabk1151.
doi: 10.1126/sciadv.abk1151. Epub 2021 Nov 19.

Epigenetically mismatched parental centromeres trigger genome elimination in hybrids

Affiliations

Epigenetically mismatched parental centromeres trigger genome elimination in hybrids

Mohan P A Marimuthu et al. Sci Adv. .

Abstract

Wide crosses result in postzygotic elimination of one parental chromosome set, but the mechanisms that result in such differential fate are poorly understood. Here, we show that alterations of centromeric histone H3 (CENH3) lead to its selective removal from centromeres of mature Arabidopsis eggs and early zygotes, while wild-type CENH3 persists. In the hybrid zygotes and embryos, CENH3 and essential centromere proteins load preferentially on the CENH3-rich centromeres of the wild-type parent, while CENH3-depleted centromeres fail to reconstitute new CENH3-chromatin and the kinetochore and are frequently lost. Genome elimination is opposed by E3 ubiquitin ligase VIM1. We propose a model based on cooperative binding of CENH3 to chromatin to explain the differential CENH3 loading rates. Thus, parental CENH3 polymorphisms result in epigenetically distinct centromeres that instantiate a strong mating barrier and produce haploids.


Figures

Fig. 1.
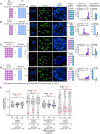
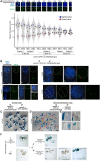
Fig. 1.. Biased localization of GFP-ts in zygotes, early embryos, and endosperm from GE crosses in Arabidopsis.
(A) Structure of wild-type AtCENH3, GFP-ts (gray box), and other haploid-inducing CENH3 variants. All CENH3 variants are expressed under the control of the Arabidopsis CENH3 regulatory sequences and, in the cenh3-1 null mutant background, act as HIs. GFP-ts is highlighted in bold because of its extensive use in this study: It results in the highest haploid induction rate, and it labels the centromeres efficiently. (B) CENH3-mediated GE in Arabidopsis. (C) Progressive stages of fertilization and early seed development. Landmark events described in this study are highlighted in green. (D) The GFP-ts is expressed maternally in both the control cross (CC) and the GE cross (GEC). However, in the GEC, the maternal line is homozygous for the cenh3-1 mutation. (E to I) The ovule schematic on the left indicates the region of interest in the ovule shown on the right. (E) GFP-ts is absent from the egg nucleus before fertilization and (F) in the early zygote. (G) GFP-ts reappears before mitosis on the centromeres of normally segregating chromosomes in both CC and GEC. In GEC, GFP-ts is absent on five chromosomes “*,” which lag and (H) form micronuclei in two-cell embryos (arrows). (I) Metaphase (CC) and anaphase (GEC) endosperm chromosomes displaying male-only (red) and biparental (blue) chromatin. Note the paternal bias in loading of GFP-ts in GEC. Scale bars, 1 μm.
Fig. 2.
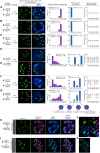
Fig. 2.. Interploidy GECs confirm depletion of GFP-ts from HI parent chromosomes.
Tetraploid (A and B) and diploid (C and D) Arabidopsis wild-type strains were crossed as males with diploid (A and B) or tetraploid (C and D) females expressing GFP-ts in CENH3+/+ (A) cenh3-1−/− (B and D) CENH3+/− (C) backgrounds. A selected nucleus (white dotted box) on the embryo is shown enlarged on the right (A to D). Arrowheads mark the faint GFP-ts signals. (E) Relative fluorescence intensity of centromeric GFP-ts signals. Fainter signals from the GECs are highlighted in red circles. Each column represents normalized intensity in arbitrary units (AU) within a single cell (C1 to C3) for each cross. Scale bars, 5 μm (for the embryo images) and 1 μm (for the individual nucleus images). DAPI, 4′,6-diamidino-2-phenylindole.
Fig. 3.
Fig. 3.. Uniparental loading of GFP-ts on centromeres of two– to four–cell stage embryos during GE.
(A to C) GFP-ts forms 10 strong centromeric signals in early embryonic nuclei in a set of CCs, while only five strong signals are visible in GECs (D to G). In some cases, up to six weak signals (arrowheads) are also visible (E to G), indicating suboptimal loading onto one parental centromere set. “n,” number of nuclei or embryos scored. The green channel is enhanced to reveal the fainter signals (E to G). For the displayed images (A to G), corresponding patterns of GFP-ts signals are marked on the green channel for each genotype. Bar graphs and violin plots display the number and pattern of GFP-ts signals per cell, respectively, and relative fluorescence intensity in AU for the corresponding genotypes is shown on the left. Each column of the violin plots displays relative GFP-ts intensity within a single cell (C1 to C6) with fainter GFP-ts signals highlighted in red circles. (H and I) Whole embryos are shown on the left side, and the highlighted nuclei with the yellow dotted line are shown on the right. (H) Prometaphase cells of the CC displaying 10 pairs of signals. In comparison, the top cell from the GEC (I) displayed five pairs of bright signals along with faint signals (J) (enhanced to display faint GFP-ts signals) on multiple chromosomes. Arrows mark maternal chromosomes; arrowheads indicate faint GFP-ts signals; asterisk (*) indicates bright signals. (K) Inferred WT karyotype and location of GFP-ts signals of the marqueed nucleus in (I). The single nuclei data shown in (A) to (I) were obtained from whole-embryo images shown in fig. S3 (C to J). Note that the embryos shown in (H) and (I) are enlarged for clarity in fig. S3 (J and K, respectively). #Data from (2, 39). Scale bars, 1 μm (for single nucleus) and 5 μm (for whole-embryo images).
Fig. 4.
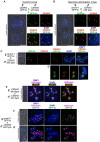
Fig. 4.. WT CENH3 and GFP-ts occupy the same functional centromeres during haploid induction.
(A to G) A selected nucleus (white dotted box) on the embryo is shown enlarged on the right. (A) Colocalization of CENH3 and GFP-ts on 10 centromeres in the CC. (B) Colocalization on five centromeres in the GEC. (C) 3D-SIM image of prometaphase stage cells in embryos from the GEC. (D) Enlarged condensed chromosome from image (C) (yellow dotted box). (E) At the pericentromeric region of all chromosomes, H3S10ph (phosphorylation of H3 at serine-10) is noticeable as an independent domain in prometaphase stage nuclei in the WT embryo and in prometaphase (F) and anaphase (G) in the embryo from the GEC. Asterisk (*) marks wild-type centromeres, whereas the arrowheads mark the chromosomes lacking GFP-ts. Yellow triangles (G) mark laggard chromosomes with H3S10ph signals, but lacking GFP-ts. Scale bars, 5 μm (for the whole-embryo images) and 1 μm (for the rest of the figure).
Fig. 5.
Fig. 5.. Uniparental assembly of functional kinetochores in embryos undergoing GE.
(A and B) Localization of RFP-tagged CENP-C and NUF2 in an interphase nucleus from petals. (C and D) Localization of paternal RFP-tagged CENP-C (C) and NUF2 (D) on all 10 parental kinetochores in the interphase nuclei of two– to four–cell stage embryos from a CC using WT females. (E to H) Comparison of GFP-ts, CENP-C, and NUF2 colocalization in interphase nuclei from two– to four–cell stage embryos in the CC (E and G) and GEC (F and H). White arrowheads and asterisks (*) in (F) and (H) mark faint signals and singleton GFP or RFP signals, respectively. Bar graphs, violin plots, and correlation plots represent the kinetochore numbers and relative fluorescent intensity values (AU) for the genotypes shown on the left. Each column of the violin plots indicates relative RFP intensity within a single cell (C1 to C6). Scale bars, 1 μm.
Fig. 6.
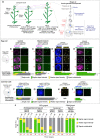
Fig. 6.. Stability of endogenous CENH3 and CENP-C.
(A) Experimental setup to study the temporal dynamics of kinetochore proteins during Arabidopsis female gamete development. (B to I) The left drawing indicates the region of interest in the ovule shown on the right. (B to E) Images from a single inflorescence of the respective genotypes from −1 to +2 stage ovules. Quantification of signal type in egg cells or central cells obtained from individual inflorescences is provided below each image (B to G and I). Temporal dynamics of GFP-ts in egg cell nuclei of control (B) and HI (C). (D) CENH3 signals (yellow, by immunostaining) and (E) GFP–CENP-C signals in WT egg nuclei. GFP-ts signals in differentiated central cell nuclei of control (F) and HI (G). (H) CENH3 signals (yellow, by immunostaining) and (I) GFP–CENP-C signals in WT, presumptive central cell nucleus. (J) GFP-ts and CENH3 signal quantification in egg and central cells of controls and HI lines. Pooled data for each genotype were collected from at least three independent inflorescences. N/A, not available. Scale bars, 1 μm.
Fig. 7.
Fig. 7.. Gametic transmission of a CENH3 null allele mimics the HI CENH3 variants by altering seed death and GE efficiency.
(A) Hypothetical dilution of centromeric CENH3 during gametogenesis following segregation of WT and null allele in meiosis. (B) Patterns and respective counts of kinetochore signal intensity in embryos generated by crossing CENH3(+/−) parents with males expressing the kinetochore marker. White arrowheads indicate fainter kinetochore signals. Violin plots display kinetochore signal intensity from the images on the right. Red circles represent fainter signals. Bottom, counts for embryos analyzed in (B). (C) Heatmap of seed abortion (a proxy for GE frequency) when intercrossing non-inducer and HI lines. #Data from the work of Maheshwari et al. (7). GFP-ts was not used as male because of reduced fertility. (D) Normal, 10-chromosome loading of GFP-ts or GFP-CENH3 crosses between GFP-ts and GFP-CENH3 with other HI lines (interphase or prometaphase stage nuclei). (E) Comparison of proportion of viable and aborted seeds upon pollinating various HI lines with CENH3(+/+) versus CENH3(+/−) males. (F) Bar graph displays GE induction efficiency when pollinating cenh3-1;GFP-ts with CENH3(+/−) males. (G) Embryos from cenh3-1;GFP-ts X CENH3(+/−) with two patterns of GFP-ts signal. Counts are displayed in the bar graph at the bottom. Scale bars, 1 μm. Statistical validation was by the Chi square test.
Fig. 8.
Fig. 8.. Centromeric resilience and stochastic nature of chromosome elimination in GEC.
(A) Resiliency of HI centromeres demonstrated by progressive coalescence of bright and faint GFP-ts fluorescence intensity clusters. Note the decrease in the maximum-minimum difference between HI centromeres and WT centromeres in different embryos from 2 to 6 DAP of the GEC (white arrowhead, weaker signals; white arrow, micronuclei). (B) The GFP-ts protein is encoded by the HI genome and can be used to document GE. In the GEC [(B), a to h], early embryos display chimeric distribution of GFP-ts signals, indicating GE in cells lacking any signal or displaying fainter signals (highlighted with dotted white line). Compare this to an embryo that avoided GE and displays GFP-ts signals in all nuclei [(B), i]. Red arrow: A GFP-ts–positive cell at the base of embryo proper in an otherwise GFP-ts–negative embryo, suggestive of missegregation of HI chromosomes during early stages of embryo development. (C to F) GUS histochemical staining analysis. GUS signal is seen uniformly in 2-week-old control embryos (C). Note that these embryos are from the cenh3-1;GFP-ts X cenh3-1;GFP-CENH3 cross, which does not result in GE (see Fig. 7C). (D) GUS staining chimerism (yellow arrowheads) indicates incomplete GE during embryo development. Smaller embryos (red triangles on a subset) likely result from severe aneuploidy or defective endosperm. (E) Chimeric embryos at higher magnification. (F) Whole-seedling GUS staining revealing the chimeric nature of GE. Seedlings with trichomes constitute either the hybrid diploid or aneuploid progeny, while those without trichomes are predominantly haploid. n, number of seedlings. Scale bars, 1 μm (A), 5 μm (B), 500 μm (C and D), and 50 μm (E).
Fig. 9.
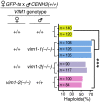
Fig. 9.. Null mutants of VIM1 enhance haploid induction frequency.
Bar graph showing the effect on haploid induction of null alleles of VIM1 transmitted from either parent. “n” indicates the number of progeny scored. P of Chi square test < 0.001
Fig. 10.
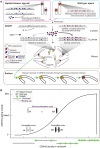
Fig. 10.. Model for CENH3-mediated haploid induction in Arabidopsis.
(A) Altered CENH3 is removed selectively from chromatin at the mature egg stage. WT CENH3 is not. In the cell divisions following hybridization, CENH3-depleted “weak” centromeres must compete for CENH3 loading with WT centromeres. Because of cooperative binding, WT centromeres are favored and load CENH3 preferentially. In the ensuing mitosis, the HI chromosomes missegregate because of their weak centromeres. The recessive action of altered CENH3 is explained by the persistence of WT CENH3. The action of VIM1 favors CENH3 loading by an unknown mechanism. We further hypothesize that selective removal results from a genomic surveillance mechanism that eliminates defective or misplaced CENH3 molecules. (B) Cooperative binding of CENH3 to centromeres according to Hill-Langmuir kinetics. Plot of CENH3 loading velocity on chromatin as a function of CENH3 density in chromatin. Binding sites represent the possible normal location of CENH3 nucleosomes in a regular, CENH3-rich centromere, which are interspersed between regular nucleosomes (54, 74). Velocity = 0 when all sites are either empty or occupied. According to the model, at the onset of GE, parental centromeres differ in density of CENH3 (compare gray and black wedges to chromatin reference drawings at the bottom) and are loaded differentially (plotted response graph). When both parents contribute similarly depleted centromeres (gray wedges), loading is initially slower but proceeds at the same rate on both parental centromeres, ensuring balanced loading and a compatible outcome in the cross.

Similar articles

Cited by

References

    1. Ishii T., Karimi-Ashtiyani R., Houben A., Haploidization via chromosome elimination: Means and mechanisms. Annu. Rev. Plant Biol. 67, 421–438 (2016). - PubMed
    1. Ravi M., Chan S. W. L., Haploid plants produced by centromere-mediated genome elimination. Nature 464, 615–618 (2010). - PubMed
    1. Wang N., Gent J. I., Kelly Dawe R., Haploid induction by a maize cenh3 null mutant. Sci. Adv. 7, eabe2299 (2021). - PMC - PubMed
    1. Lv J., Yu K., Wei J., Gui H., Liu C., Liang D., Wang Y., Zhou H., Carlin R., Rich R., Lu T., Que Q., Wang W. C., Zhang X., Kelliher T., Generation of paternal haploids in wheat by genome editing of the centromeric histone CENH3. Nat. Biotechnol. 38, 1397–1401 (2020). - PubMed
    1. Fukagawa T., Earnshaw W. C., The centromere: Chromatin foundation for the kinetochore machinery. Dev. Cell 30, 496–508 (2014). - PMC - PubMed