. 2021 Nov 19;17(11):e1009606.
doi: 10.1371/journal.pcbi.1009606. eCollection 2021 Nov.

Control of tissue homeostasis, tumorigenesis, and degeneration by coupled bidirectional bistable switches

Affiliations

Control of tissue homeostasis, tumorigenesis, and degeneration by coupled bidirectional bistable switches

Diego Barra Avila et al. PLoS Comput Biol. .

Abstract

The Hippo-YAP/TAZ signaling pathway plays a critical role in tissue homeostasis, tumorigenesis, and degeneration disorders. The regulation of YAP/TAZ levels is controlled by a complex regulatory network, where several feedback loops have been identified. However, it remains elusive how these feedback loops contain the YAP/TAZ levels and maintain the system in a healthy physiological state or trap the system in pathological conditions. Here, a mathematical model was developed to represent the YAP/TAZ regulatory network. Through theoretical analyses, three distinct states that designate the one physiological and two pathological outcomes were found. The transition from the physiological state to the two pathological states is mechanistically controlled by coupled bidirectional bistable switches, which are robust to parametric variation and stochastic fluctuations at the molecular level. This work provides a mechanistic understanding of the regulation and dysregulation of YAP/TAZ levels in tissue state transitions.


Conflict of interest statement

The authors have declared that no competing interests exist.

Figures

Fig 1
Fig 1. Schematic depiction of the regulatory network of YAP/TAZ.
LATS1/2 promotes the phosphorylation of YAP/TAZ [–6], leading cytoplasmic accumulation and subsequent degradation of YAP/TAZ while YAP/TAZ promotes the transcription of LATS2 [7]. YAP/TAZ promotes the Notch signaling pathway by inducing transcription of JAG1, DLL1, and RBPJ [8, 9], while Notch signaling pathway promotes YAP/TAZ expression through RBPJ-binding to YAP1 promoter [8, 9]. SIRT1 promotes YAP through Pol II-dependent transcription [12], while YAP/TAZ promotes SIRT1 transcription by upregulating MYC [13, 14].
Fig 2
Fig 2. Bifurcation and nullcline analysis displays three states.
(A) The bifurcation diagram shows the steady state of active/unphosphorylated YAP/TAZ as a function of basal expression of unphosphorylated YAP/TAZ (kYTup0). The labeled points SN1, SN2, SN3, and SN4 indicate saddle-node bifurcation points. The black dashed lines represent the unstable steady states while the solid colored lines represent the steady states. The lower blue branch, middle green branch, and upper red branch are defined as the degenerative state, homeostatic state, and tumorigenic state, respectively. The green shaded region shows the monostable range within the homeostatic state, the blue shaded region shows monostable range within the degenerative state, and the red shaded region shows the monostable range within the tumorigenic state. The cyan shaded region shows a bistable region with degenerative and homeostatic states, while the yellow shaded region shows the bistable region with the homeostatic and tumorigenic states. (B) Nullcline analysis of the regulatory system shows the two stable steady states and one unstable steady state when kYTup0 is within the first bistable region (between SN1 and SN2). Example trajectories starting from different initial conditions were shown to represent the dynamics of the system towards the tissue homeostatic and degenerative states. (C) Nullcline analysis of the regulatory system shows the two stable steady states and one unstable steady state when kYTup0 is within the second bistable region (between SN3 and SN4). Example trajectories (black solid lines) starting from different initial conditions were shown to represent the dynamics of the system towards the tissue homeostatic and tumorigenic states.
Fig 3
Fig 3. Tissue homeostasis is regulated by YAP/TAZ/LATS negative feedback loop.
(A) Nullcline analysis of the regulatory system shows one stable steady state (tissue homeostasis, green circle) at the intersections of the nullclines under basal parameter set. The [L]-nullcline is drawn in blue and the [YTup]-nullcline is drawn in red. The vector field of the system is represented by small arrows, where the color is proportional to the field strength. Example trajectories starting from different initial states were shown to represent the dynamics of the system towards the tissue homeostatic state. (B) The time course of the [YTup] level with the system starting from a range of initial conditions. (C) The parameter kYTup3, characterizing the strength of the YAP/TAZ-LATS1/2 negative feedback loop, was varied from 85% to 115% (left to right), with 5% increments, of its original value to plot the 1-parameter bifurcation diagrams and show its effect on the homeostatic state. (D) Two-parameter bifurcation analysis shows how the thresholds SN1, SN2, SN3, and SN4 vary with kYTup3. The monostable homeostatic state region is labeled as Mono-H (green), and the tristable region is labeled as Tri (purple), respectively. The bistable region in which the homeostatic and tumorigenic states existed within is labeled as Bi-HT (red), while the bistable region in which the homeostatic and degenerative states existed within is labeled as Bi-HD (blue). (E) Nullcline analysis of the regulatory system shows the three stable steady states and two unstable steady states when kYTup0 is within the tristable region (between SN2 and SN4) and kYTup3 is 85% of its original value.
Fig 4
Fig 4. The coupled bidirectional bistable switches are robust to parameter variation.
(A-B) Parameter sensitivity analysis was performed for the transition thresholds SN2 and SN3 (A) and SN1 and SN4 (B) by individually increasing and decreasing each parameter by 15% and plotting the fold change. Par- and Par+ represent the increase or decrease of parameters, respectively. Par0 represents the set of standard parameter. The diamond shaped-marker shows the thresholds under the standard parameter set. (C) The circular bar plots show the percent changes in the thresholds when each of the parameters is increased or decreased by 15%. The red outline on the bars denotes an increase of 15% in the parameters, while the blue outline denotes a decrease of 15% in the parameters. The solid black circle represents a 0% change. The dotted black circles going outward and inward represent an increase and decrease of 25% change, respectively. (D-E) Two-parameter bifurcation analyses show the dependence of normalized thresholds for activation of tissue degeneration and tumorigenesis on the strength of (D) the YAP/TAZ-SIRT1 feedback loop (kS2), and (E) YAP/TAZ-NOTCH feedback loop (kN2). Par: Parameter.
Fig 5
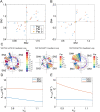
Fig 5. Effect of intrinsic and extrinsic noise on tissue state transitions.
(A) The steady 2-D distribution of N, S, and YTup from 1000 samples of stochastic simulations by increasing or decreasing kYTup0 value from the standard value kYTup0 = 0.007 that corresponds to the homeostatic state. (B) The steady 1-D distributions of YTup from 1000 samples of stochastic simulations with only intrinsic noises (left), or both extrinsic and intrinsic noises (right).

Similar articles

Cited by

References

    1. Yu FX, Meng Z, Plouffe SW, Guan KL. Hippo pathway regulation of gastrointestinal tissues. Annual review of physiology. 2015;77:201–227. doi: 10.1146/annurev-physiol-021014-071733 - DOI - PubMed
    1. Boopathy GT, Hong W. Role of hippo pathway-YAP/TAZ signaling in angiogenesis. Frontiers in cell and developmental biology. 2019;7:49. doi: 10.3389/fcell.2019.00049 - DOI - PMC - PubMed
    1. Moya IM, Halder G. Hippo–YAP/TAZ signalling in organ regeneration and regenerative medicine. Nature reviews Molecular cell biology. 2019;20(4):211–226. doi: 10.1038/s41580-018-0086-y - DOI - PubMed
    1. Park JH, Shin JE, Park HW. The role of hippo pathway in cancer stem cell biology. Molecules and cells. 2018;41(2):83. doi: 10.14348/molcells.2018.2242 - DOI - PMC - PubMed
    1. Wang SP, Wang LH. Disease implication of hyper-Hippo signalling. Open biology. 2016;6(10):160119. doi: 10.1098/rsob.160119 - DOI - PMC - PubMed

Publication types