. 2021 Nov 1;62(14):20.
doi: 10.1167/iovs.62.14.20.

An Analysis of Metabolic Changes in the Retina and Retinal Pigment Epithelium of Aging Mice

Affiliations

An Analysis of Metabolic Changes in the Retina and Retinal Pigment Epithelium of Aging Mice

Kristine A Tsantilas et al. Invest Ophthalmol Vis Sci. .

Abstract

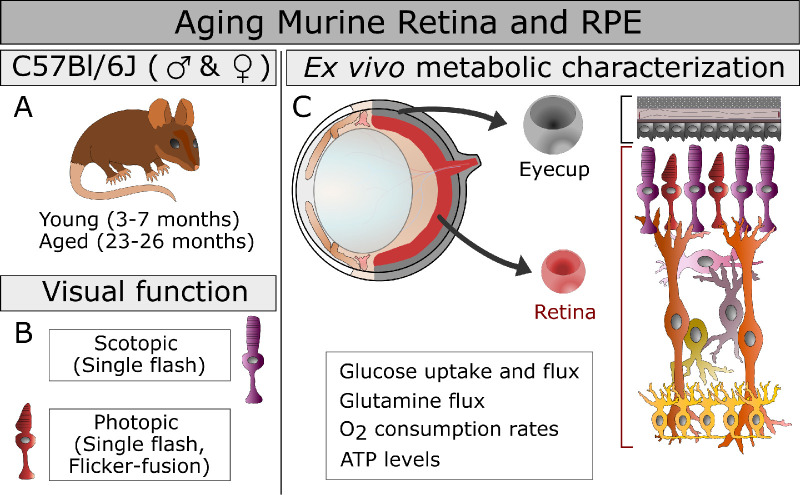
Purpose: The purpose of this study was to present our hypothesis that aging alters metabolic function in ocular tissues. We tested the hypothesis by measuring metabolism in aged murine tissues alongside retinal responses to light.

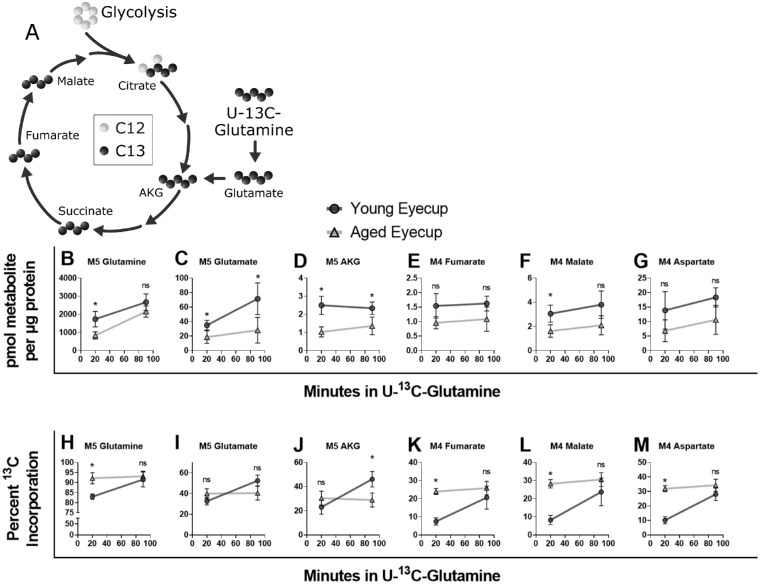
Methods: Scotopic and photopic electroretinogram (ERG) responses in young (3-6 months) and aged (23-26 months) C57Bl/6J mice were recorded. Metabolic flux in retina and eyecup explants was quantified using U-13C-glucose or U-13C-glutamine with gas chromatography-mass spectrometry (GC-MS), O2 consumption rate (OCR) in a perifusion apparatus, and quantifying adenosine triphosphatase (ATP) with a bioluminescence assay.

Results: Scotopic and photopic ERG responses were reduced in aged mice. Glucose metabolism, glutamine metabolism, OCR, and ATP pools in retinal explants were mostly unaffected in aged mice. In eyecups, glutamine usage in the Krebs Cycle decreased while glucose metabolism, OCR, and ATP pools remained stable.

Conclusions: Our examination of metabolism showed negligible impact of age on retina and an impairment of glutamine anaplerosis in eyecups. The metabolic stability of these tissues ex vivo suggests age-related metabolic alterations may not be intrinsic. Future experiments should focus on determining whether external factors including nutrient supply, oxygen availability, or structural changes influence ocular metabolism in vivo.


Conflict of interest statement

Disclosure: K.A. Tsantilas, None; W.M. Cleghorn, None; C.M. Bisbach, None; J.A. Whitson, None; D.T. Hass, None; B.M. Robbingsm, None; M. Sadilek, None; J.D. Linton, None; A.M. Rountree, None; A.P. Valencia, None; M.T. Sweetwyne, None; M.D. Campbell, None; H. Zhang, None; C.S.R. Jankowski, None; I.R. Sweet, None; D.J. Marcinek, None; P.S. Rabinovitch, None; J.B. Hurley, None

Figures

Figure 1.
Figure 1.
The study design is presented including the mouse groups, ages, and sex (A), the measures of visual function used (B), and the ex vivo approaches to characterizing metabolism (C) in the aging eye. The functional metabolic measurements are listed below the structure of the murine eye C, top left, from which we isolated two explants in this study C, center,: the retina RPE-choroid complex that includes the RPE, choroid, and sclera that has been cleared of connective tissue (eyecup). The cellular composition of these explants C, right, is highlighted with retinal cells shown in shades or red, purple, orange, and yellow, whereas the eyecup is shaded in variations of gray.
Figure 2.
Figure 2.
Single-flash ERGs were used to assess scotopic and photopic function in the retina. The averaged response curve in response to a 50 db flash are shown under scotopic (A) and photopic (B) conditions. Under scotopic conditions, the a-wave amplitude at 8 ms after the flash (C) and the b-wave amplitudes (D) were extracted from −50 to 50 db flashes of light. Both the a-wave and b-wave indicate a decline in the response of rod circuitry with aging. In photopic conditions (background light of 30 cd/m2), the average response curve to a 50 db flash B and the resulting b-wave magnitude from flashes of magnitude 0 to 100 db (E) show a decline in the response of cone circuitry with aging. Photopic function and temporal resolution were examined with a 5 db flash which flickered between frequencies of 20 to 50 Hz. The averaged response to 5 db light flickering at 37 Hz is shown for young (F) and aged animals (G). The young have a more uniform and stronger response to equivalent stimuli than aged animals. Aging decreased the magnitude of the response at equivalent frequencies (H) as calculated by Fast Fourier Transform. Sample sizes in scotopic single-flash and flicker measurements were 8 for young and 9 for aged, and in photopic single-flash measurements there were 12 young and 9 aged mice. Panels show the average ± standard deviation. Normality of data was determined using the Shapiro-Wilk test and P values were calculated using Mann-Whitney tests (* = P < 0.05).
Figure 3.
Figure 3.
Metabolic activity was examined by incubating retinal and RPE-choroid (eyecup) explants in U-13C-glucose between 2 and 45 minutes. The tissue was washed and frozen, and aliquots of the incubation media were collected for analysis (A). Labeled intermediates downstream of glucose were quantified (B) in terms of percent 13C incorporation, pmol of 13C-labeled isotopologue per µg of protein in the retinal or eyecup explant, and product:reactant ratios for glycolytic reactions and those pathways that can be entered via pyruvate. Percent incorporation, pool sizes, and amount of isotopologue are shown in Supplementary Figures S3 and S4. To examine glycolytic activity, the amount of exported M3 lactate was measured in the incubation media of retinas (C) and eyecups (D). One aged eyecup at 30 minutes was found to be an outlier by Grubb's test (alpha = 0.05, P < 0.05) and removed. The slopes of the lines were all non-zero in retina (pyoung = 0.002 and paged = 0.0003) and eyecups (pyoung = 0.03 and paged = 0.009), but showed no significant age-related change (regression slope: pretina = 0.7 and peyecup = 0.3). Within tissues, product:reactant ratios in glycolysis and common exit points to other pathways were plotted at 30 minutes because both tissues had reached a steady state. No significant age-related changes were seen in retina (E, G) or eyecup (F, G). Moving into the Krebs Cycle B at 30 minutes, no statistically significant age-related were observed in retina (H) or eyecup (I) explants. Normality of data was determined using the Shapiro-Wilk test and P values were calculated for age-related comparisons using Mann-Whitney tests (* = P < 0.05). Error bars represent the standard deviation, except in panels C and D, which show the 95% confidence interval for the linear regression. GAP, glyceraldehyde 3-phosphate; DHAP, dihydroxyacetone phosphate; 3PG, 3-phosphoglycerate; PEP, phosphoenolpyruvate; Pyr, pyruvate; Ala, alanine; Cit, citrate; AKG, α-ketoglutarate; Succ, succinate; Fum, fumarate; Mal, malate.
Figure 4.
Figure 4.
Metabolic activity with glutamine – and in the mitochondria more broadly – was examined by incubating eyecup explants in U-13C-glutamine for 20 or 90 minutes. The M4 and M5 labeled isotopologues entering into and proceeding through the Krebs cycle (A) were quantified in terms of pmol of 13C-labeled isotopologue per µg of protein in eyecup explants (B–G). M5 glutamine B, glutamate C, and AKG D trended lower in the aged eyecups compared to young at both time points examined, although glutamine did not reach statistical significance at 90 minutes. In the downstream intermediates fumarate E, malate F, and aspartate G this decline was reproduced, but did not reach statistical significance. The percent incorporation of 13C remains essentially unchanged in aged eyecups at both time points in all intermediates examined (H–M). Young percent 13C incorporation rises past the aged in glutamate I and AKG J. However, in glutamine H, fumarate K, malate L, and aspartate M, the percent of 13C incorporation was consistently lower in young eyecups at 20 minutes, but had essentially matched the aged by 90 minutes. These changes can be related back to pool size and product:reactant ratios, which are included in Supplementary Figure S5. Normality of data was determined using the Shapiro-Wilk test and P values were calculated for age-related comparisons using Mann-Whitney tests (* = P < 0.05). Error bars represent the standard deviation.

Similar articles

Cited by

References

    1. Owsley C. Aging and vision. Vision Res. 2011; 51(13): 1610–1622. - PMC - PubMed
    1. Klein R, Klein BEK.. The prevalence of age-related eye diseases and visual impairment in aging: Current estimates. Investig Ophthalmol Vis Sci. 2013; 54(14): ORSF5–ORSF13. - PMC - PubMed
    1. Elliott DB, Yang KCH, Whitaker D.. Visual acuity changes throughout adulthood in normal, healthy eyes: Seeing beyond 6/6. Optom Vis Sci. 1995; 72(3): 186–191. - PubMed
    1. Ferrer-Blasco T, González-Méijome JM, Montés-Micó R.. Age-related changes in the human visual system and prevalence of refractive conditions in patients attending an eye clinic. J Cataract Refract Surg. 2008; 34(3): 424–432. - PubMed
    1. Gu X, Neric NJ, Crabb JS, et al. .. Age-related changes in the retinal pigment epithelium (RPE). PLoS One. 2012; 7(6): e38673. - PMC - PubMed

Publication types