. 2021 Dec 28;15(12):19956-19969.
doi: 10.1021/acsnano.1c07470. Epub 2021 Nov 19.

Noninvasive and Highly Multiplexed Five-Color Tumor Imaging of Multicore Near-Infrared Resonant Surface-Enhanced Raman Nanoparticles In Vivo

Affiliations

Noninvasive and Highly Multiplexed Five-Color Tumor Imaging of Multicore Near-Infrared Resonant Surface-Enhanced Raman Nanoparticles In Vivo

Jung Ho Yu et al. ACS Nano. .

Abstract

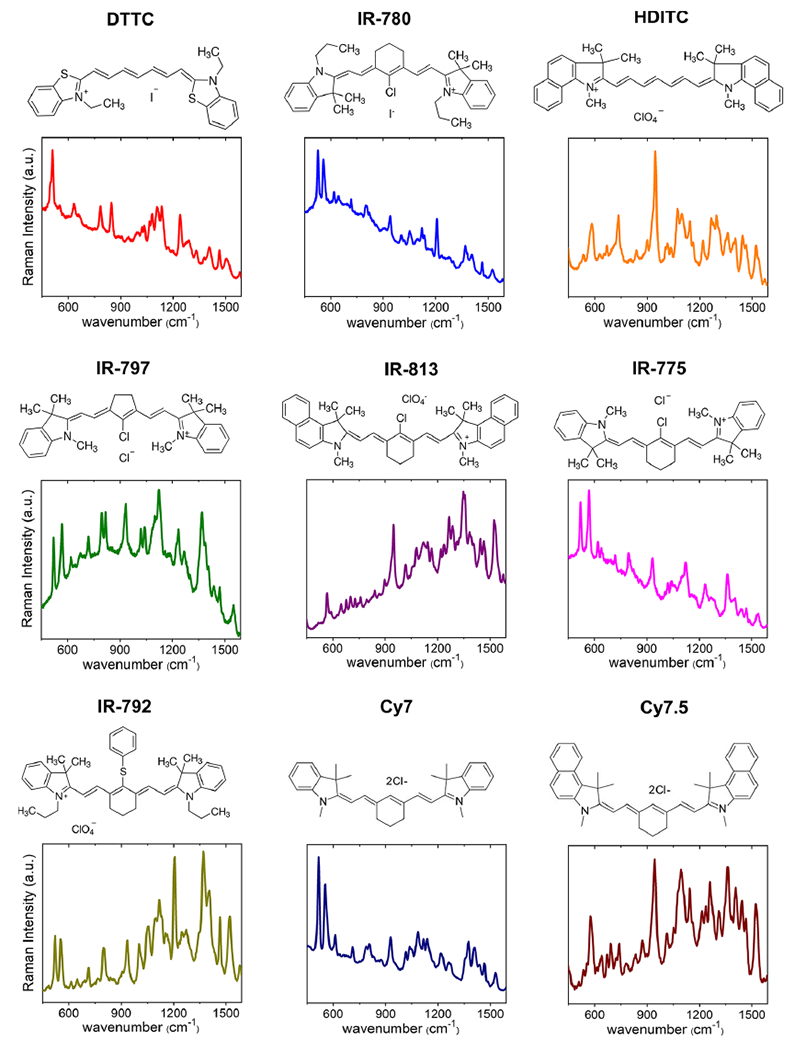
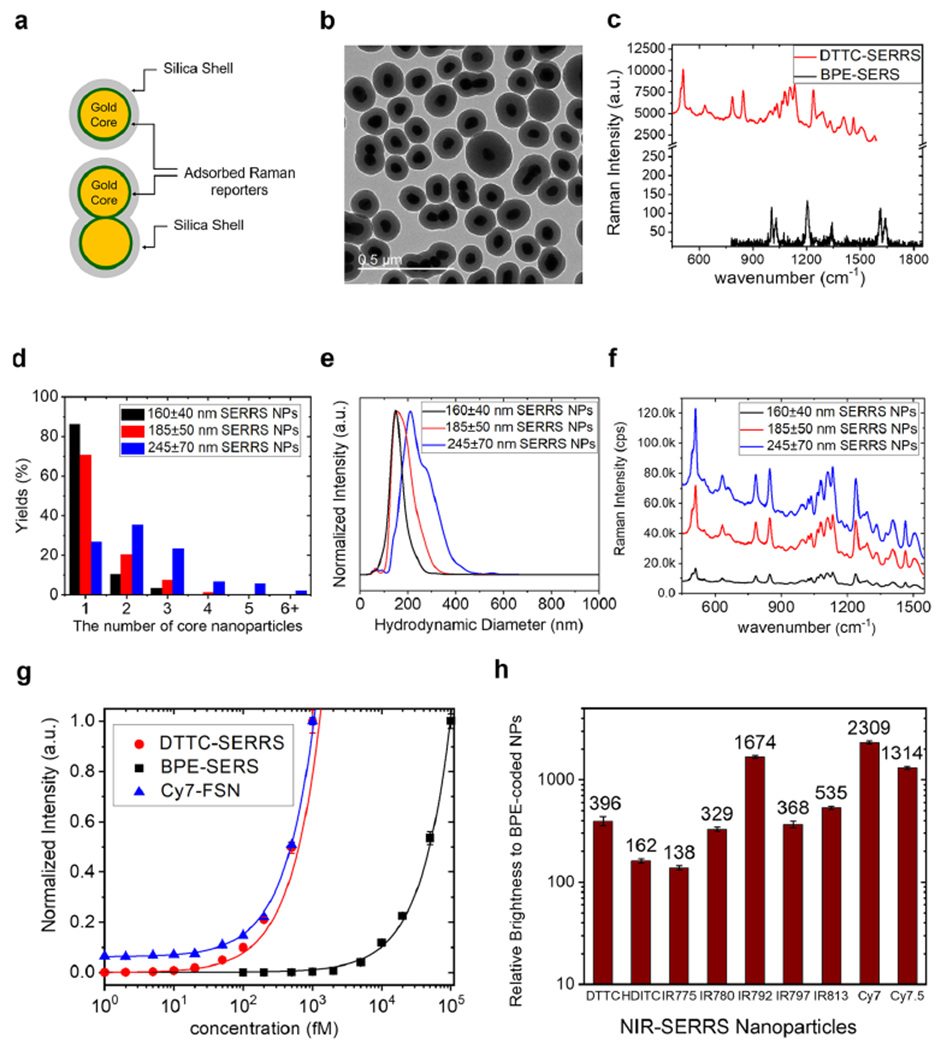
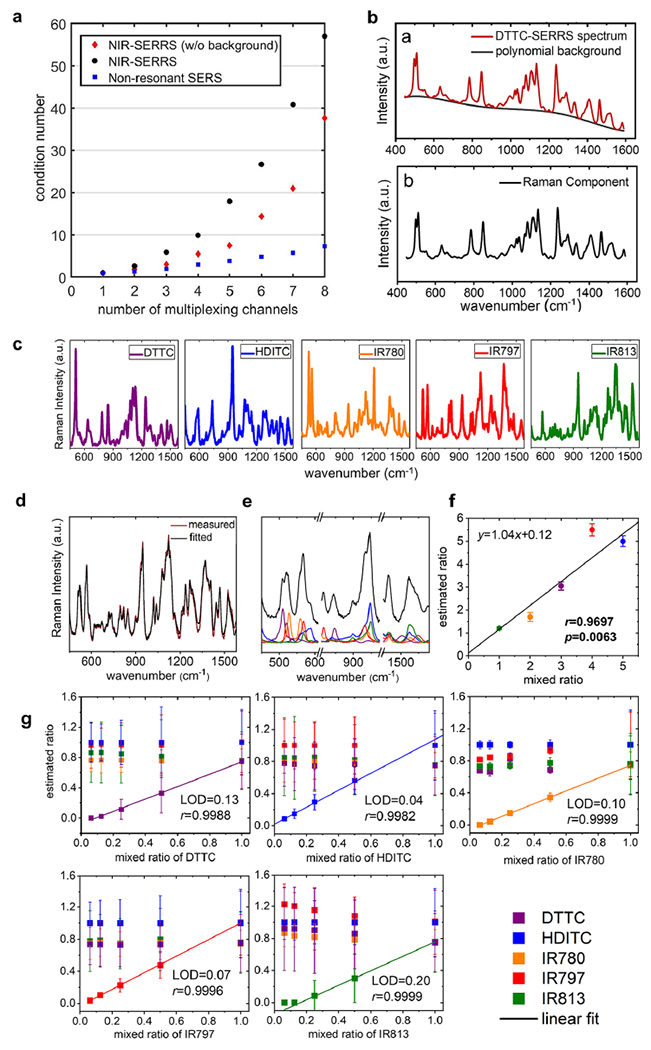
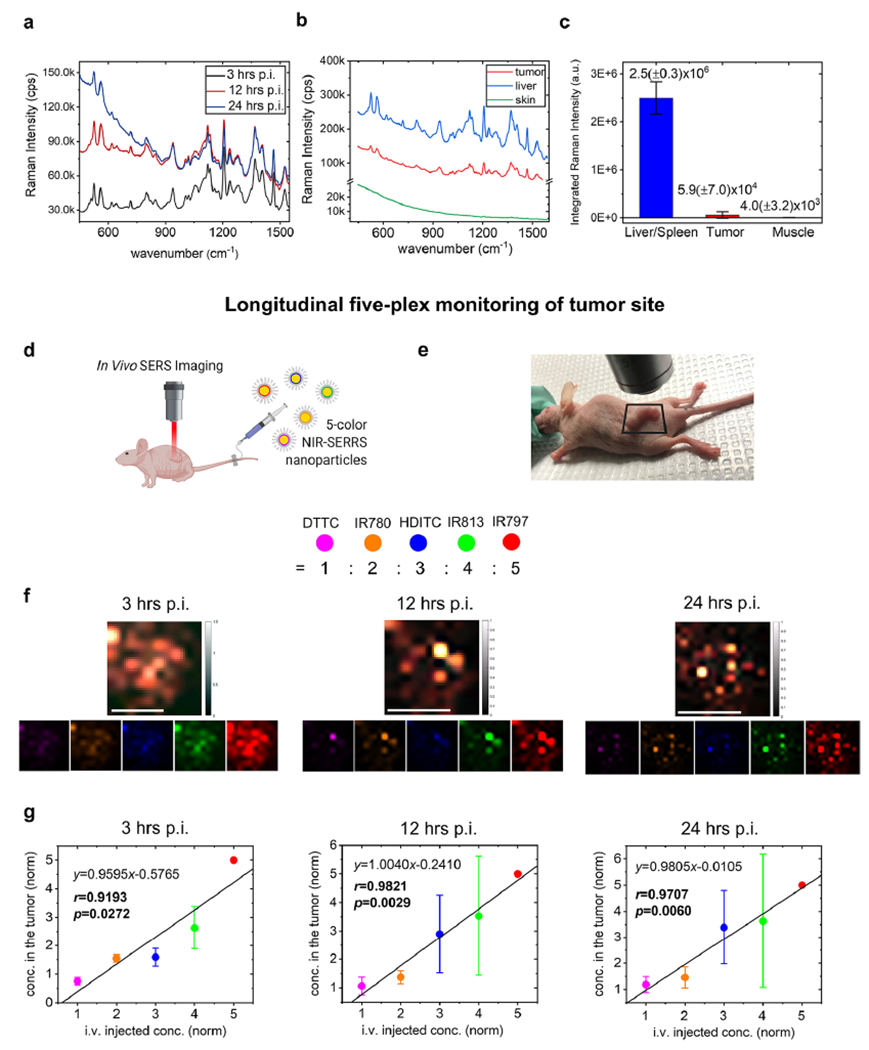
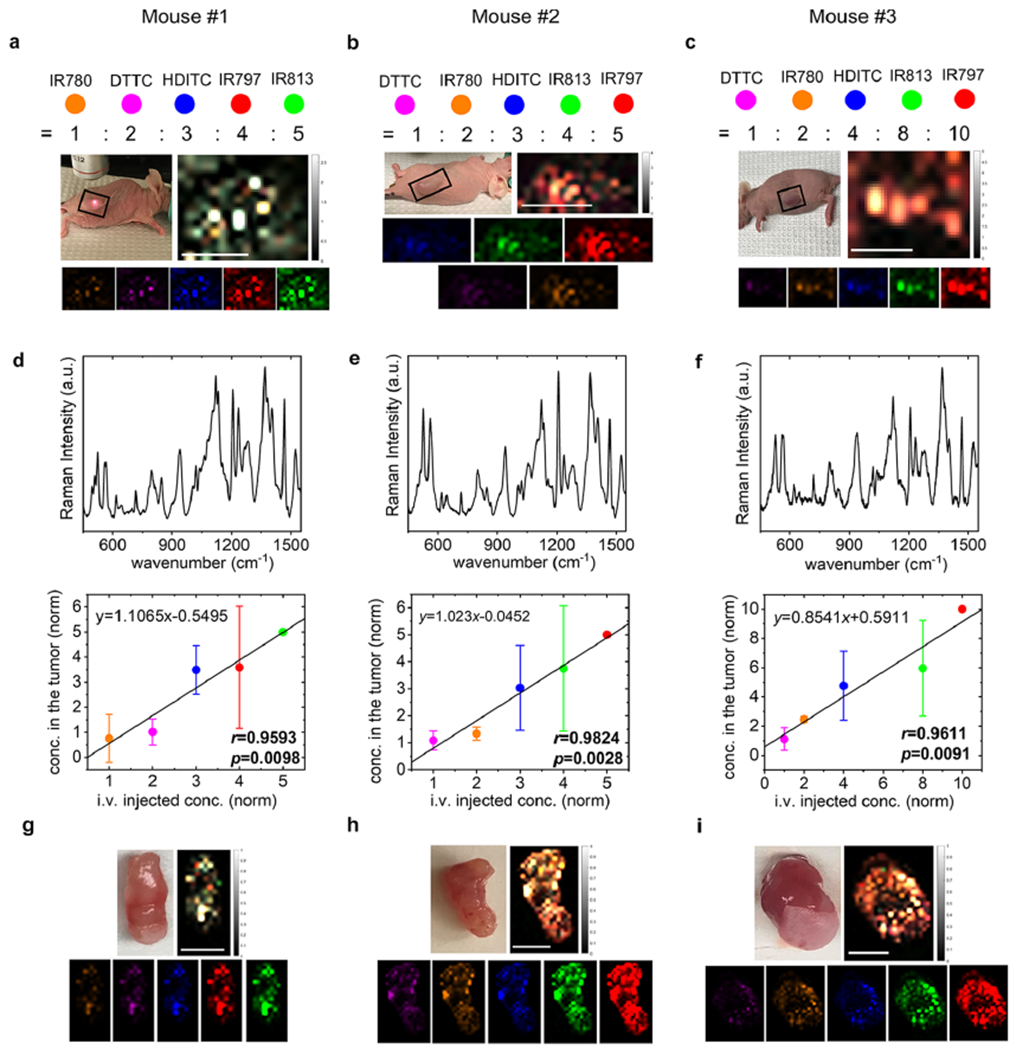
In vivo multiplexed imaging aims for noninvasive monitoring of tumors with multiple channels without excision of the tissue. While most of the preclinical imaging has provided a number of multiplexing channels up to three, Raman imaging with surface-enhanced Raman scattering (SERS) nanoparticles was suggested to offer higher multiplexing capability originating from their narrow spectral width. However, in vivo multiplexed SERS imaging is still in its infancy for multichannel visualization of tumors, which require both sufficient multiplicity and high sensitivity concurrently. Here we create multispectral palettes of gold multicore-near-infrared (NIR) resonant Raman dyes-silica shell SERS (NIR-SERRS) nanoparticle oligomers and demonstrate noninvasive and five-plex SERS imaging of the nanoparticle accumulation in tumors of living mice. We perform the five-plex ratiometric imaging of tumors by varying the administered ratio of the nanoparticles, which simulates the detection of multiple biomarkers with different expression levels in the tumor environment. Furthermore, since this method does not require the excision of tumor tissues at the imaging condition, we perform noninvasive and longitudinal imaging of the five-color nanoparticles in the tumors, which is not feasible with current ex vivo multiplexed tissue analysis platforms. Our work surpasses the multiplicity limit of previous preclinical tumor imaging methods while keeping enough sensitivity for tumor-targeted in vivo imaging and could enable the noninvasive assessment of multiple biological targets within the tumor microenvironment in living subjects.

Keywords: cancer imaging; in vivo imaging; multiplexed imaging; surface-enhanced Raman spectroscopy; surface-enhanced resonant Raman scattering.


Conflict of interest statement

The authors declare no competing financial interest.

Figures

Figure 1.
Figure 1.
Nine spectrally different NIR-resonant Raman spectra. Molecular structures and the corresponding Raman spectra of heptamethine cyanine NIR-resonant Raman reporters that were embedded in the NIR-SERRS nanoparticles.
Figure 2.
Figure 2.
Synthesis and characterization of multispectral NIR-SERRS nanoparticles. (a) A schematic of gold nanoparticle core-Raman reporters-silica shell-structured NIR-SERRS nanoparticles. (b) A TEM image of the NIR-SERRS nanoparticles. The average size of the gold nanoparticle core is 60 nm in diameter, which is coated with a 40 nm-thick silica shell. The nanoparticles are mixtures of monomeric (single gold core in a silica shell), dimeric (double gold core in a silica shell), and oligomeric (multiple gold core in a silica shell) structures. Scale bar: 500 nm. (c) Raman spectra of the NIR-SERRS nanoparticles of 3,3’-diethylthiatricarbocyanine iodide (red, DTTC-SERRS, 160 ± 40 nm) and the nonresonant SERS nanoparticles of 1,2-bis(4-pyridyl)ethylene (black, BPE-SERS, S440, Oxonica Materials Inc., 180 ± 50 nm, see Supporting Information Figure S1) at the same nanoparticle concentration of 10 pM. (d–f) Controlled oligomerization of the nanoparticles upon the increase of the added DTTC dyes amount during the DTTC-coded SERRS nanoparticles syntheses: 10 nmol (160 ± 40 nm, black), 15 nmol (185 ± 50 nm, red), to 20 nmol (245 ± 70 nm, blue). The dose-dependent change in the number of gold nanoparticle cores in a single NIR-SERRS nanoparticle (d, see Supporting Information Figure S3), hydrodynamic diameter (e), and the Raman intensity (f) of the DTTC-coded SERRS nanoparticles. (g) Normalized standard curves of Raman intensities of the DTTC-coded SERRS nanoparticles (red, DTTC-SERRS, 185 ± 50 nm) and the BPE-coded SERS nanoparticles (black, BPE-SERS, 180 ± 50 nm), and the NIR fluorescence intensity of the Cy7 dye-doped silica nanoparticles (blue, Cy7-FSN, 215 ± 20 nm, see Supporting Information Figure S5). The LOD calculated from the curves were 3.8 ± 0.38 fM (red), 21.2 ± 6.6 fM (blue), and 650 ± 29 fM (black) concentrations of the nanoparticles, respectively (see Supporting Information Figure S6). (h) The Raman scattering brightness of the 9 NIR-SERRS nanoparticles with respect to the BPE-coded SERS nanoparticles (S440, Oxonica Materials), measured at 10 pM. The error bars (g and h) represent the standard deviations of the Raman intensities collected from multiple points (n = 300) scanning per measurement.
Figure 3.
Figure 3.
Multiplexing of the NIR-SERRS nanoparticles. (a) The plot of the lowest condition number versus the number of multiplex channels for the nonresonant SERS spectra (blue squares) and the NIR-SERRS spectra with (red diamonds) and without (black circles) polynomial background removals. (b) A measured spectrum of DTTC-coded SERRS nanoparticles (red in upper panel), in which the fluorescence background was fitted with a fifth-order polynomial (black in upper panel). The pure Raman component of the DTTC-coded SERRS spectrum after the polynomial-fitted background removal (lower panel). (c) The five NIR-SERRS reference spectra selected from the condition number analysis (a). (d–f) Spectral unmixing of a five-color NIR-SERRS nanoparticle mixture. A comparison between the measured Raman spectrum of the five-color NIR-SERRS nanoparticle mixture (red) and the best-fitted Raman spectrum (black) by an LMF least-squares method (d). The fitted Raman spectrum of the NIR-SERRS nanoparticle mixture in the selected wavenumber range (black), which shows the linear combination of the five NIR-SERRS spectra (e). The estimated ratios of the five-color NIR-SERRS nanoparticles from the spectral unmixing (d and e), which were normalized to the average concentration of the HDITC-coded nanoparticles that were set as 5. The five-color NIR-SERRS nanoparticles were mixed with 1:2:3:4:5 ratio of IR813, IR780, DTTC, IR797, and HDITC-coded SERRS nanoparticles, respectively. (g) The sensitivity of the five-plex Raman spectroscopy. The estimated ratio of the five-color NIR-SERRS nanoparticle mixtures, in which the concentrations of the four NIR-SERRS nanoparticles were kept constant as 1.0, and the fifth nanoparticle concentration was serially diluted. The ratios of all the nanoparticles were normalized to the average concentration of the IR797-coded nanoparticles (for the HDITC-coded nanoparticle variation) or that of HDITC-coded nanoparticles (for the other nanoparticles variations). The estimated ratio of the one nanoparticle variate was linearly fitted with the serially diluted ratio. The error bars (f and g) represent standard deviations of the nanoparticle concentrations, which were derived from the spectral unmixing of the multiple points spectra (n = 300) per single mixture measurement. Color codes of the five-color NIR-SERRS nanoparticles: DTTC, purple; HDITC, blue; IR780, orange; IR797, red; and IR813, green for (c), (e), (f), and (g).
Figure 4.
Figure 4.
In Vivo five-plex imaging of tumor-targeted NIR-SERRS nanoparticles in a living mouse. (a) In vivo Raman spectra from the subcutaneous tumor at 3 h (black), 12 h (red), and 24 h (blue) postinjection (p.i.) of the five-color NIR-SERRS nanoparticles. (b) In vivo Raman spectra from the tumor (red), the liver (blue), and the noncancerous skin (green) of the tumor xenograft nude mouse after 24 h postinjection of the five-color NIR-SERRS nanoparticles. (c) Integrated Raman intensities from the excised tissues of the liver and spleen (blue), the tumor (red), and the muscle (green) after 24 h postinjection of the mixture of the five-color nanoparticles with different ratios. The error bars represent the standard deviations of the Raman intensities (n = 3, see Supporting Information Figure S13). (d) A schematic of Raman imaging of a subcutaneous tumor in a live nude mouse, to which the five-color NIR-SERRS nanoparticles were injected via tailvein. Image created with BioRender.com. (e–g) Noninvasive and multiplexed monitoring of the five-color NIR-SERRS nanoparticles at the tumor site on a live nude mouse. The ROI for the imaging was defined as a square (e). Five-plex Raman images of the subcutaneous tumor site at 3, 12, and 24 h postinjection of the five-color nanoparticles. The images were generated through the spectral unmixing of Raman spectra in each pixel and color-coded (lower panel, f) and merged (upper panel, f). Scale bar: 10 mm. The normalized concentrations (ratios) of the five-color nanoparticles within the tumor (g), obtained from the spectral unmixing of the Raman spectra in each pixel and averaged over the entire images (f). In each pixel, the five-color nanoparticle concentrations were normalized to the concentration of the IR797-coded NIR-SERRS nanoparticles that were set as 5. The error bars: the standard deviations of the spectrally unmixed concentrations calculated over the entire pixelated spectra. Color codes of the NIR-SERRS nanoparticles: DTTC, magenta-purple; HDITC, blue; IR780, orange; IR797, red; and IR813, green for (f and g). For all the experiments except (c), the NIR-SERRS nanoparticles were mixed with 1:2:3:4:5 molar ratio of DTTC, IR780, HDITC, IR813, and IR797-coded SERRS nanoparticles, respectively, and were concurrently administered.
Figure 5.
Figure 5.
Correlation of the five-color NIR-SERRS nanoparticles injection ratio with the multiplexed Raman images of the tumors. (a–c) Tumor-xenograft nude mice (left, upper panel), and the five-color multiplexed Raman images of their tumors (right, upper panel), for which the ROI was defined as rectangles in the photograph. The multiplexed images were generated through the spectral unmixing of Raman spectra in each pixel, followed by color-coding (lower panels) and merge (right, upper panel). (d–f) Representative Raman spectra (upper panel) and the normalized concentrations (ratios) of the five-color NIR-SERRS nanoparticles (lower panel) in the tumors, obtained from the spectral unmixing of the Raman spectra in each pixel and averaged over the entire images of (a) (d), (b) (e), and (c) (f). In each pixel, the five-color nanoparticle concentrations were normalized to the concentration of the IR813-coded (d) or IR797-coded NIR-SERRS nanoparticles (e and f) that were set as 5 (d and e) or 10 (f). The error bars: the standard deviations of the spectrally unmixed concentrations calculated from all the pixelated Raman spectra in the ROIs. (g–i) Ex vivo tumor tissues (left, upper panel) and their respective five-color multiplexed Raman images (right, upper panel). The multiplexed images were generated through the spectral unmixing of Raman spectra in each pixel, followed by color-coding (lower panels) and merge (right, upper panel). The color-coded Raman images were organized with the order of increasing brightness from the left to right (lower panel, a–c, and g–i). The mixture of 1:2:3:4:5 molar ratio of IR780, DTTC, HDITC, IR797, and IR813-coded nanoparticles (mouse #1, (a), (d), and (g)), respectively, or 1:2:3:4:5 molar ratio of DTTC, IR780, HDITC, IR813, IR797 (mouse #2, (b), (e), and (h)), or 1:2:4:8:10 molar ratio of DTTC, IR780, HDITC, IR813, IR797 (mouse #3, (c), (f), and (i)), respectively, was prepared and concurrently injected via tail-vein. Color codes of the five-color NIR-SERRS nanoparticles: DTTC, magenta-purple; HDITC, blue; IR780, orange; IR797, red; and IR813, green. Scale bar: 10 mm.

Similar articles

Cited by

References

    1. Dagogo-Jack I; Shaw AT Tumour Heterogeneity and Resistance to Cancer Therapies. Nat. Rev. Clin. Oncol 2018, 15, 81–94. - PubMed
    1. Heinzmann K; Carter LM; Lewis JS; Aboagye EO Multiplexed Imaging for Diagnosis and Therapy. Nat. Biomed. Eng 2017, 1, 697–713. - PubMed
    1. Kobayashi H; Longmire MR; Ogawa M; Choyke PL; Kawamoto S Multiplexed Imaging in Cancer Diagnosis: Applications and Future Advances. Lancet Oncol. 2010, 11, 589–595. - PMC - PubMed
    1. Wang YW; Reder NP; Kang S; Glaser AK; Liu JTC Multiplexed Optical Imaging of Tumor-Directed Nanoparticles: A Review of Imaging Systems and Approaches. Nanotheranostics 2017, 1, 369–388. - PMC - PubMed
    1. Angelo M; Bendall SC; Finck R; Hale MB; Hitzman C; Borowsky A; Levenson RM; Lowe JB; Liu SD; Zhao S; Natkunam Y; Nolan GP Multiplexed Ion Beam Imaging of Human Breast Tumors. Nat. Med 2014, 20, 436–442. - PMC - PubMed

Publication types