. 2022 Feb 2;110(3):452-469.e14.
doi: 10.1016/j.neuron.2021.10.036. Epub 2021 Nov 18.

Transcriptomic taxonomy and neurogenic trajectories of adult human, macaque, and pig hippocampal and entorhinal cells

Affiliations

Transcriptomic taxonomy and neurogenic trajectories of adult human, macaque, and pig hippocampal and entorhinal cells

Daniel Franjic et al. Neuron. .

Abstract

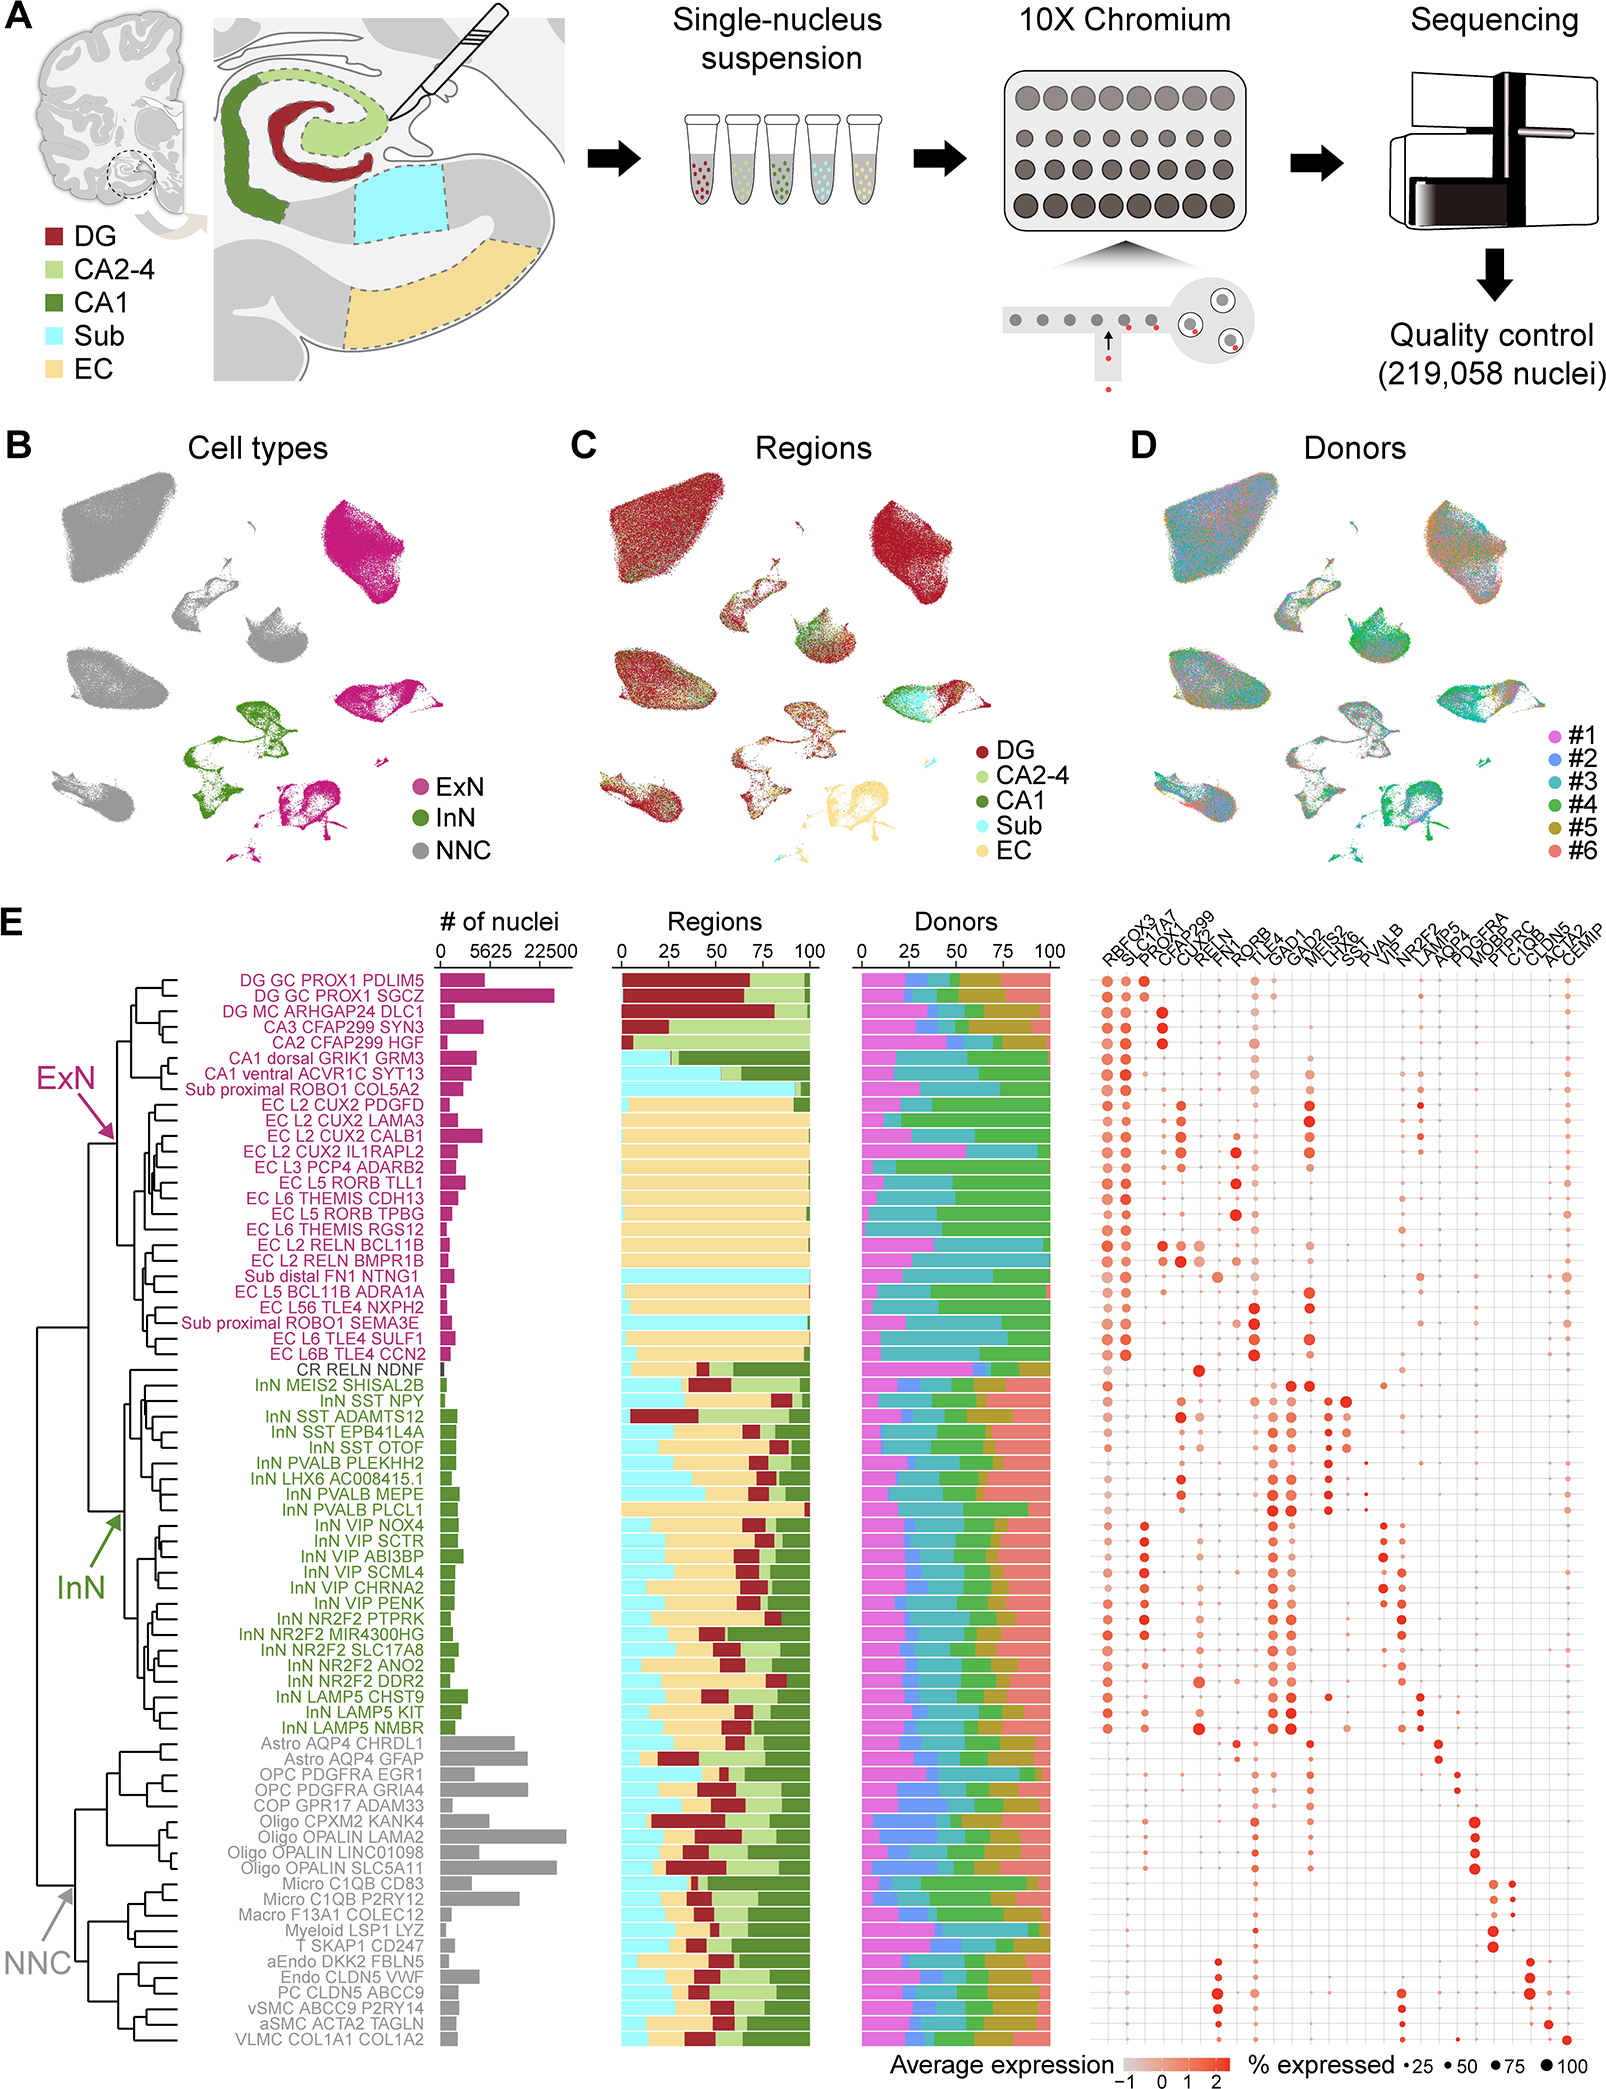
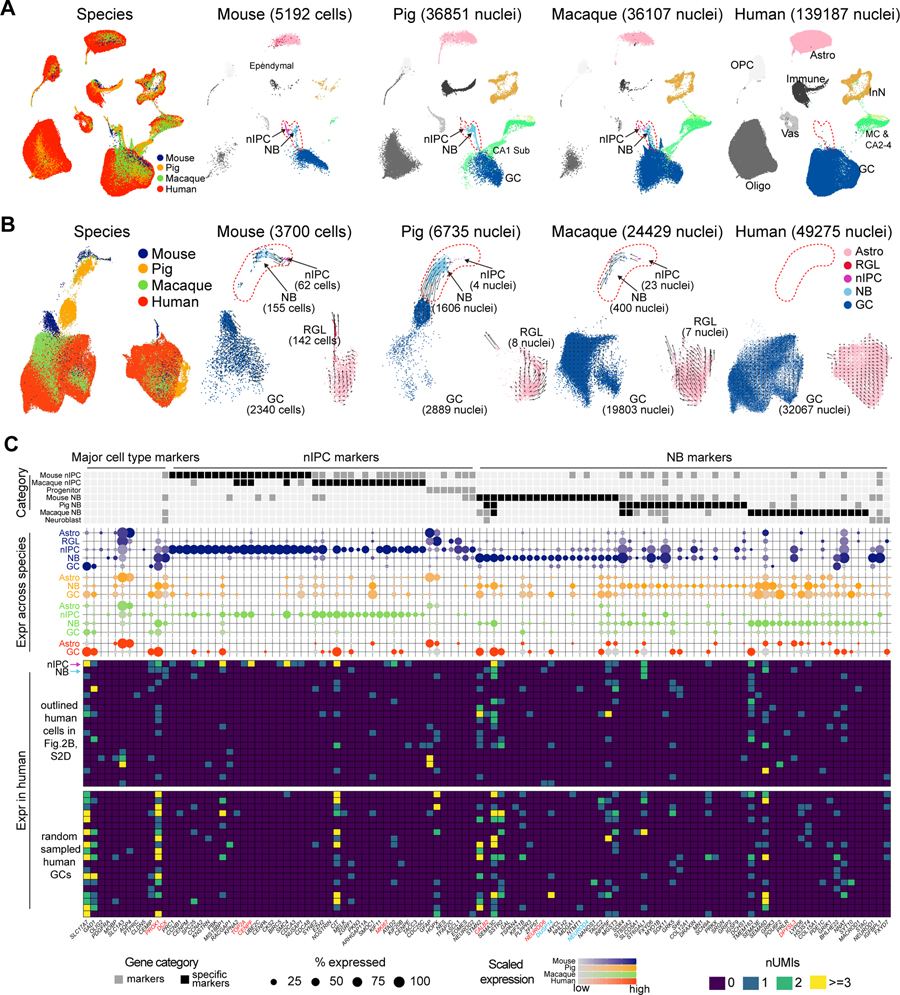
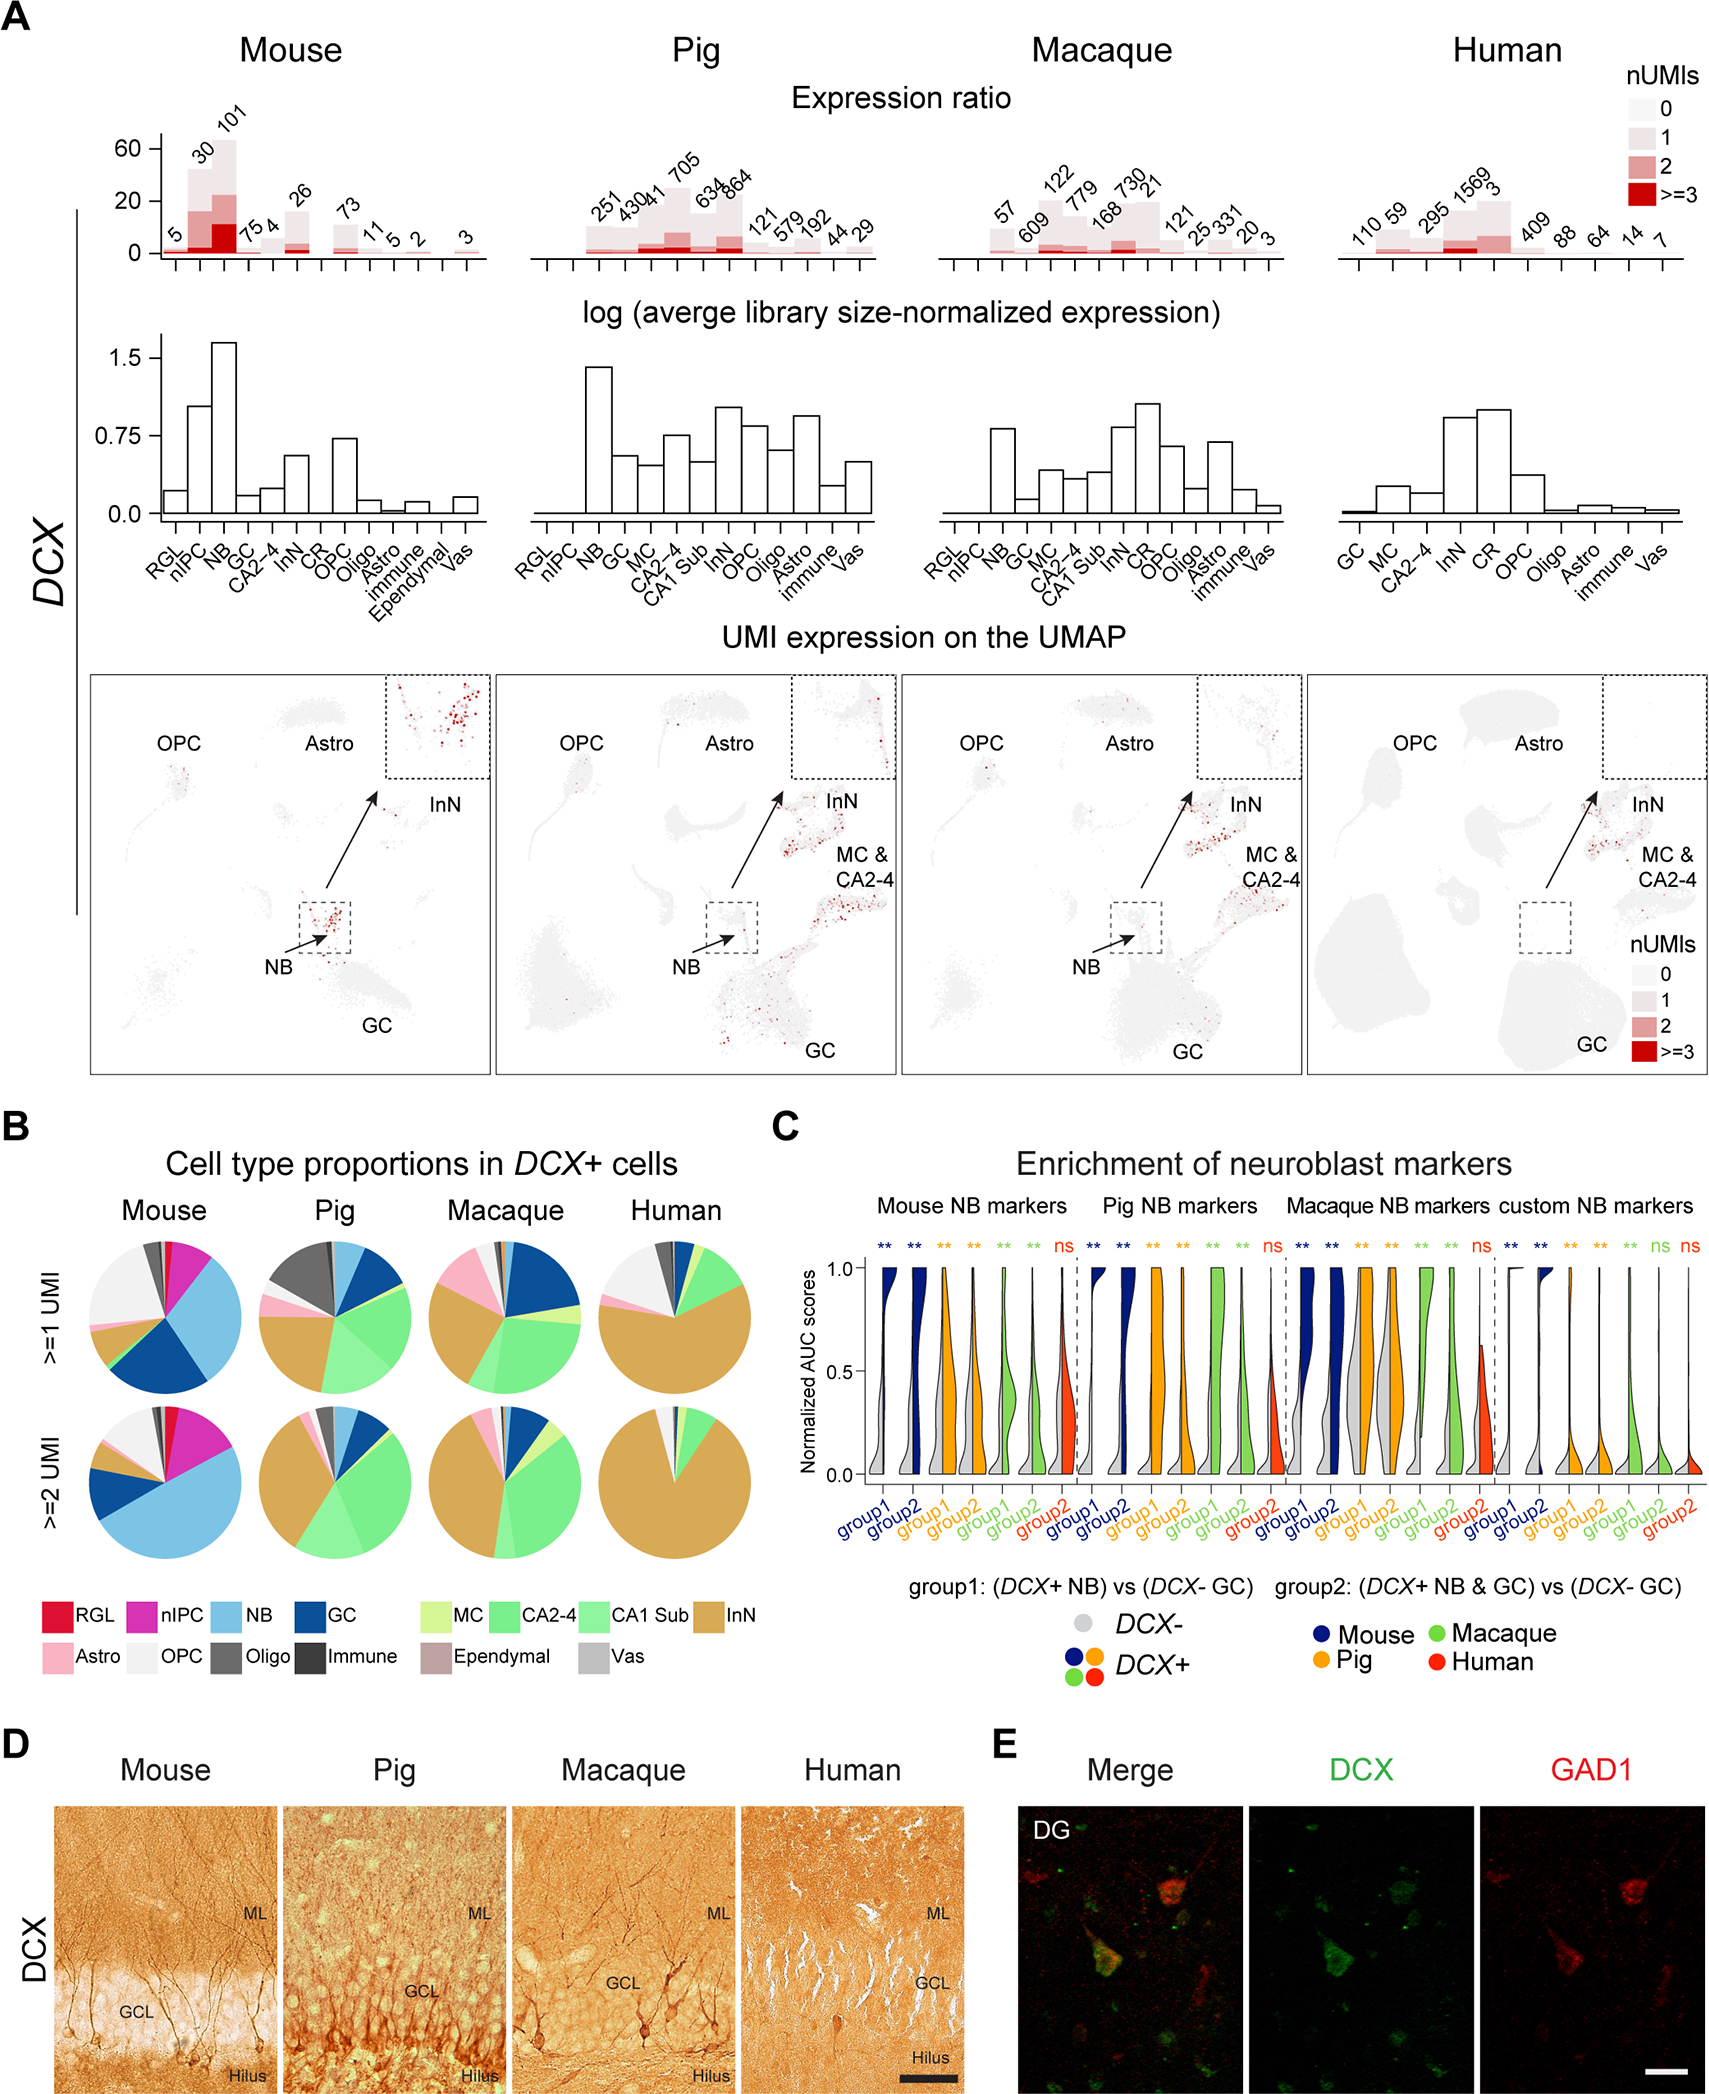
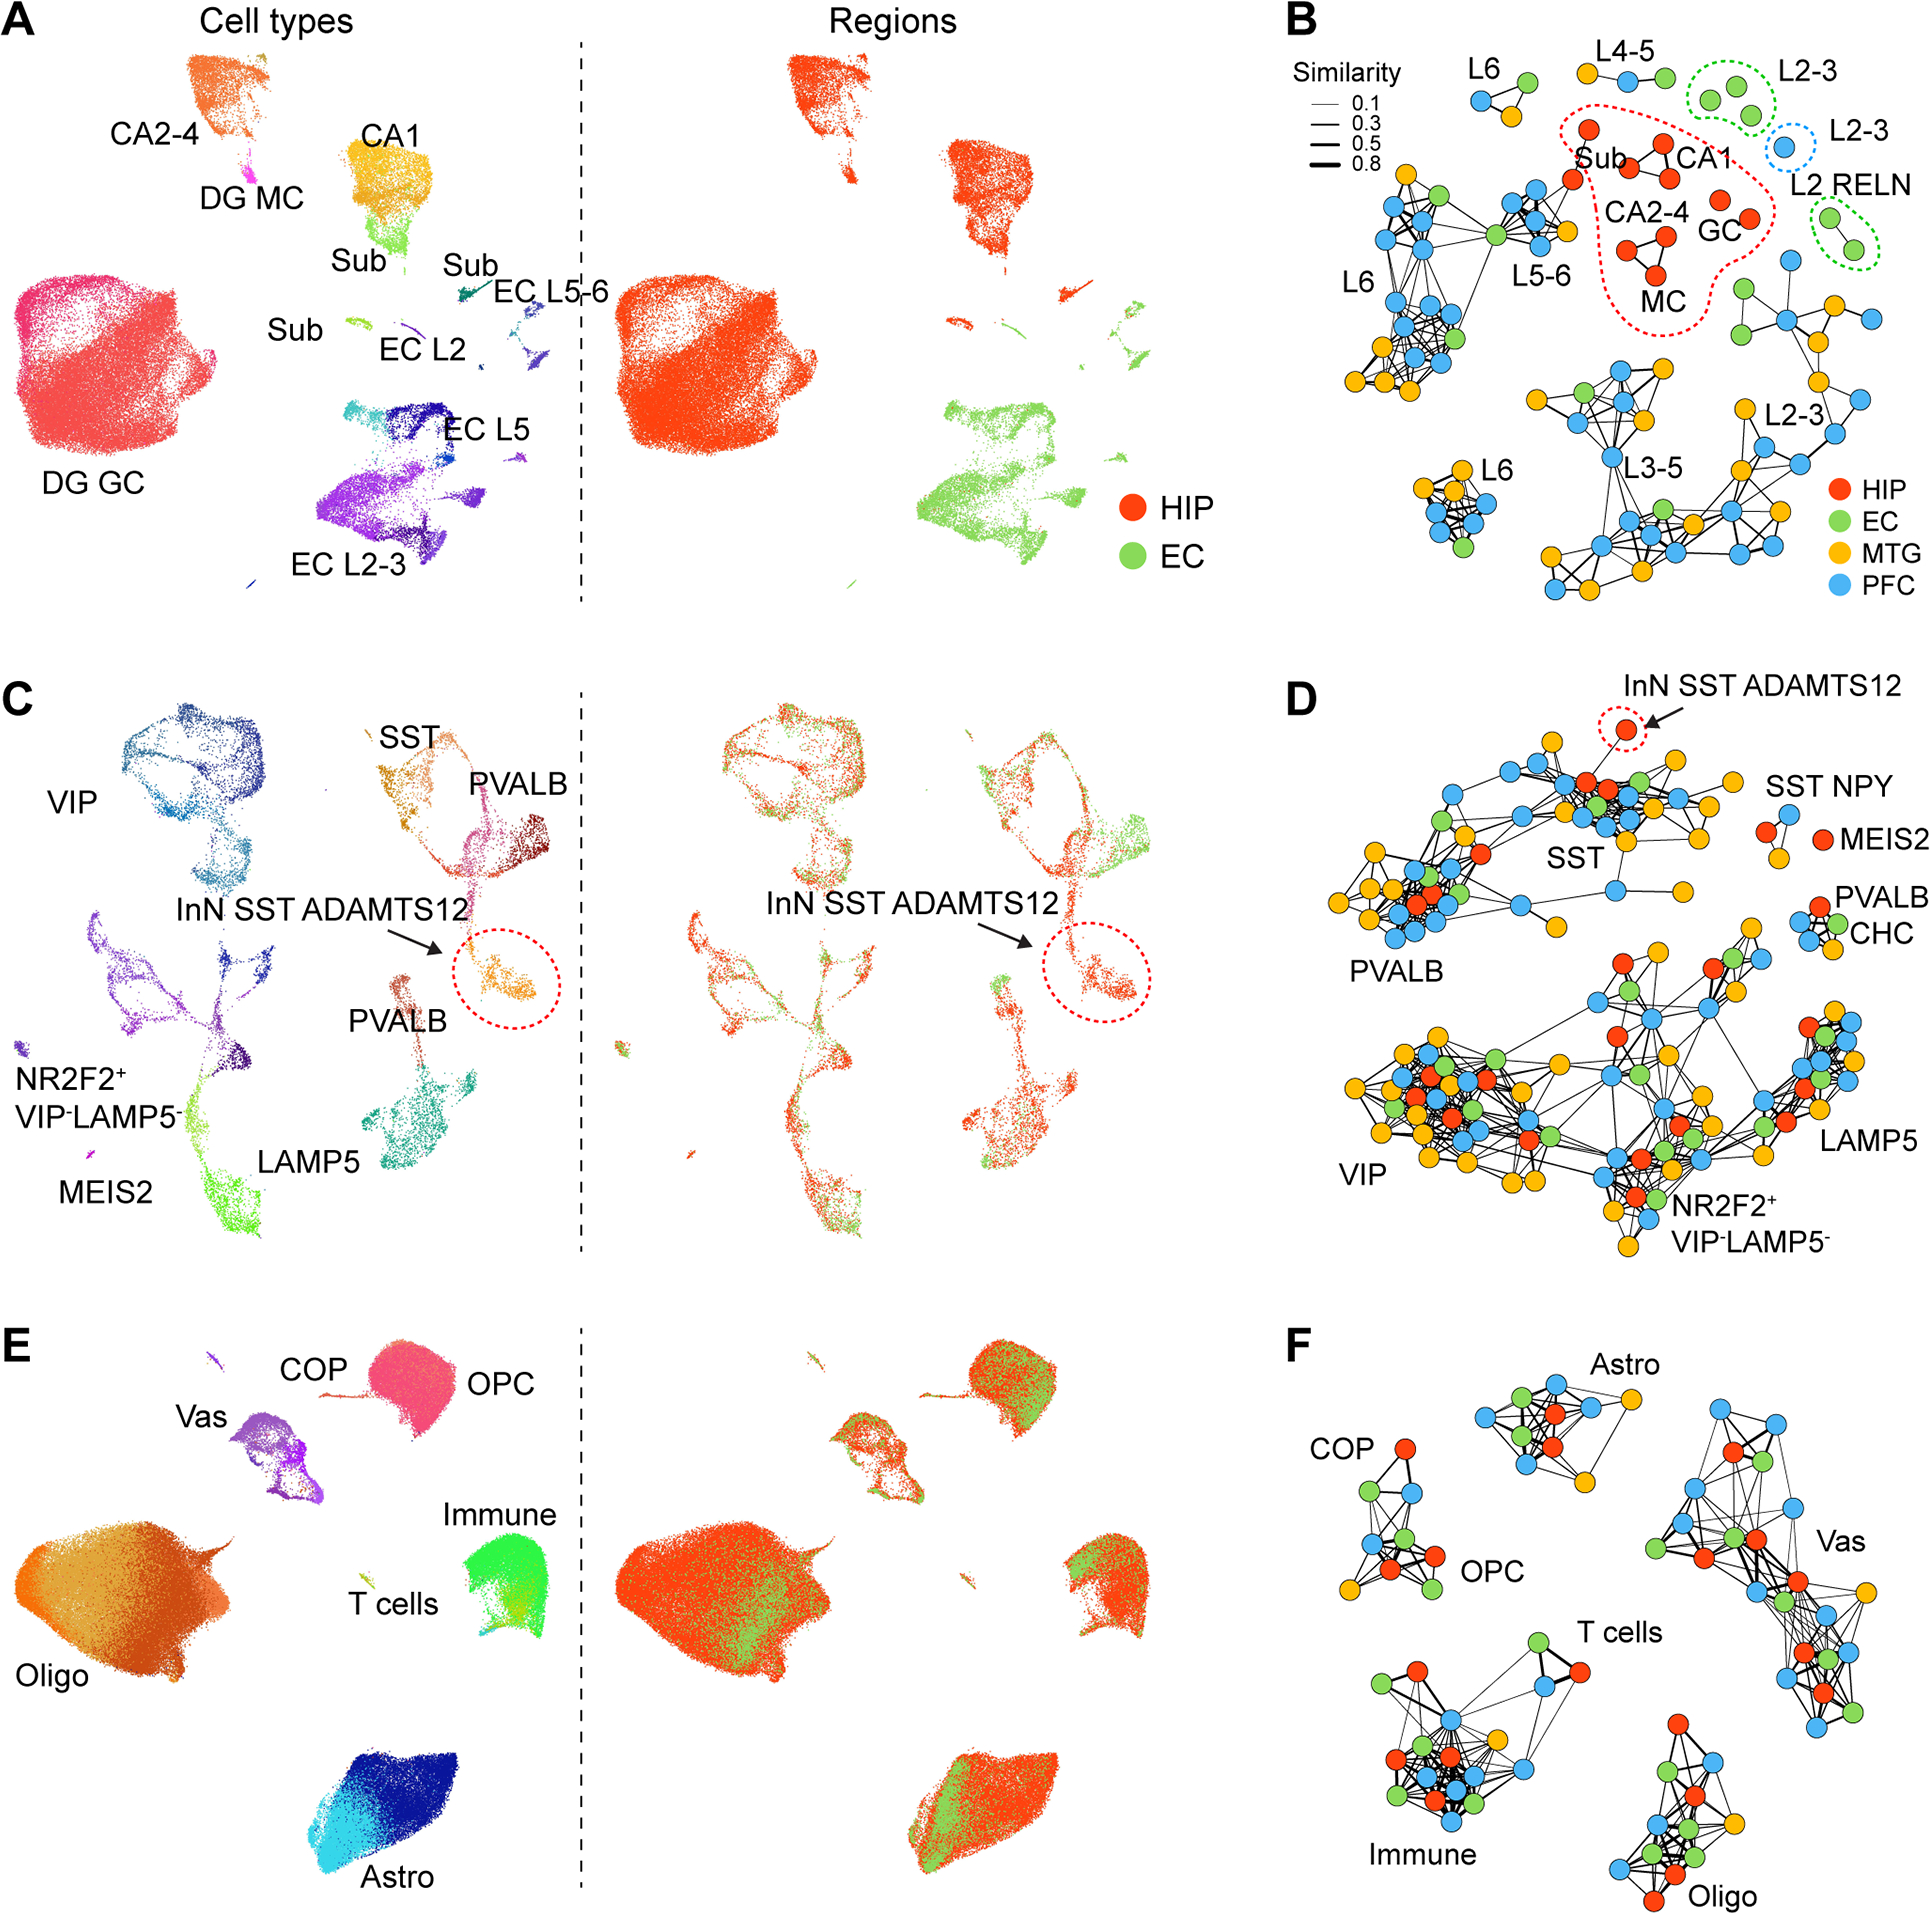
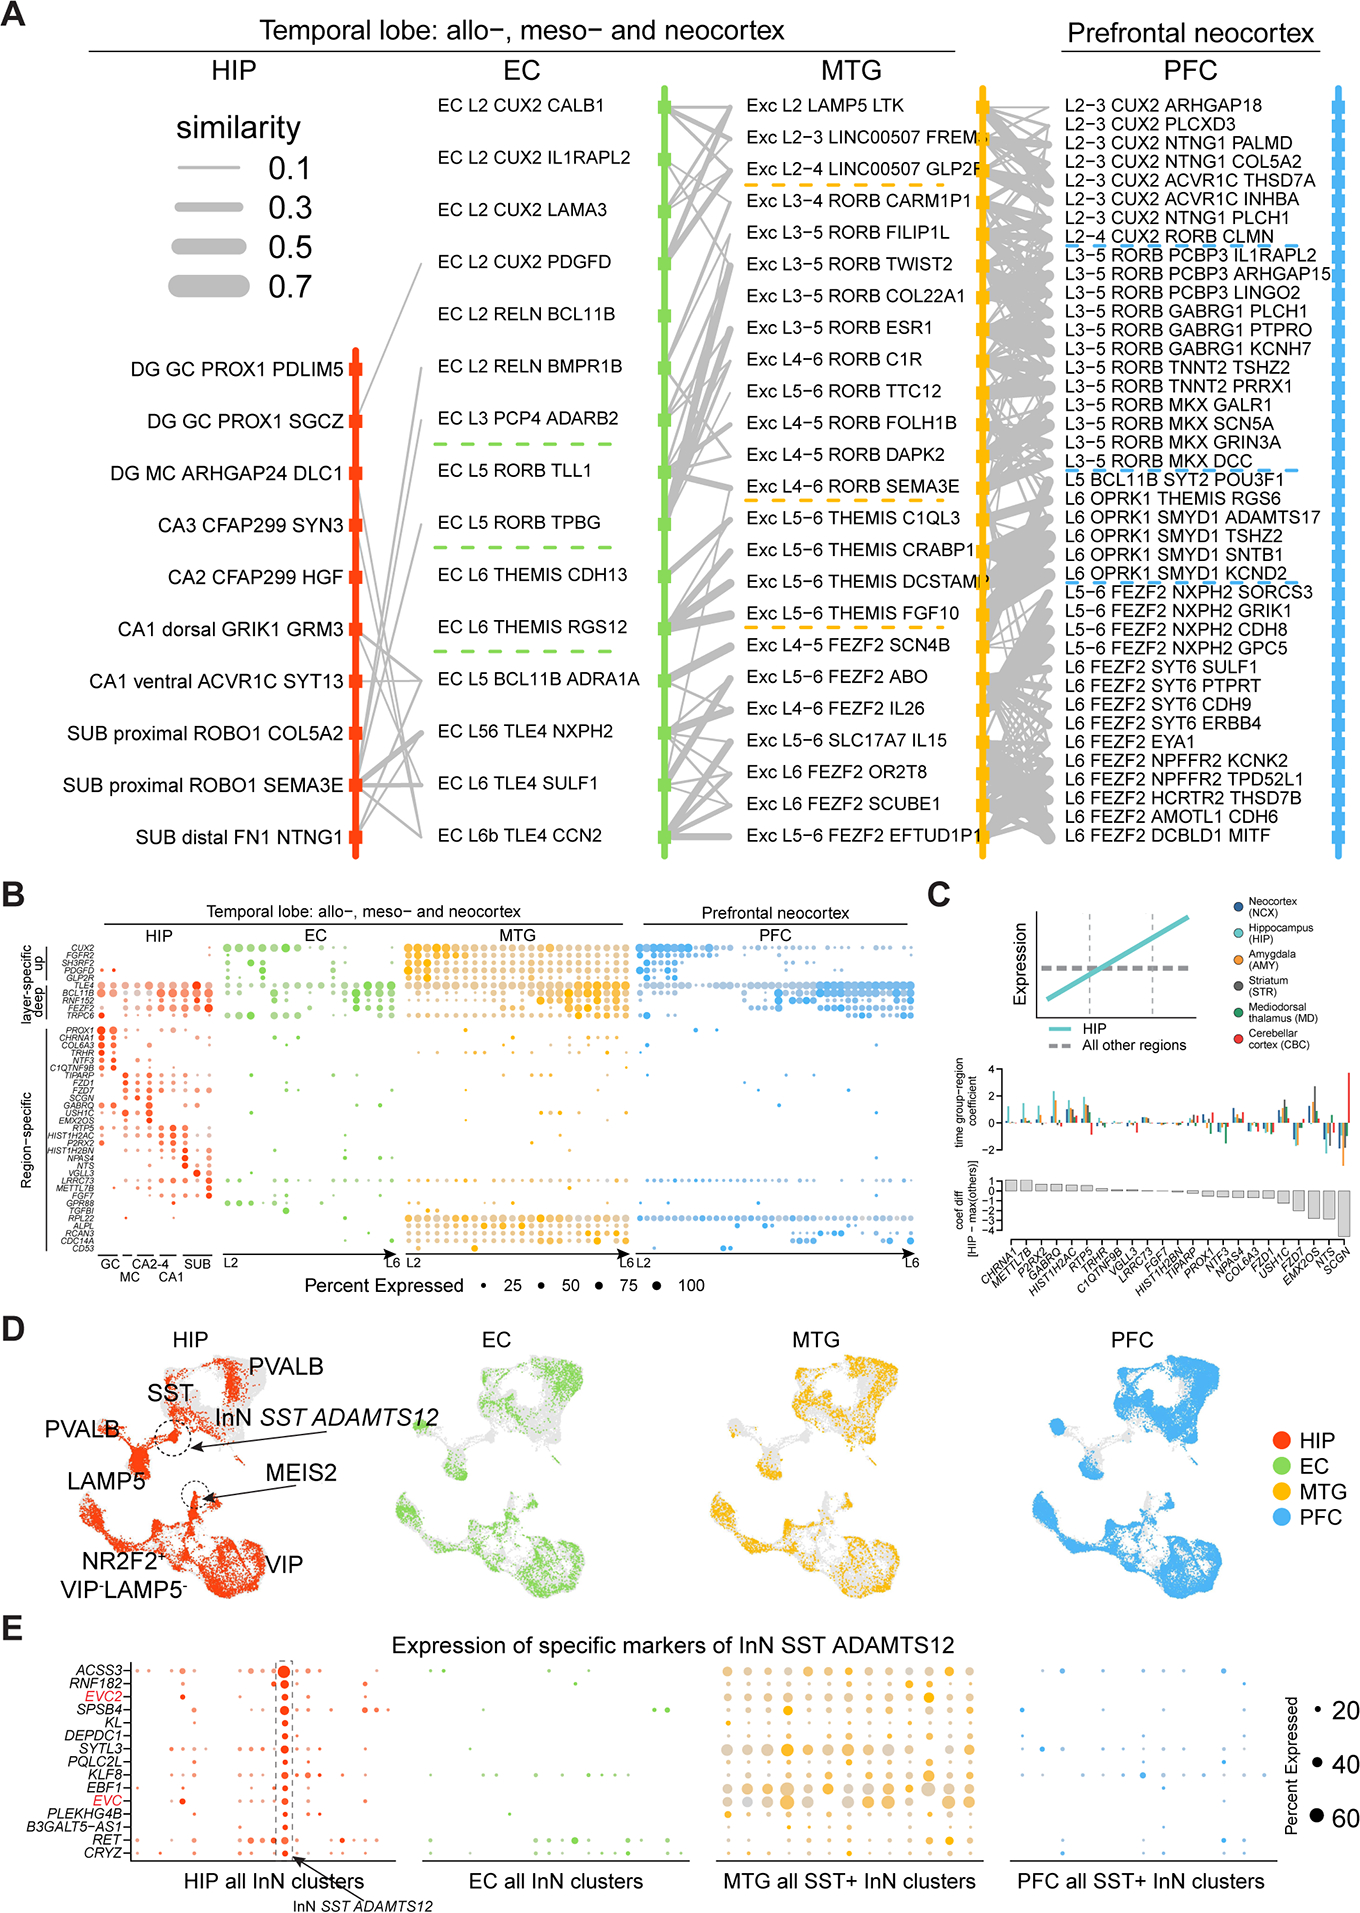
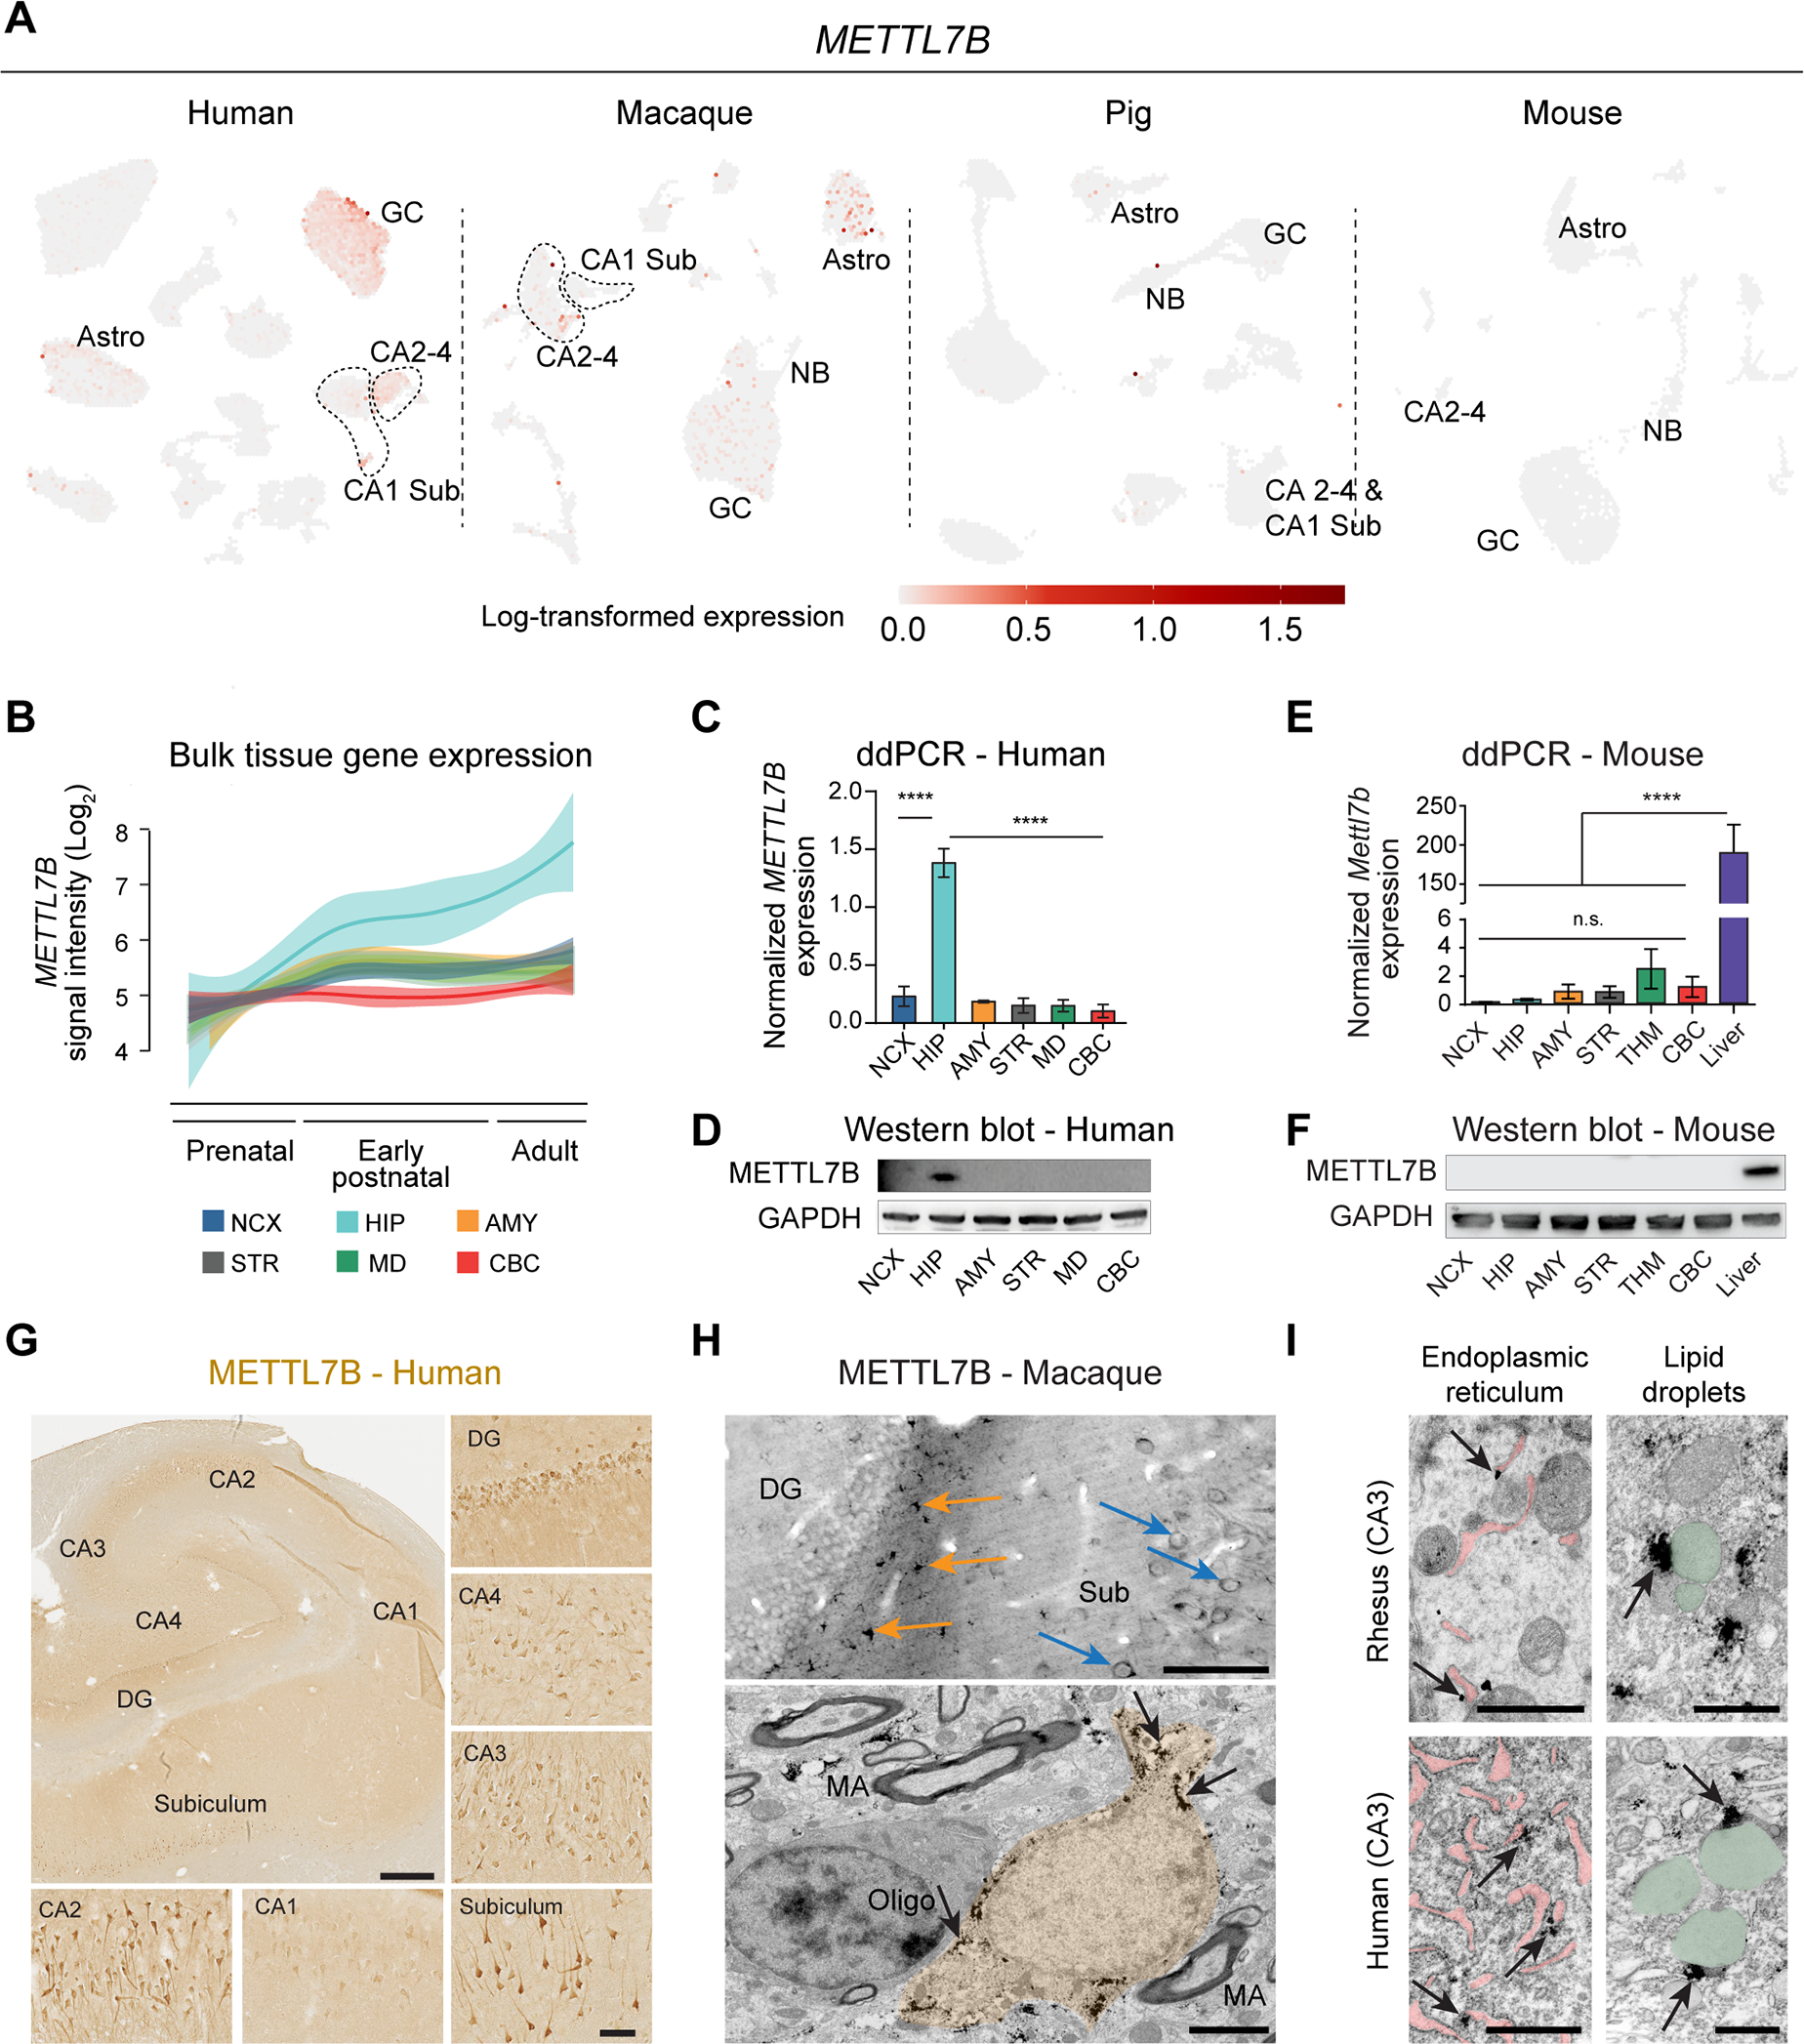
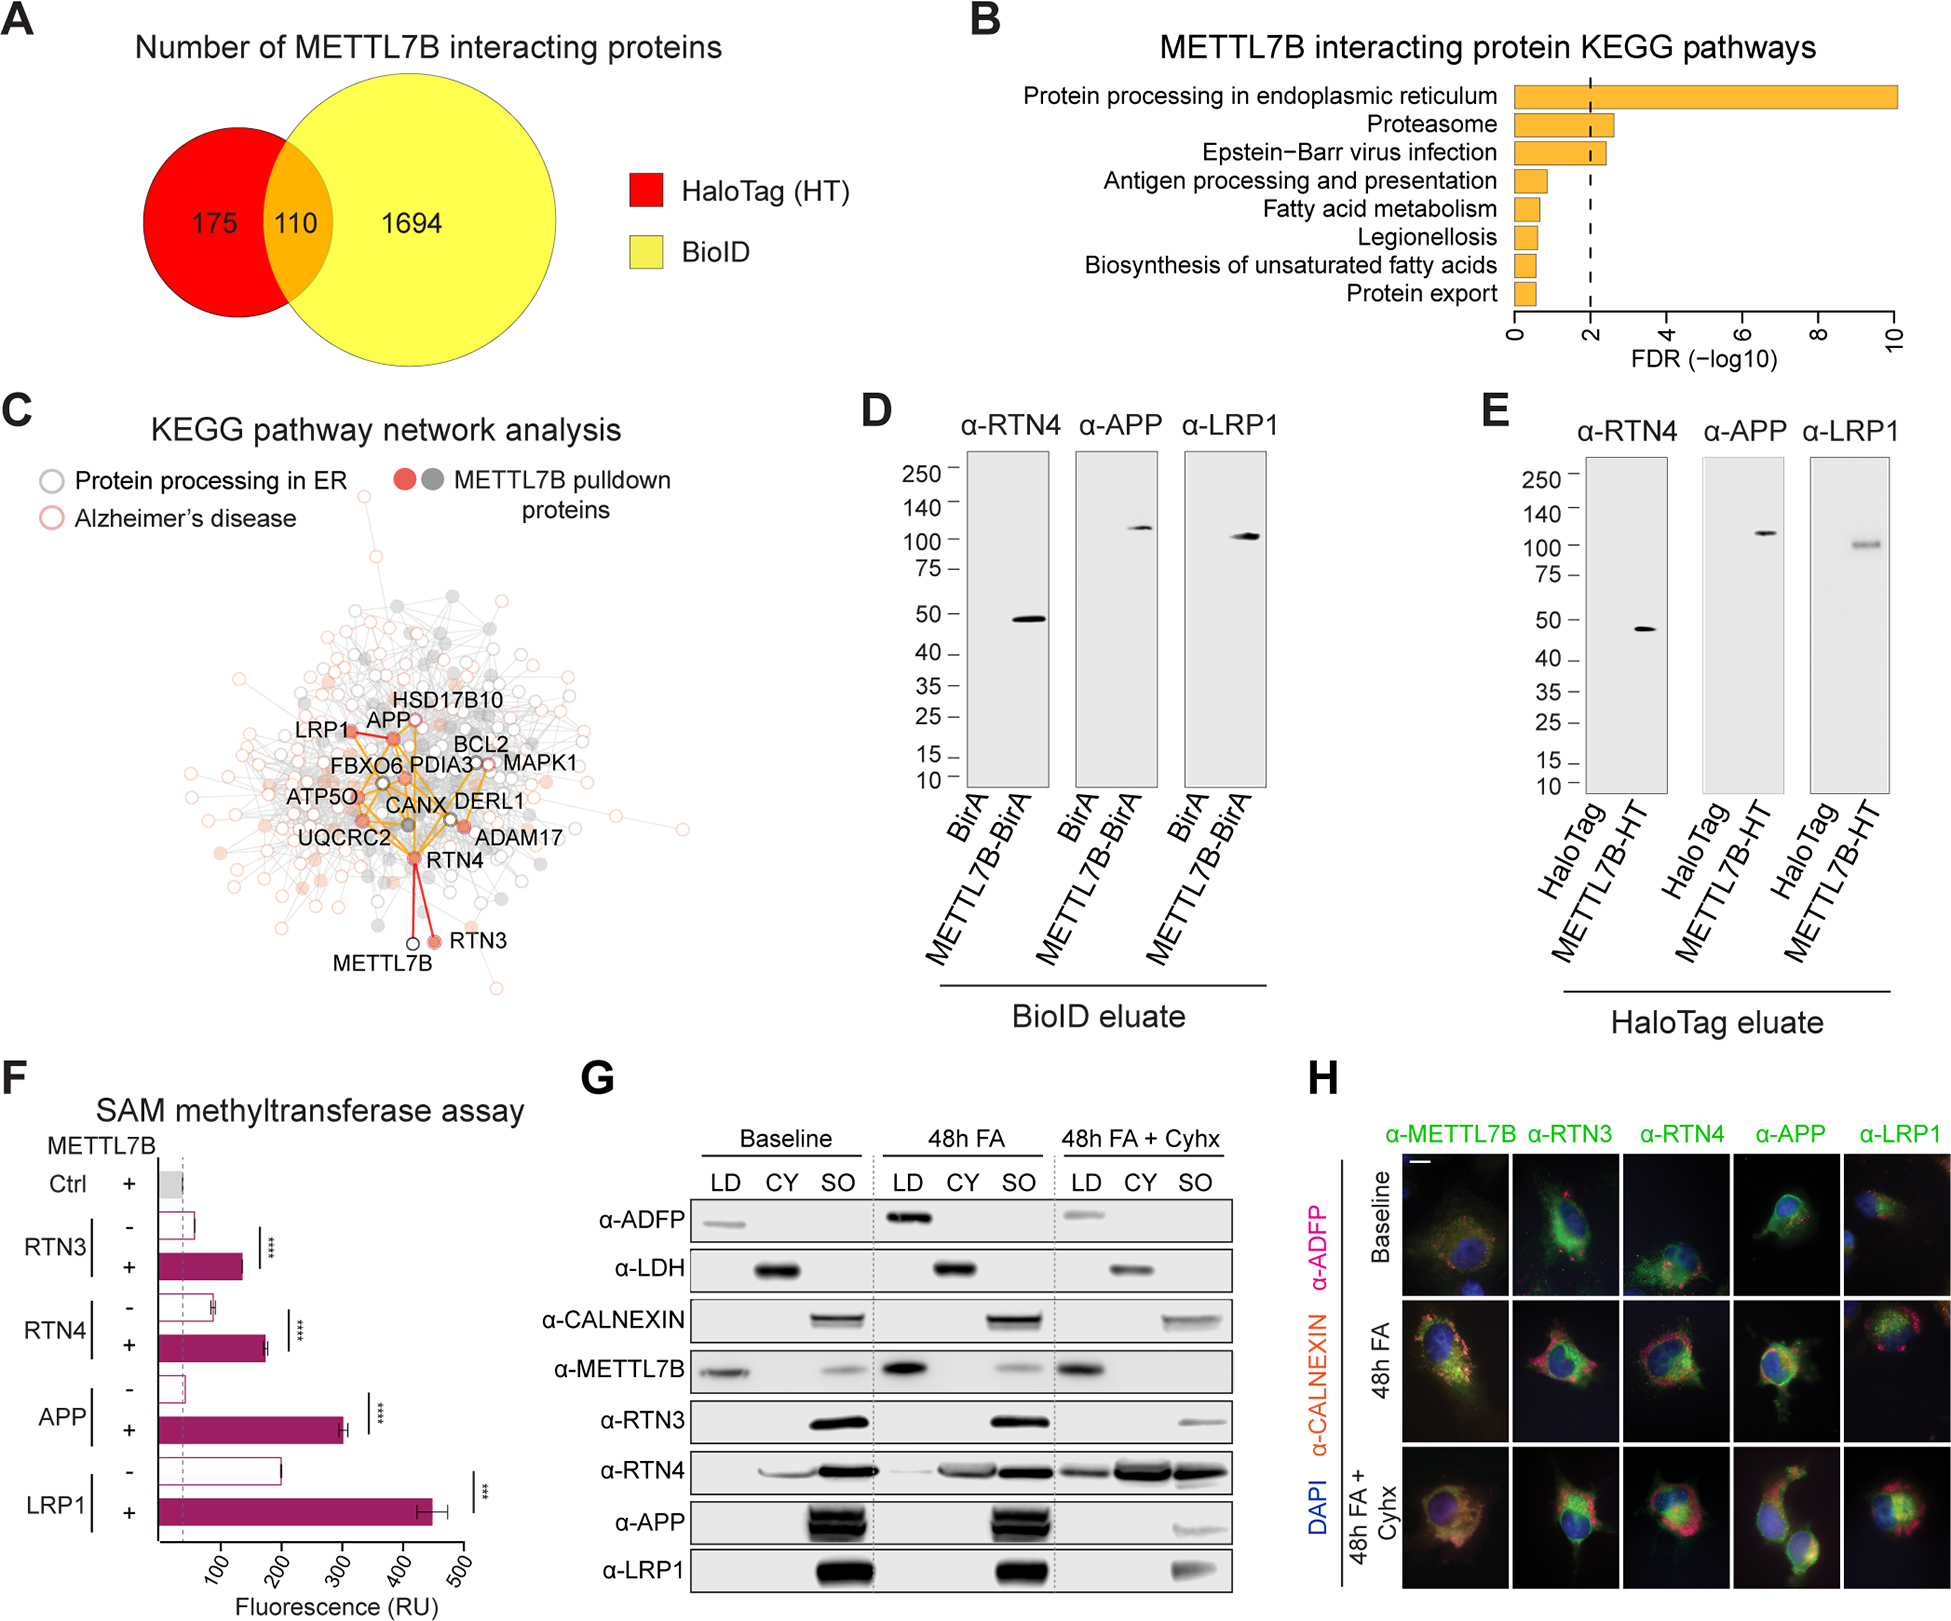
The hippocampal-entorhinal system supports cognitive functions, has lifelong neurogenic capabilities in many species, and is selectively vulnerable to Alzheimer's disease. To investigate neurogenic potential and cellular diversity, we profiled single-nucleus transcriptomes in five hippocampal-entorhinal subregions in humans, macaques, and pigs. Integrated cross-species analysis revealed robust transcriptomic and histologic signatures of neurogenesis in the adult mouse, pig, and macaque but not humans. Doublecortin (DCX), a widely accepted marker of newly generated granule cells, was detected in diverse human neurons, but it did not define immature neuron populations. To explore species differences in cellular diversity and implications for disease, we characterized subregion-specific, transcriptomically defined cell types and transitional changes from the three-layered archicortex to the six-layered neocortex. Notably, METTL7B defined subregion-specific excitatory neurons and astrocytes in primates, associated with endoplasmic reticulum and lipid droplet proteins, including Alzheimer's disease-related proteins. This resource reveals cell-type- and species-specific properties shaping hippocampal-entorhinal neurogenesis and function.

Keywords: Alzheimer’s disease; METTL7B; adult neurogenesis; doublecortin; entorhinal cortex; evolution; hippocampus; immature neurons; neuroblast; single-cell RNA-seq.


Conflict of interest statement

Declaration of interests The authors declare no competing interests.

Figures

Figure 1.
Figure 1.. Cell type diversity in the human hippocampal-entorhinal system revealed by snRNA-seq.
A, Schematic of the analytic workflow. B-D, UMAP visualization of all nuclei, colored by major cell types (B), subregions (C), and donors (D). E, Dendrogram depicting the hierarchical taxonomy across all cell subtypes. Bar plots show the number of nuclei, relative subregional and donor contributions, with coloring scheme conforming to panel B-D. Dot plot shows the expression of marker genes. GC, granule cell; MC, mossy cell; Astro, astrocyte; OPC, oligodendrocyte precursor cell; COP, committed OPC; Oligo, oligodendrocyte; Micro, microglia; Macro, macrophage; Myeloid, myeloid cell; T, T cell; aEndo, arterial endothelial cell; PC, pericyte; vSMC, venous smooth muscle cell; aSMC, arterial smooth muscle cell; VLMC, vascular and leptomeningeal cell. See also Figure S1.
Figure 2.
Figure 2.. Cross-species analysis of transcriptomic signatures of adult neurogenic trajectories.
A-B, Seurat integration of all DG cells (A) or only astrocytes and the granule cell lineage (B) across species. In B, arrows indicate the direction and speed (arrow length) of the RNA velocity. C, Expression of cluster markers across species. The categories “progenitor” and “neuroblast” were manually annotated (Hochgerner et al., 2018; Berg et al., 2019). Middle: Dot plot depicting the expression of the markers with dots colored by species. Bottom: Marker expression in the 20 human cells residing in the nIPC and neuroblast domain as well as the randomly sampled human granule cells. The first two rows highlighted by arrows represent the two putative human neurogenic cells. RGL, radial-glia like cells; nIPC, neural intermediate progenitor cells; NB, neuroblasts. GC, granule cells; MC, mossy cells; CA2–4, CA2–4 ExN; CA1 Sub, CA1 and Sub ExN. See also Figure S2 and Tables S2.
Figure 3.
Figure 3.. Hippocampal DCX expression across species.
A, Top: The number (text label) and percentage (y axis) of cells expressing DCX. Middle: Average library size-normalized expression of DCX. Bottom: DCX expression on UMAP with insets highlighting the neuroblast domain. B, Cell type proportions of DCX-expressing cells across species. C, Enrichment of different set of neuroblast markers in DCX+ compared to DCX− cells. Significance was tested using one-tailed Wilcoxon rank sum test (**: p < 0.01, ns: not significant). D, Images of the mouse, pig, macaque and human DG immunolabeled against DCX. Scale bar represents 50 μm in mouse, pig and macaque and 75 μm in human. E, Colocalization of DCX and GAD1 in cells with InN morphology in the molecular layer of the human DG. Scale bar is 30 μm. GCL, granular cell layer; ML, molecular layer. Other abbreviations conform to Figure 2. See also Figure S3 and Table S3.
Figure 4.
Figure 4.. Transcriptomic similarities and differences of hippocampal, entorhinal and neocortical cell types.
A, Left: UMAP showing all ExN nuclei colored by subtypes (left) or regions (right). B, Network demonstrating the extent of transcriptome similarities among ExN subtypes of HIP, EC, MTG (Hodge et al., 2019) and dlPFC (Li et al., 2018). Dots represent the subtypes within each brain region and the widths of lines represent the strength of similarity. Subtypes with regional-specificity were outlined in corresponding colors. C-F, As in panels A-B, for InN (C, D) and NNC (E, F). GC, granule cell; MC, mossy cell; CA2–4, CA2–4 ExN; CA1, CA1 ExN; Sub, Sub ExN; Astro, astrocyte; OPC, oligodendrocyte precursor cell; COP, committed OPC; Oligo, oligodendrocyte; Micro, microglia; Vas, vascular cells.
Figure 5.
Figure 5.. Taxonomic relationships of cell types across allo-, meso- and neo-cortex.
A, Transcriptomic relations across subtypes of pairwise regions organized according to layer distributions. Broad layer distinction was marked by dotted lines. B, Expression of neocortical upper-layer and deep-layer markers, as well as region-specific genes. C, Rank of the hippocampus-specific genes based on their temporal specificity in adult hippocampus using PsychENCODE data (Li et al., 2018). Top: Coefficients of time group-region with large positive values indicating upregulation along development (illustrated in the diagram). Bottom: Differences of the time group-region coefficients between HIP and the maximum of other regions. D, Integration of InN from 4 regions. Grey dots denote cells from other regions. E, Expression of the exclusive markers (rows) of the cluster ‘InN SST ADAMTS12’ across all InN subtypes (columns) in HIP and EC, and all SST+ InN subtypes (columns) in MTG and dlPFC. See also Figure S4.
Figure 6.
Figure 6.. METTL7B defines subregion-specific excitatory neurons and astrocytes in primates.
A, METTL7B expression in adult human HIP-EC, macaque DG, pig HIP and mouse DG. B, Expression of METTL7B showing temporal specificity in adult human hippocampus (Kang et al., 2011). C-D, Droplet digital PCR and immunoblot validation in six regions of adult human brain. One-way ANOVA with post-hoc Dunnett’s adjustment (****P<0.0001), N=3 per group. E-F, Same as (C) and (D) using mouse tissues, including liver as a positive control. G, METTL7B immunostaining of adult human hippocampus. Scale bars = 1 mm; insets = 100 μm; immunofluorescence = 10 μm. H, Upper panel: Numerous METTL7B Immunopositive astrocytes (orange arrows) and neurons (blue arrows). Bottom panel: Immunoelectron microscopy of astrocytes (orange; pointed with arrows). Scale bar is 100 μm (upper) and 2 μm (bottom). MA, myelinated axon. I, Immuno-electron microscopy CA3 hippocampal pyramidal neurons in rhesus macaque and human. Notice METTL7B labeling (arrows) on the outer surface of ER cisterns (pink) and in contact with LDs (green). Scale bar is 1μm for each panel. See also Figure S5.
Figure 7.
Figure 7.. METTL7B-interacting proteins are enriched in the endoplasmic reticulum and lipid droplets.
A, Venn diagram of high-confidence METTL7B interacting proteins revealed by HaloTag and BioID. B, KEGG enrichment of METTL7B interacting proteins from the intersection of HaloTag and BioID. C, Interaction network with proteins in KEGG Protein Processing in the ER pathway (grey) and Alzheimer’s disease pathway (orange). METTL7B interactors are shown as filled circles. D-E, Immunoblot confirmation of top interacting candidates. The molecular weight of the RTN4-immunoreactive band is consistent with a known proteolytic fragment of RTN4A or RTN4B (Kim et al., 2003; Sekine et al., 2020). F, SAM methyltransferase activity assay showing an increased reactivity in the presence of METTL7B. P-values calculated by unpaired two-tailed Student’s t test, N=3. G-H, Immunoanalysis of METTL7B translocation. Increased fatty acid (FA) load leads to a shift of METTL7B from ER to lipid droplets (LDs), while high confidence interactors remain unaffected. Blocking translation of new proteins with cycloheximide (Cyhx) suggests a complete shift of METTL7B. Scale bar = 10 μm. CY = cytosol; SO = sedimented organelle (containing the ER). All data are mean ± SEM. ****P< 0.0001, ***P< 0.001. See also Figures S6, S7, and Tables S4.

Comment in

References

    1. Abbott LC, and Nigussie F (2020). Adult neurogenesis in the mammalian dentate gyrus. Anat Histol Embryol 49, 3–16. - PubMed
    1. Abul-Husn NS, Bushlin I, Moron JA, Jenkins SL, Dolios G, Wang R, Iyengar R, Ma’ayan A, and Devi LA (2009). Systems approach to explore components and interactions in the presynapse. Proteomics 9, 3303–3315. - PMC - PubMed
    1. Aibar S, Gonzalez-Blas CB, Moerman T, Huynh-Thu VA, Imrichova H, Hulselmans G, Rambow F, Marine JC, Geurts P, Aerts J, et al. (2017). SCENIC: single-cell regulatory network inference and clustering. Nat Methods 14, 1083–1086. - PMC - PubMed
    1. Andersen P (2007). The hippocampus book (Oxford; New York: Oxford University Press; ).
    1. Angata K, Suzuki M, and Fukuda M (2002). ST8Sia II and ST8Sia IV polysialyltransferases exhibit marked differences in utilizing various acceptors containing oligosialic acid and short polysialic acid. The basis for cooperative polysialylation by two enzymes. J Biol Chem 277, 36808–36817. - PubMed

Publication types

Substances