. 2022 Aug;18(8):1752-1762.
doi: 10.1080/15548627.2021.1997052. Epub 2021 Nov 19.

AMBRA1 regulates mitophagy by interacting with ATAD3A and promoting PINK1 stability

Affiliations

AMBRA1 regulates mitophagy by interacting with ATAD3A and promoting PINK1 stability

Martina Di Rienzo et al. Autophagy. 2022 Aug.

Abstract

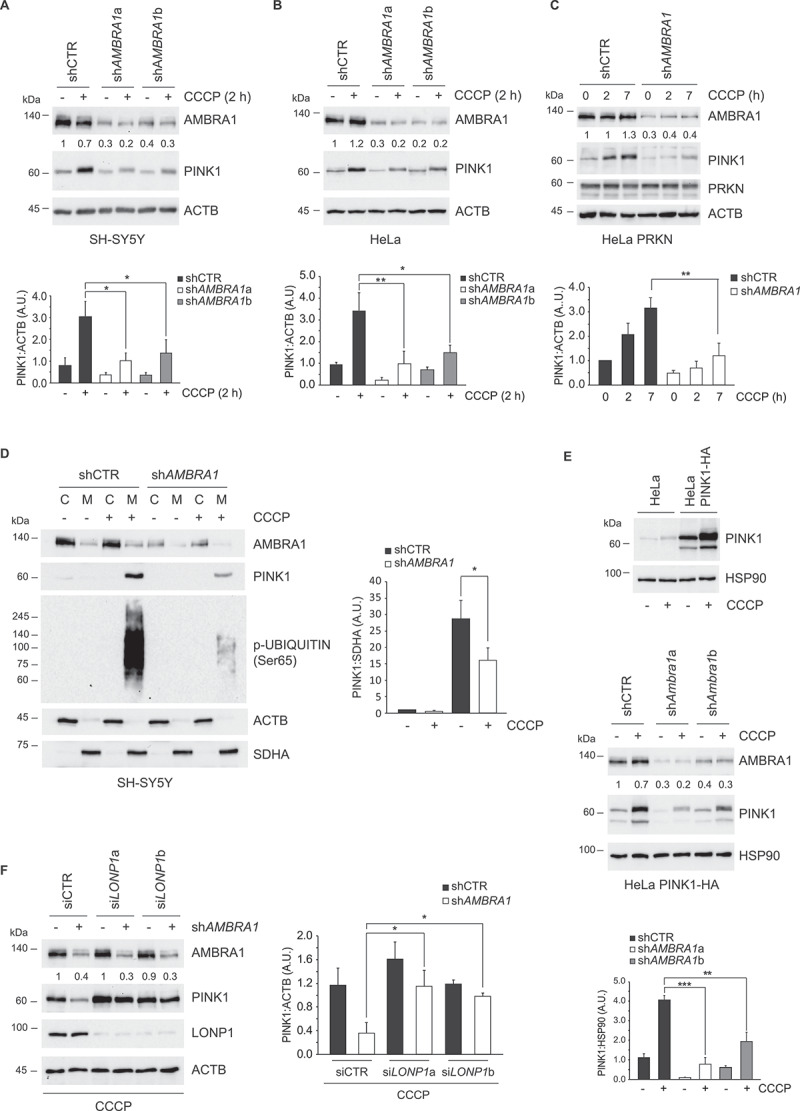
PINK1 accumulation at the outer mitochondrial membrane (OMM) is a key event required to signal depolarized mitochondria to the autophagy machinery. How this early step is, in turn, modulated by autophagy proteins remains less characterized. Here, we show that, upon mitochondrial depolarization, the proautophagic protein AMBRA1 is recruited to the OMM and interacts with PINK1 and ATAD3A, a transmembrane protein that mediates mitochondrial import and degradation of PINK1. Downregulation of AMBRA1 expression results in reduced levels of PINK1 due to its enhanced degradation by the mitochondrial protease LONP1, which leads to a decrease in PINK1-mediated ubiquitin phosphorylation and mitochondrial PRKN/PARKIN recruitment. Notably, ATAD3A silencing rescues defective PINK1 accumulation in AMBRA1-deficient cells upon mitochondrial damage. Overall, our findings underline an upstream contribution of AMBRA1 in the control of PINK1-PRKN mitophagy by interacting with ATAD3A and promoting PINK1 stability. This novel regulatory element may account for changes of PINK1 levels in neuropathological conditions.Abbreviations: ACTB/β-actin: actin beta; AMBRA1: autophagy and beclin 1 regulator 1; ATAD3A: ATPase family AAA domain containing 3A; BCL2L1/BCL-xL: BCL2 like 1; CCCP: carbonyl cyanide m-chlorophenyl hydrazone; MAP1LC3/LC3: microtubule associated protein 1 light chain 3; OMA1: OMA1 zinc metallopeptidase; OMM: outer mitochondrial membrane; PARL: presenilin associated rhomboid like; PARP: poly(ADP-ribose) polymerase; PD: Parkinson disease; PINK1: PTEN induced kinase 1; PRKN/PARKIN: parkin RBR E3 ubiquitin protein ligase; SDHA: succinate dehydrogenase complex flavoprotein subunit A; TOMM70: translocase of outer mitochondrial membrane 70.

Keywords: Autophagy; LONP1; PRKN/PARKIN; TOMM complex; ubiquitin phosphorylation.


Conflict of interest statement

The authors declare no competing interests.

Figures

Figure 1.
Figure 1.
AMBRA1 is required for an efficient activation of PINK1-PRKN signaling upon mitochondrial damage by CCCP. (A) Control shRNA, shAMBRA1a and shAMBRA1b SH-SY5Y cells (left panels) and control shRNA, shAMBRA1a and shAMBRA1b HeLa cells (right panels) were treated with CCCP for 2 h or left untreated. Phospho-UBIQUITIN (Ser65), UBIQUITIN and AMBRA1 levels were analyzed by immunoblotting. HSP90 was included as a loading control. (B) Mitochondrial fractions from control shRNA and shAMBRA1 SH-SY5Y cells were isolated as described in Methods and lysed in RIPA buffer. PRKN and AMBRA1 levels were analyzed by immunoblotting. OXPHOS-II SDHA and ACTB levels were included as markers of mitochondrial (M) and cytosol (C) fractions, respectively (upper). The graph (lower) reports means ± SD of PRKN:OXPHOS-II SDHA values of mitochondrial fractions from three independent experiments; *P < 0.05. A.U.: Arbitrary Units. (C) Control shRNA and shAMBRA1 SH-SY5Y cells were treated with CCCP for 2 h or left untreated. One hour before lysis, cells were incubated with the lysosome inhibitors bafilomycin A1, as indicated. LC3 levels were analyzed by immunoblotting (left). HSP90 was included as a loading control. The graph (right) reports means ± SD of LC3-II:HSP90 values from three independent experiments; *P < 0.05. A.U.: Arbitrary Units. (D) Control shRNA and shAMBRA1 SH-SY5Y cells were treated with CCCP for 16 h or left untreated. PARP and AMBRA1 levels were analyzed by immunoblotting. F.L.: Full Length. ACTB was included as a loading control (upper). The graph (lower) reports means ± SD of PARP CLEAVED:ACTB values from three independent experiments; ** P < 0.01. A.U.: Arbitrary Units.
Figure 2.
Figure 2.
Impaired stabilization of PINK1 protein in AMBRA1-downregulated cells. (A-C) SH-SY5Y (A), HeLa (B) and PRKN-overexpressing HeLa (C) cells were transduced with control shRNA or shAMBRA1 and treated with CCCP as indicated (h: hours), or left untreated. PINK1 and AMBRA1 levels were analyzed by immunoblotting. ACTB or HSP90 were included as loading controls. The accompanying graphs report means ± SD of normalized PINK1 values from three independent experiments; *P < 0.05, **P < 0.01. A.U.: Arbitrary Units. Densitometric analysis of AMBRA1 levels is reported below the corresponding panels. (D) Mitochondrial fractions from control shRNA and shAMBRA1 SH-SY5Y cells were isolated as described in methods and lysed in RIPA buffer. PINK1, phospho-UBIQUITIN (Ser65) and AMBRA1 levels were analyzed by immunoblotting. OXPHOS-II SDHA and ACTB levels were included as markers of mitochondrial (M) and cytosol (C) fractions, respectively (left). The graph (right) reports means ± SD of PRKN: SDHA values of mitochondrial fractions from three independent experiments; *P < 0.05. A.U.: Arbitrary Units. (E) HeLa cells were transduced with a lentivirus encoding for PINK1-HA and overexpression monitored by immunoblotting (upper panel). PINK1-HA overexpressing HeLa cells were transduced with control shRNA or shAMBRA1 and treated with CCCP for 2 h or left untreated. PINK1 and AMBRA1 levels were analyzed by immunoblotting (middle panel). HSP90 was included as a loading control. The accompanying graph reports means ± SD of PINK1:HSP90 values from three independent experiments; ** P < 0.01, *** P < 0.001 (lower panel). A.U.: Arbitrary Units. Densitometric analysis of AMBRA1 levels is reported below the corresponding panels. (F) Control shRNA and shAMBRA1a HeLa cells were transiently transfected with LONP1a, LONP1b siRNA or a scramble control siRNA, as indicated. 48 hours after transfection, cells were treated with CCCP for 2 h. PINK1 and AMBRA1 levels were analyzed by immunoblotting. ACTB was included as a loading control (left). The graph (right) reports means ± SD of PINK1:ACTB values from three independent experiments; *P < 0.05. A.U.: Arbitrary Units. Densitometric analysis of AMBRA1 levels is reported below the corresponding panels.
Figure 3.
Figure 3.
AMBRA1 associates to PINK1 and TOMM70 at the outer mitochondrial membrane upon mitochondria depolarization. (A) SH-SY5Y were treated with CCCP for 2 h and subjected to immunoprecipitation using an anti-PINK1 antibody. Immunopurified complexes were analyzed by immunoblotting using anti-AMBRA1 and anti-PINK1 antibodies. (B) SH-SY5Y cells were treated with CCCP for 2 h. Mitochondrial fractions, obtained as described in Methods, were subjected to a Proteinase K protection assay and AMBRA1 levels were analyzed by immunoblotting. TOMM20 and SDHA levels were included as markers of inner and outer mitochondrial proteins respectively. (C) SH-SY5Y cells were treated with CCCP for 1 or 2 h (h: hours) or left untreated. Mitochondrial fractions were purified and subjected to SDS-PAGE (upper) or Blue-Native assay (middle), respectively. PINK1 and AMBRA1 levels were analyzed by immunoblotting. SDHA and ACTB levels were included in the upper panel as markers of mitochondrial and cytosol fractions, respectively. The graph (lower) reports means ± SD of AMBRA1 levels in the Blue-Native assay from three independent experiments; *P < 0.05. A.U.: Arbitrary Units. (D) SH-SY5Y cells were treated with CCCP for 2 h or left untreated, lysed and subjected to immunoprecipitation using an anti-TOMM70 antibody. Immunopurified complexes were analyzed by immunoblotting using anti-AMBRA1 and anti-TOMM70 antibodies (left). The graph (right) reports means ± SD of AMBRA1 levels bound to TOMM70 from three independent experiments; *P < 0.05. A.U.: Arbitrary Units. (E) SH-SY5Y cells were treated with CCCP for 2 h or left untreated, lysed and subjected to immunoprecipitation using an anti-ATAD3A antibody. Immunopurified complexes were analyzed by immunoblotting using anti-AMBRA1 and anti-ATAD3A antibodies (left). The graph (right) reports means ± SD of AMBRA1 levels bound to TOMM70 from three independent experiments; *P < 0.05. A.U.: Arbitrary Units. (F) Control shRNA and shAMBRA1a HeLa cells were transiently transfected with ATAD3Aa, ATAD3Ab siRNA or a scramble control siRNA, as indicated. 48 h after transfection, cells were treated with CCCP for 2 h. PINK1 and AMBRA1 levels were analyzed by immunoblotting. ACTB was included as a loading control (left). The graph (right) reports means ± SD of PINK1:ACTB values from three independent experiments; *P < 0.05. Densitometric analysis of AMBRA1 levels is reported below the corresponding panel. A.U.: Arbitrary Units. (G) Scheme of the proposed role of AMBRA1 in PINK1 stabilization upon mitochondria damaged by CCCP (see the discussion section for details).

References

    1. Killackey SA, Philpott DJ, Girardin SE.. Mitophagy pathways in health and disease. J Cell Biol. 2020;219. DOI:10.1083/jcb.202004029 - DOI - PMC - PubMed
    1. Pickrell AM, Youle RJ. The roles of PINK1, parkin, and mitochondrial fidelity in Parkinson’s disease. Neuron. 2015;85:257–273. - PMC - PubMed
    1. Palikaras K, Lionaki E, Tavernarakis N. Mechanisms of mitophagy in cellular homeostasis, physiology and pathology. Nat Cell Biol. 2018;20:1013–1022. - PubMed
    1. Pickles S, Vigie P, Youle RJ. Mitophagy and quality control mechanisms in mitochondrial maintenance. Curr Biol. 2018;28:R170–R185. - PMC - PubMed
    1. Gatica D, Lahiri V, Klionsky DJ. Cargo recognition and degradation by selective autophagy. Nat Cell Biol. 2018;20:233–242. - PMC - PubMed

Publication types

MeSH terms

Substances