

CD4+ effector T cells accelerate Alzheimer's disease in mice
- PMID: 34798897
- PMCID: PMC8603581
- DOI: 10.1186/s12974-021-02308-7
CD4+ effector T cells accelerate Alzheimer's disease in mice
Abstract
Background: Alzheimer's disease (AD) is a progressive neurodegenerative disorder characterized by pathological deposition of misfolded self-protein amyloid beta (Aβ) which in kind facilitates tau aggregation and neurodegeneration. Neuroinflammation is accepted as a key disease driver caused by innate microglia activation. Recently, adaptive immune alterations have been uncovered that begin early and persist throughout the disease. How these occur and whether they can be harnessed to halt disease progress is unclear. We propose that self-antigens would induct autoreactive effector T cells (Teffs) that drive pro-inflammatory and neurodestructive immunity leading to cognitive impairments. Here, we investigated the role of effector immunity and how it could affect cellular-level disease pathobiology in an AD animal model.
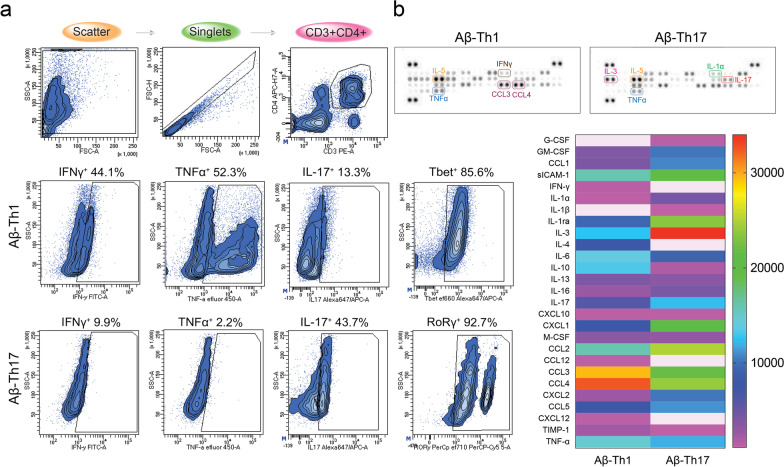
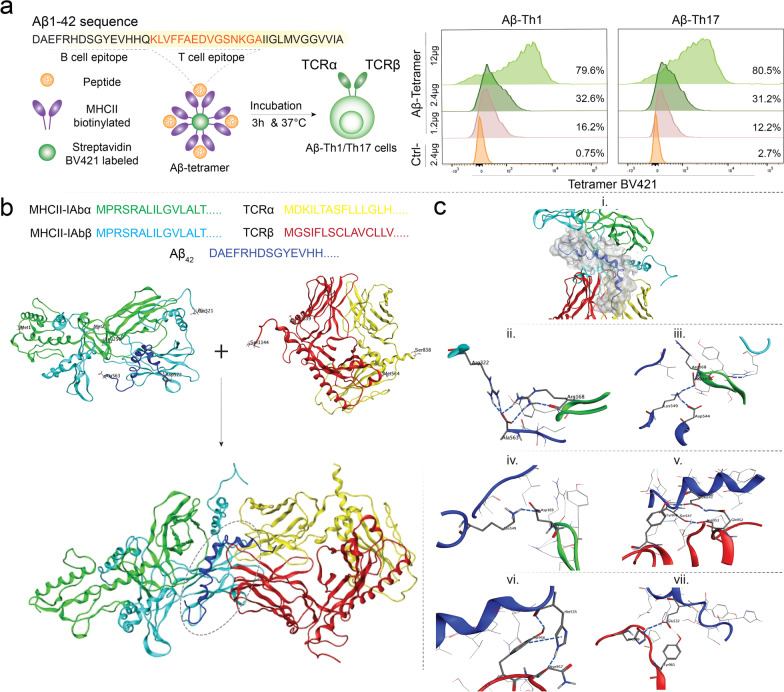
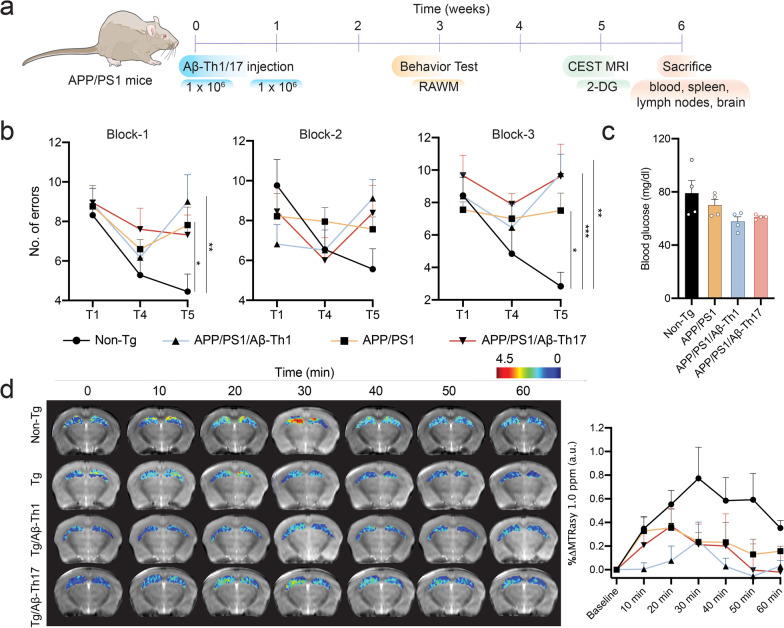
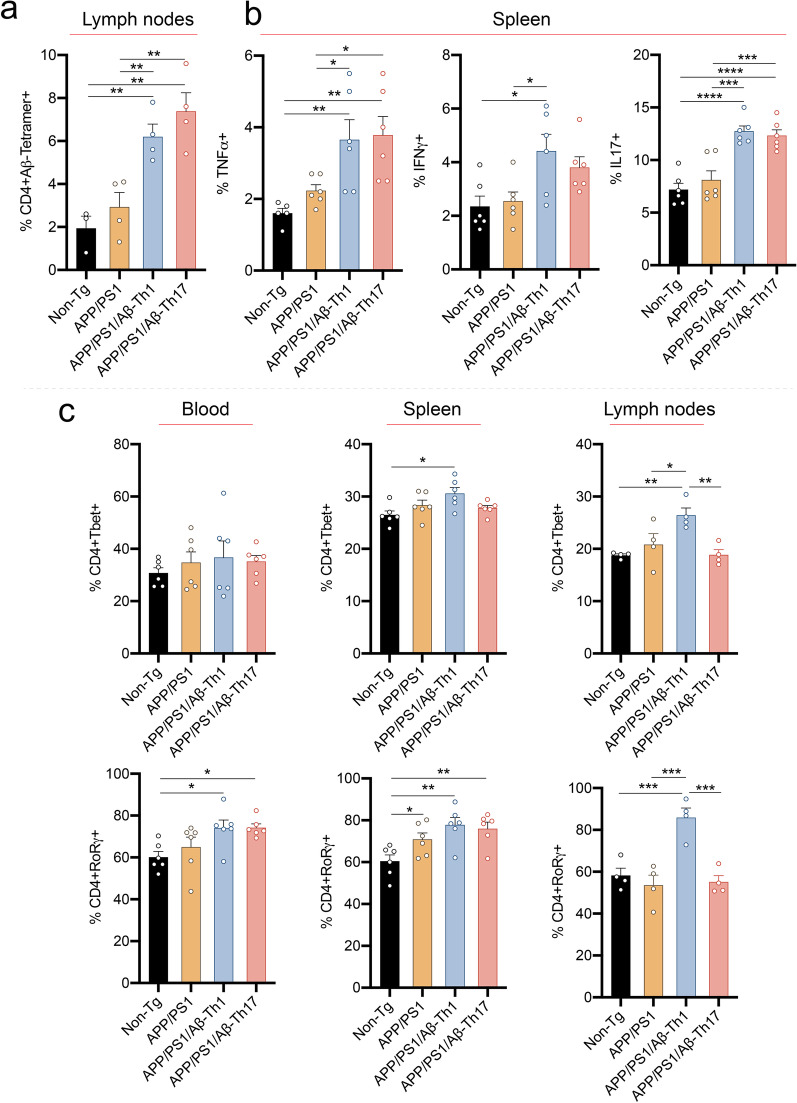
Methods: In this report, we developed and characterized cloned lines of amyloid beta (Aβ) reactive type 1 T helper (Th1) and type 17 Th (Th17) cells to study their role in AD pathogenesis. The cellular phenotype and antigen-specificity of Aβ-specific Th1 and Th17 clones were confirmed using flow cytometry, immunoblot staining and Aβ T cell epitope loaded haplotype-matched major histocompatibility complex II IAb (MHCII-IAb-KLVFFAEDVGSNKGA) tetramer binding. Aβ-Th1 and Aβ-Th17 clones were adoptively transferred into APP/PS1 double-transgenic mice expressing chimeric mouse/human amyloid precursor protein and mutant human presenilin 1, and the mice were assessed for memory impairments. Finally, blood, spleen, lymph nodes and brain were harvested for immunological, biochemical, and histological analyses.
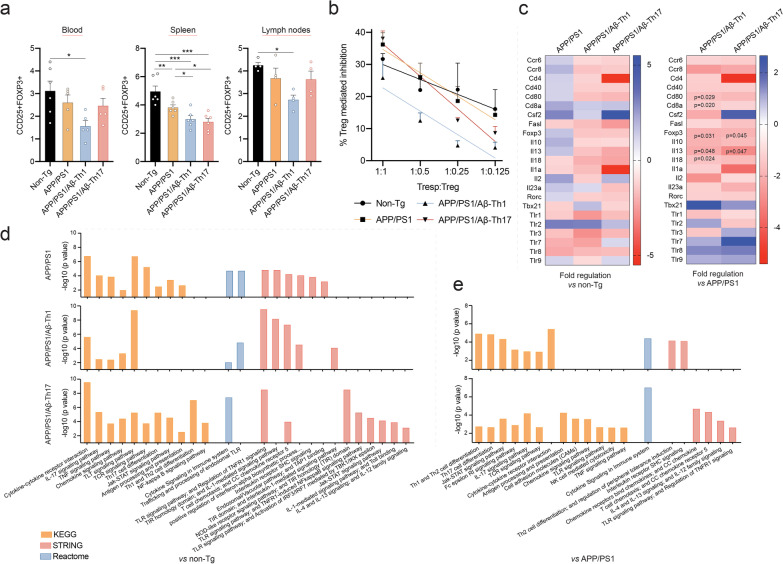
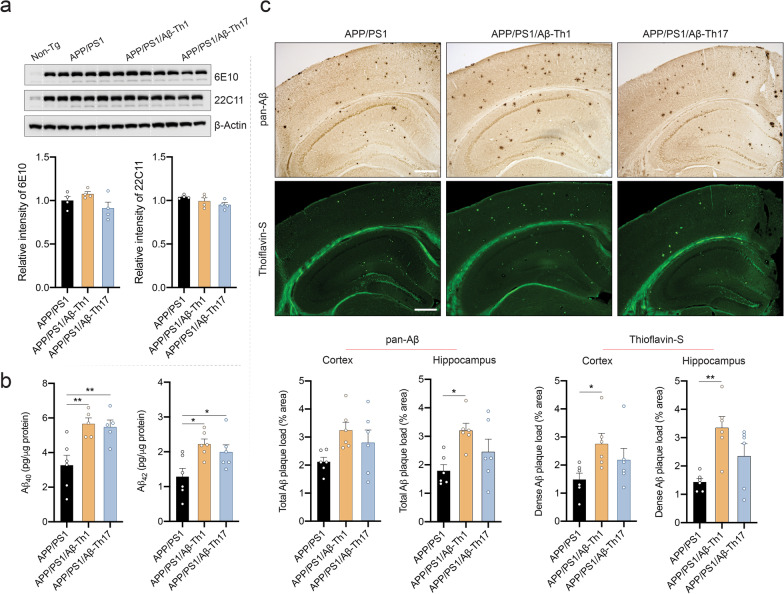
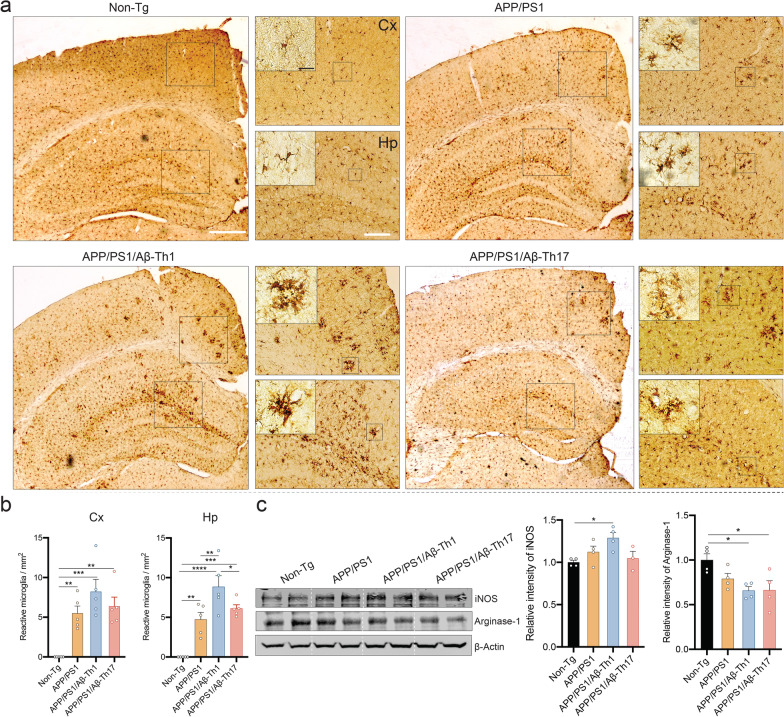
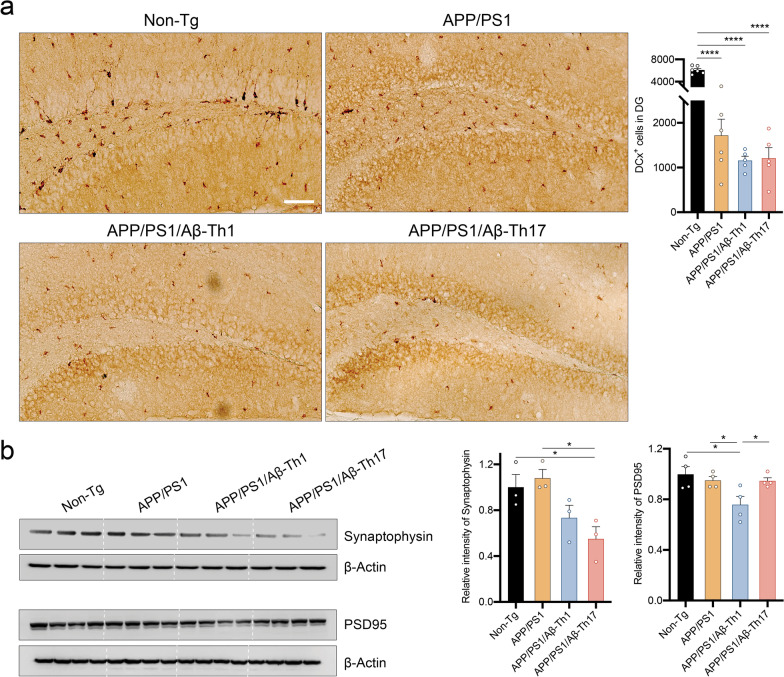
Results: The propagated Aβ-Th1 and Aβ-Th17 clones were confirmed stable and long-lived. Treatment of APP/PS1 mice with Aβ reactive Teffs accelerated memory impairment and systemic inflammation, increased amyloid burden, elevated microglia activation, and exacerbated neuroinflammation. Both Th1 and Th17 Aβ-reactive Teffs progressed AD pathology by downregulating anti-inflammatory and immunosuppressive regulatory T cells (Tregs) as recorded in the periphery and within the central nervous system.
Conclusions: These results underscore an important pathological role for CD4+ Teffs in AD progression. We posit that aberrant disease-associated effector T cell immune responses can be controlled. One solution is by Aβ reactive Tregs.
Keywords: APP/PS1 transgenic mice; Alzheimer’s disease (AD); Amyloid beta (Aβ); Effector T cell (Teff); Regulatory T cell (Treg); T cell.
© 2021. The Author(s).
Conflict of interest statement
J.M., P.Y., B.D.K., C.B.G., R.L.M., and H.E.G. are named inventors on provisional patent entitled “Cells therapy for Alzheimer’s disease” which is based upon the Aβ-targeting T cells developed in the present study (EFS ID: 42475225, Application number: 63175747, Docket number: 21084P). H.E.G is a member of the scientific advisory board at Longevity Biotech and a co-founder of Exavir Therapeutics, Inc. All other authors declare no conflict of interest.
Figures
Similar articles
-
IFN-γ Production by amyloid β-specific Th1 cells promotes microglial activation and increases plaque burden in a mouse model of Alzheimer's disease.J Immunol. 2013 Mar 1;190(5):2241-51. doi: 10.4049/jimmunol.1200947. Epub 2013 Jan 30. J Immunol. 2013. PMID: 23365075
-
Amyloid-β specific regulatory T cells attenuate Alzheimer's disease pathobiology in APP/PS1 mice.Mol Neurodegener. 2023 Dec 18;18(1):97. doi: 10.1186/s13024-023-00692-7. Mol Neurodegener. 2023. PMID: 38111016 Free PMC article.
-
Influenza vaccination in early Alzheimer's disease rescues amyloidosis and ameliorates cognitive deficits in APP/PS1 mice by inhibiting regulatory T cells.J Neuroinflammation. 2020 Feb 19;17(1):65. doi: 10.1186/s12974-020-01741-4. J Neuroinflammation. 2020. PMID: 32075657 Free PMC article.
-
Recent Advances in the Modeling of Alzheimer's Disease.Front Neurosci. 2022 Mar 31;16:807473. doi: 10.3389/fnins.2022.807473. eCollection 2022. Front Neurosci. 2022. PMID: 35431779 Free PMC article. Review.
-
Cognitive Impairment in Transgenic Mouse Models of Amyloid Deposition.In: Levin ED, Buccafusco JJ, editors. Animal Models of Cognitive Impairment. Boca Raton (FL): CRC Press/Taylor & Francis; 2006. Chapter 10. In: Levin ED, Buccafusco JJ, editors. Animal Models of Cognitive Impairment. Boca Raton (FL): CRC Press/Taylor & Francis; 2006. Chapter 10. PMID: 21204370 Free Books & Documents. Review.
Cited by
-
Immunological aspects of central neurodegeneration.Cell Discov. 2024 Apr 9;10(1):41. doi: 10.1038/s41421-024-00666-z. Cell Discov. 2024. PMID: 38594240 Free PMC article. Review.
-
APOE genotype and brain amyloid are associated with changes in the plasma proteome in elderly subjects without dementia.Ann Clin Transl Neurol. 2025 Feb;12(2):366-382. doi: 10.1002/acn3.52250. Epub 2024 Dec 17. Ann Clin Transl Neurol. 2025. PMID: 39689057 Free PMC article.
-
Hypertension promotes neuroinflammation, brain injury and cognitive impairment.Brain Behav Immun Health. 2025 Jul 10;48:101059. doi: 10.1016/j.bbih.2025.101059. eCollection 2025 Oct. Brain Behav Immun Health. 2025. PMID: 40697973 Free PMC article.
-
Systemic inflammation as a central player in the initiation and development of Alzheimer's disease.Immun Ageing. 2025 Aug 21;22(1):33. doi: 10.1186/s12979-025-00529-5. Immun Ageing. 2025. PMID: 40841660 Free PMC article. Review.
-
Integration of iPSC-Derived Microglia into Brain Organoids for Neurological Research.Int J Mol Sci. 2024 Mar 9;25(6):3148. doi: 10.3390/ijms25063148. Int J Mol Sci. 2024. PMID: 38542121 Free PMC article. Review.
References
-
- 2019 Alzheimer’s disease facts and figures. Alzheimer's Dementia. 2019;15:321–87.
-
- Machhi J, Prajapati N, Tripathi A, Parikh ZS, Kanhed AM, Patel K, Pillai PP, Giridhar R, Yadav MR. Synthesis and biological evaluation of novel multi-target-directed benzazepines against excitotoxicity. Mol Neurobiol. 2017;54:6697–6722. - PubMed
-
- Machhi J, Sinha A, Patel P, Kanhed AM, Upadhyay P, Tripathi A, Parikh ZS, Chruvattil R, Pillai PP, Gupta S, et al. Neuroprotective potential of novel multi-targeted isoalloxazine derivatives in rodent models of Alzheimer's disease through activation of canonical Wnt/beta-catenin signalling pathway. Neurotox Res. 2016;29:495–513. - PubMed
MeSH terms
Substances
Grants and funding
- R01 NS036126/NS/NINDS NIH HHS/United States
- P01 NS43985/NS/NINDS NIH HHS/United States
- P01 NS043985/NS/NINDS NIH HHS/United States
- P01 DA028555/DA/NIDA NIH HHS/United States
- T32 NS105594/NS/NINDS NIH HHS/United States
- R01 MH121402/MH/NIMH NIH HHS/United States
- P01 MH064570/MH/NIMH NIH HHS/United States
- R01 AG043540/AG/NIA NIH HHS/United States
- R01 NS034239/NS/NINDS NIH HHS/United States
- P01 NS31492/NS/NINDS NIH HHS/United States
- P30 MH062261/MH/NIMH NIH HHS/United States
- 2R01 NS034239/NS/NINDS NIH HHS/United States
- R01 NS36126/NS/NINDS NIH HHS/United States
- P01 MH64570/MH/NIMH NIH HHS/United States
- P01 NS031492/NS/NINDS NIH HHS/United States
LinkOut - more resources
Full Text Sources
Other Literature Sources
Medical
Molecular Biology Databases
Research Materials
