. 2022 Jan;10(1):56-69.
doi: 10.1158/2326-6066.CIR-21-0407. Epub 2021 Nov 19.

B7-H3 Suppresses Antitumor Immunity via the CCL2-CCR2-M2 Macrophage Axis and Contributes to Ovarian Cancer Progression

Affiliations

B7-H3 Suppresses Antitumor Immunity via the CCL2-CCR2-M2 Macrophage Axis and Contributes to Ovarian Cancer Progression

Taito Miyamoto et al. Cancer Immunol Res. 2022 Jan.

Abstract

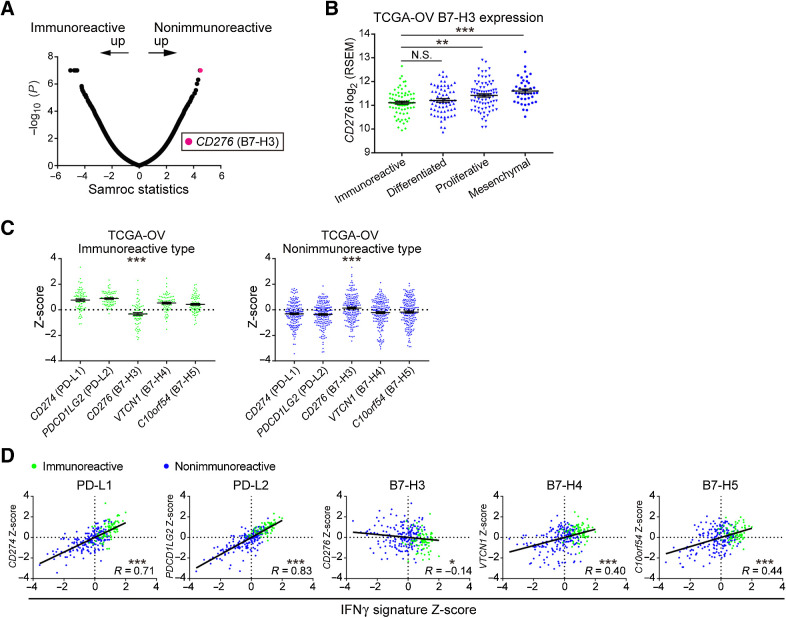
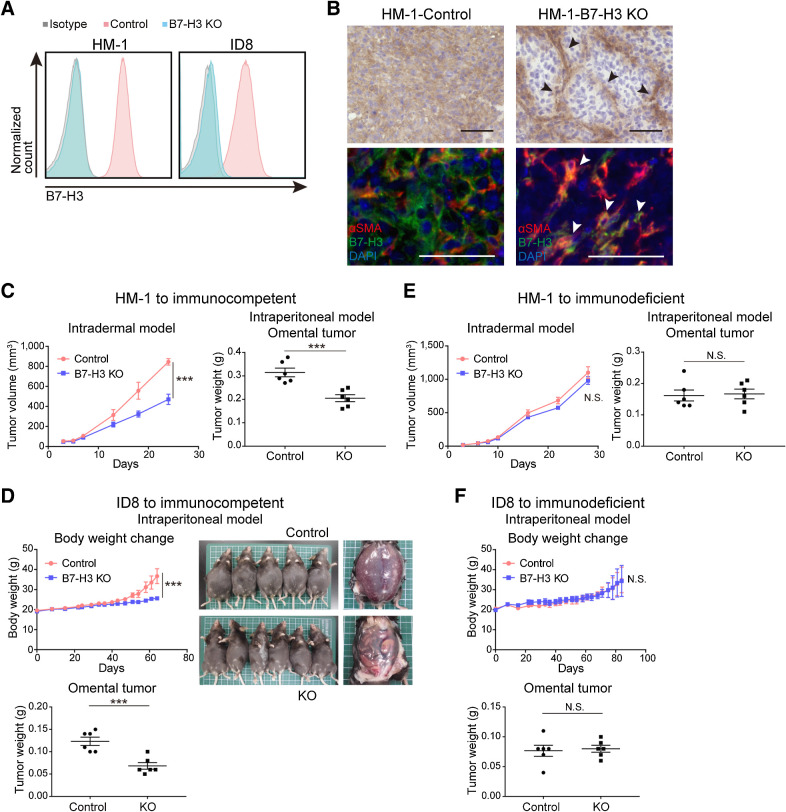
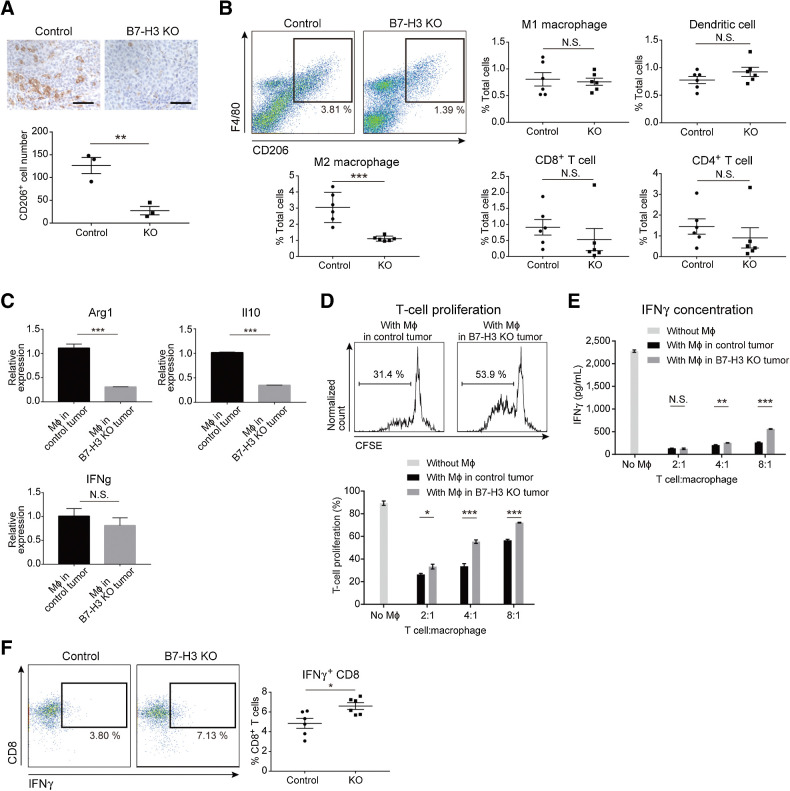
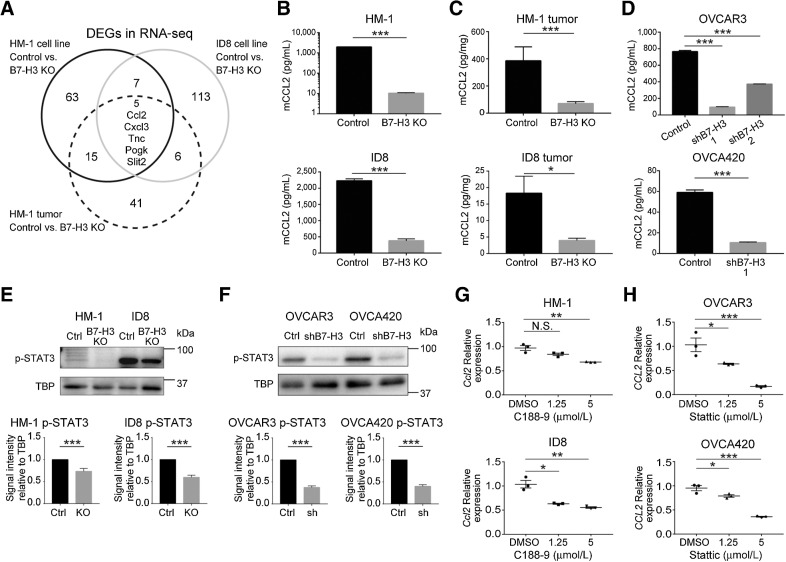
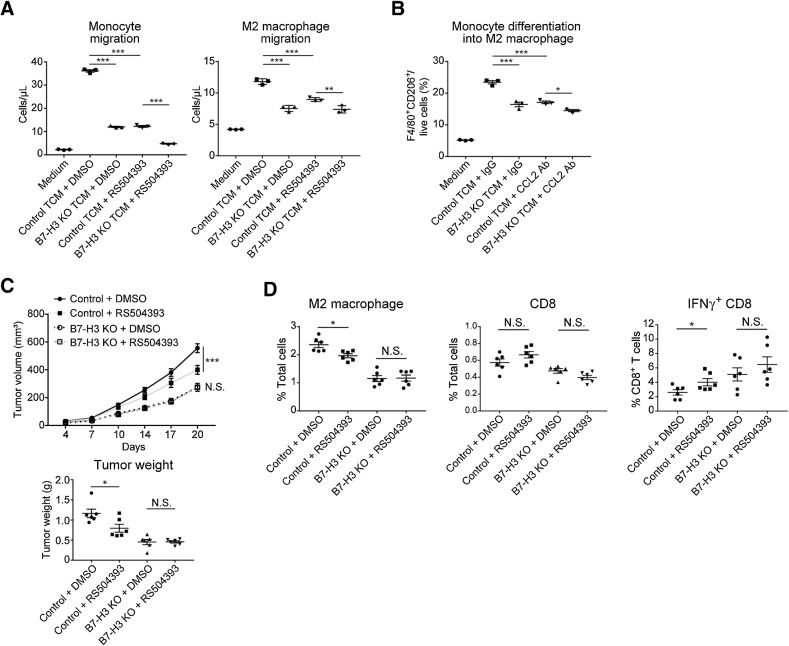
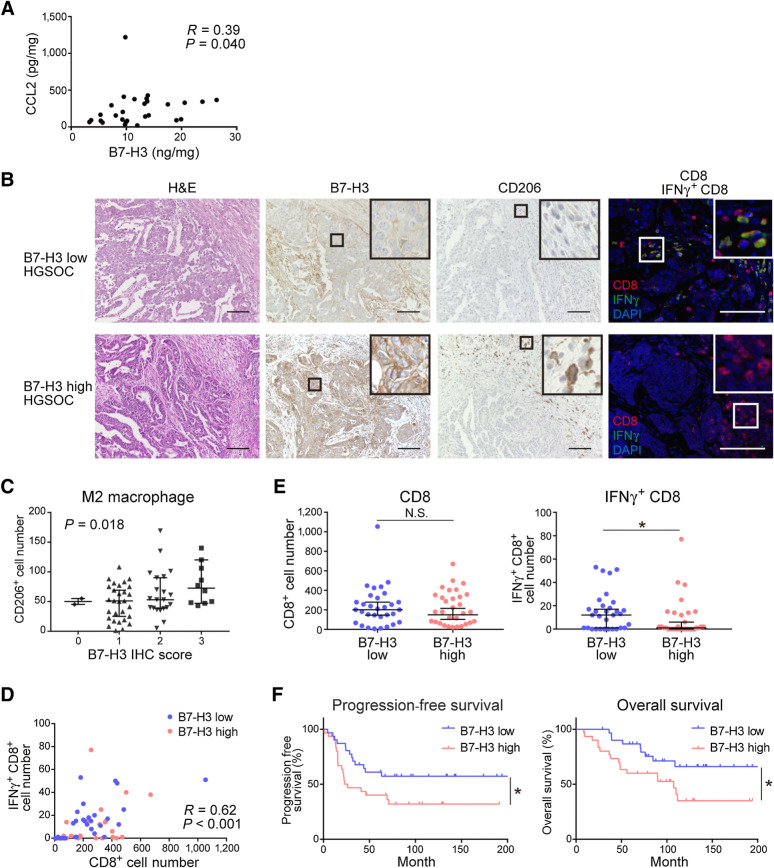
New approaches beyond PD-1/PD-L1 inhibition are required to target the immunologically diverse tumor microenvironment (TME) in high-grade serous ovarian cancer (HGSOC). In this study, we explored the immunosuppressive effect of B7-H3 (CD276) via the CCL2-CCR2-M2 macrophage axis and its potential as a therapeutic target. Transcriptome analysis revealed that B7-H3 is highly expressed in PD-L1-low, nonimmunoreactive HGSOC tumors, and its expression negatively correlated with an IFNγ signature, which reflects the tumor immune reactivity. In syngeneic mouse models, B7-H3 (Cd276) knockout (KO) in tumor cells, but not in stromal cells, suppressed tumor progression, with a reduced number of M2 macrophages and an increased number of IFNγ+CD8+ T cells. CCL2 expression was downregulated in the B7-H3 KO tumor cell lines. Inhibition of the CCL2-CCR2 axis partly negated the effects of B7-H3 suppression on M2 macrophage migration and differentiation, and tumor progression. In patients with HGSOC, B7-H3 expression positively correlated with CCL2 expression and M2 macrophage abundance, and patients with B7-H3-high tumors had fewer tumoral IFNγ+CD8+ T cells and poorer prognosis than patients with B7-H3-low tumors. Thus, B7-H3 expression in tumor cells contributes to CCL2-CCR2-M2 macrophage axis-mediated immunosuppression and tumor progression. These findings provide new insights into the immunologic TME and could aid the development of new therapeutic approaches against the unfavorable HGSOC phenotype.


Figures

Figure 1. CD276 (B7-H3) expression is upregulated in the nonimmunoreactive TME of HGSOC. A, Microarray analysis of HGSOC clinical samples from Kyoto University (n = 30). The immunoreactive (n = 8) and nonimmunoreactive (n = 22) subtypes were compared using the Samroc method. The magenta dot represents CD276 (B7-H3). B, CD276 expression among the molecular subtypes of 263 HGSOC samples from TCGA-OV. Data are presented as the mean ± SEM; **, P < 0.01; ***, P < 0.001; N.S., not significant by one-way ANOVA with Tukey multiple comparison test. C, Gene expression comparison of T cell–suppressive B7 family molecules in the immunoreactive and nonimmunoreactive subtypes of TCGA-OV. Data are presented as the mean ± SEM after Z-score normalization. ***, P < 0.001 by one-way ANOVA. D, Pearson correlation analysis of the IFNγ signature activity scores and expression of T cell–suppressive B7 family molecules in TCGA-OV. Values after Z-score normalization are plotted. *, P < 0.05; ***, P < 0.001. (Green and blue dots represent the immunoreactive and nonimmunoreactive subtypes, respectively, in B–D.
Figure 1.
CD276 (B7-H3) expression is upregulated in the nonimmunoreactive TME of HGSOC. A, Microarray analysis of HGSOC clinical samples from Kyoto University (n = 30). The immunoreactive (n = 8) and nonimmunoreactive (n = 22) subtypes were compared using the Samroc method. The magenta dot represents CD276 (B7-H3). B,CD276 expression among the molecular subtypes of 263 HGSOC samples from TCGA-OV. Data are presented as the mean ± SEM; **, P < 0.01; ***, P < 0.001; N.S., not significant by one-way ANOVA with Tukey multiple comparison test. C, Gene expression comparison of T cell–suppressive B7 family molecules in the immunoreactive and nonimmunoreactive subtypes of TCGA-OV. Data are presented as the mean ± SEM after Z-score normalization. ***, P < 0.001 by one-way ANOVA. D, Pearson correlation analysis of the IFNγ signature activity scores and expression of T cell–suppressive B7 family molecules in TCGA-OV. Values after Z-score normalization are plotted. *, P < 0.05; ***, P < 0.001. (Green and blue dots represent the immunoreactive and nonimmunoreactive subtypes, respectively, in BD.
Figure 2. B7-H3 contributes to tumor progression via an immune-related mechanism in murine ovarian cancer models. A, Flow cytometry of B7-H3 KO HM-1 and ID8 and their respective controls. Blue, pink, and gray histograms represent B7-H3 KO cells, B7-H3 control cells, and the isotype control, respectively. B, Representative B7-H3 IHC (top) and immunofluorescence (bottom) images of controls and HM-1 B7-H3 KO tumors for the indicated markers. αSMA-positive fibroblasts represented by black and white arrowheads. Scale bar, 50 μm. Positive cells were stained brown in IHC, and red (αSMA), green (B7-H3), and blue (DAPI) in immunofluorescence images. C, Intradermal tumor volume (left, n = 6) and omental tumor weight at day 10 (right, n = 6) of immunocompetent mice injected with HM-1 B7-H3 KO or control cells. D, Changes in body weight (top, n = 5–6) and omental tumor weight at day 52 (bottom, n = 6) of immunocompetent mice intraperitoneally injected with ID8 B7-H3 KO or control cells. E, Intradermal tumor volume (left, n = 5) and omental tumor weight at day 10 (right, n = 6) of immunodeficient mice injected with HM-1 B7-H3 KO or control cells. F, Changes in body weight (top, n = 6) and omental tumor weight at day 52 (bottom, n = 6) of immunodeficient mice intraperitoneally injected with ID8 B7-H3 KO or control cells. C–F, Data are presented as the mean ± SEM; ***, P < 0.001; N.S., not significant, unpaired t test.
Figure 2.
B7-H3 contributes to tumor progression via an immune-related mechanism in murine ovarian cancer models. A, Flow cytometry of B7-H3 KO HM-1 and ID8 and their respective controls. Blue, pink, and gray histograms represent B7-H3 KO cells, B7-H3 control cells, and the isotype control, respectively. B, Representative B7-H3 IHC (top) and immunofluorescence (bottom) images of controls and HM-1 B7-H3 KO tumors for the indicated markers. αSMA-positive fibroblasts represented by black and white arrowheads. Scale bar, 50 μm. Positive cells were stained brown in IHC, and red (αSMA), green (B7-H3), and blue (DAPI) in immunofluorescence images. C, Intradermal tumor volume (left, n = 6) and omental tumor weight at day 10 (right, n = 6) of immunocompetent mice injected with HM-1 B7-H3 KO or control cells. D, Changes in body weight (top, n = 5–6) and omental tumor weight at day 52 (bottom, n = 6) of immunocompetent mice intraperitoneally injected with ID8 B7-H3 KO or control cells. E, Intradermal tumor volume (left, n = 5) and omental tumor weight at day 10 (right, n = 6) of immunodeficient mice injected with HM-1 B7-H3 KO or control cells. F, Changes in body weight (top, n = 6) and omental tumor weight at day 52 (bottom, n = 6) of immunodeficient mice intraperitoneally injected with ID8 B7-H3 KO or control cells. C–F, Data are presented as the mean ± SEM; ***, P < 0.001; N.S., not significant, unpaired t test.
Figure 3. B7-H3 suppression in tumor cells decreases the number of intratumoral M2 macrophages and increases IFNγ production of CD8+ T cells. A, IHC of CD206 in the B7-H3 KO intradermal HM-1 tumors and controls (n = 3). CD206+ cells were stained brown. Scale bar, 50 μm. B, Flow cytometry of immune cells from HM-1 tumors. Density plots (top left) show the M2 macrophages at day 12. Each dot represents live CD45+ cells, and the boxed area represents F4/80+CD206+ M2 macrophages. The percentage of positive cells relative to the total cells is plotted (n = 6). C, qPCR for the indicated genes in F4/80+ macrophages (Mϕ) isolated from the HM-1 intradermal tumors (n = 5). D, T-cell proliferation in presence of HM-1 tumor–derived macrophages. Top histograms show the percentage of proliferating T cells cocultured (4:1) with macrophages from control or B7-H3 KO tumors. Bottom bar graph shows the percentage of proliferating T cells cocultured with various ratios of macrophages (n = 5). E, IFNγ levels in the supernatants of cocultures in D (n = 5). F, Flow cytometry of IFNγ+CD8+ T cells from HM-1 tumors. Each dot represents live CD45+CD3+ cells, and the boxed area represents IFNγ+CD8+ T cells. The percentage of IFNγ+CD8+ T cells relative to total CD8+ T cells is plotted (n = 6). A–F, Data are presented as the mean ± SEM; *, P < 0.05; **, P < 0.01; ***, P < 0.001; N.S., not significant, unpaired t test.
Figure 3.
B7-H3 suppression in tumor cells decreases the number of intratumoral M2 macrophages and increases IFNγ production of CD8+ T cells. A, IHC of CD206 in the B7-H3 KO intradermal HM-1 tumors and controls (n = 3). CD206+ cells were stained brown. Scale bar, 50 μm. B, Flow cytometry of immune cells from HM-1 tumors. Density plots (top left) show the M2 macrophages at day 12. Each dot represents live CD45+ cells, and the boxed area represents F4/80+CD206+ M2 macrophages. The percentage of positive cells relative to the total cells is plotted (n = 6). C, qPCR for the indicated genes in F4/80+ macrophages (Mϕ) isolated from the HM-1 intradermal tumors (n = 5). D, T-cell proliferation in presence of HM-1 tumor–derived macrophages. Top histograms show the percentage of proliferating T cells cocultured (4:1) with macrophages from control or B7-H3 KO tumors. Bottom bar graph shows the percentage of proliferating T cells cocultured with various ratios of macrophages (n = 5). E, IFNγ levels in the supernatants of cocultures in D (n = 5). F, Flow cytometry of IFNγ+CD8+ T cells from HM-1 tumors. Each dot represents live CD45+CD3+ cells, and the boxed area represents IFNγ+CD8+ T cells. The percentage of IFNγ+CD8+ T cells relative to total CD8+ T cells is plotted (n = 6). A–F, Data are presented as the mean ± SEM; *, P < 0.05; **, P < 0.01; ***, P < 0.001; N.S., not significant, unpaired t test.
Figure 4. B7-H3 suppression downregulates CCL2 production, in part, via the STAT3 pathway in ovarian cancer cells. A, Differential gene expression based on RNA sequencing (RNA-seq) between controls (n = 3) and B7-H3 KO (n = 3) groups in HM-1 and ID8 cells and HM-1 intradermal tumors. CCL2 protein in the culture supernatants (B) and tumors derived from HM-1 B7-H3 KO (top), ID8 B7-H3 KO (bottom), and their respective controls (n = 5; C). D, CCL2 protein in the culture supernatants of the OVCAR3 shB7-H3 (top), OVCA420 shB7-H3 (bottom), and their respective controls (n = 5). Representative Western blot analysis of nuclear phosphorylated STAT3 (p-STAT3) in HM-1 and ID8 (E) and OVCAR3 and OVCA420 (F) cells. Bottom bar graphs show the signal intensity of p-STAT3 relative to the TBP control in HM-1 and ID8 cells (both n = 10) and OVCAR3 and OVCA420 cells (both n = 7). qPCR for expression of Ccl2 in HM-1 and ID8 cells (G) and CCL2 in OVCAR3 and OVCA420 cells (H) treated with 1.25 and 5 μmol/L of the STAT3 inhibitors C188-9 (G) and Stattic (H), respectively. DMSO was used as the control (n = 3). Data are presented as the mean ± SEM; *, P < 0.05; **, P < 0.01; ***, P < 0.001; N.S., not significant, unpaired t test in B, C, D (OVCA420), E, and F and one-way ANOVA with Tukey multiple comparisons test in D (OVCAR3), G, and H.
Figure 4.
B7-H3 suppression downregulates CCL2 production, in part, via the STAT3 pathway in ovarian cancer cells. A, Differential gene expression based on RNA sequencing (RNA-seq) between controls (n = 3) and B7-H3 KO (n = 3) groups in HM-1 and ID8 cells and HM-1 intradermal tumors. CCL2 protein in the culture supernatants (B) and tumors derived from HM-1 B7-H3 KO (top), ID8 B7-H3 KO (bottom), and their respective controls (n = 5; C). D, CCL2 protein in the culture supernatants of the OVCAR3 shB7-H3 (top), OVCA420 shB7-H3 (bottom), and their respective controls (n = 5). Representative Western blot analysis of nuclear phosphorylated STAT3 (p-STAT3) in HM-1 and ID8 (E) and OVCAR3 and OVCA420 (F) cells. Bottom bar graphs show the signal intensity of p-STAT3 relative to the TBP control in HM-1 and ID8 cells (both n = 10) and OVCAR3 and OVCA420 cells (both n = 7). qPCR for expression of Ccl2 in HM-1 and ID8 cells (G) and CCL2 in OVCAR3 and OVCA420 cells (H) treated with 1.25 and 5 μmol/L of the STAT3 inhibitors C188-9 (G) and Stattic (H), respectively. DMSO was used as the control (n = 3). Data are presented as the mean ± SEM; *, P < 0.05; **, P < 0.01; ***, P < 0.001; N.S., not significant, unpaired t test in B, C, D (OVCA420), E, and F and one-way ANOVA with Tukey multiple comparisons test in D (OVCAR3), G, and H.
Figure 5. The CCL2–CCR2–M2 macrophage axis contributes to B7-H3–mediated tumor progression. A, Chemotaxis of mouse monocytes (left) and generated M2 macrophages (right) in response to HM-1 control or B7-H3 KO TCM. Monocytes or M2 macrophages were pretreated with 2 μmol/L RS504393 (CCR2 antagonist) or DMSO before plating. MEM-Alpha was used as the negative control (n = 3). B, Differentiation of mouse monocytes into M2 macrophages in response to HM-1 control or B7-H3 KO TCM supplemented with 20 μg/mL anti-CCL2 or control IgG. MEM-Alpha was used as the negative control (n = 3). Ab, antibody. C, Tumor growth in mice intradermally injected with HM-1 B7-H3 KO cells or control cells and treated with RS504393 (2 mg/kg body weight) or DMSO daily following tumor inoculation. D, Flow cytometric analysis of the treated tumors in C (n = 6). Data are presented as the mean ± SEM (*, P < 0.05; **, P < 0.01; ***, P < 0.001; N.S., not significant, one-way ANOVA with Tukey multiple comparisons test in A and B, and unpaired t test in C and D).
Figure 5.
The CCL2–CCR2–M2 macrophage axis contributes to B7-H3–mediated tumor progression. A, Chemotaxis of mouse monocytes (left) and generated M2 macrophages (right) in response to HM-1 control or B7-H3 KO TCM. Monocytes or M2 macrophages were pretreated with 2 μmol/L RS504393 (CCR2 antagonist) or DMSO before plating. MEM-Alpha was used as the negative control (n = 3). B, Differentiation of mouse monocytes into M2 macrophages in response to HM-1 control or B7-H3 KO TCM supplemented with 20 μg/mL anti-CCL2 or control IgG. MEM-Alpha was used as the negative control (n = 3). Ab, antibody. C, Tumor growth in mice intradermally injected with HM-1 B7-H3 KO cells or control cells and treated with RS504393 (2 mg/kg body weight) or DMSO daily following tumor inoculation. D, Flow cytometric analysis of the treated tumors in C (n = 6). Data are presented as the mean ± SEM (*, P < 0.05; **, P < 0.01; ***, P < 0.001; N.S., not significant, one-way ANOVA with Tukey multiple comparisons test in A and B, and unpaired t test in C and D).
Figure 6. B7-H3 expression associates with an M2 macrophage–rich, IFNγ+CD8 T cell–poor TME and a poor prognosis in patients with HGSOC. A, Correlation between CCL2 expression and B7-H3 protein in primary HGSOC tumors (n = 28) analyzed by Spearman correlation. B, Representative images of HGSOC samples showing B7-H3 expression and CD206+, CD8+, and IFNγ+CD8+ cells. Cells were stained with hematoxylin and eosin (H&E) or immunostained with the corresponding antibodies. Scale bar, 100 μm. Positive cells were stained brown in IHC, and red (CD8), green (IFNγ), and blue (DAPI) in immunofluorescence slides. The boxed area represents the zoomed image shown in the top right corner. C, Correlation between the infiltration of CD206+ cells and B7-H3 expression in the corresponding primary tumors of HGSOC (n = 62) analyzed using Jonckheere–Terpstra test. Data are presented as the median with 95% confidence intervals. D, Correlation between tumor-infiltrating CD8+ and IFNγ+CD8+ T cells (n = 62) analyzed using Spearman correlation. Blue and pink dots represent B7-H3–low and B7-H3–high expression cases, respectively. E, Comparisons of the number of tumor-infiltrating CD8+ T cells (left) and IFNγ+CD8+ T cells (right) in B7-H3–low and B7-H3–high groups by immunostaining (n = 62). Data are presented as the median with 95% confidence intervals; *, P < 0.05; N.S., not significant, Mann–Whitney U test. F, PFS (left) and OS (right) of patients with HGSOC (n = 62). Patients were classified into a B7-H3–low group (n = 31) and a B7-H3–high group (n = 31). *, P < 0.05; N.S., not significant, log-rank test.
Figure 6.
B7-H3 expression associates with an M2 macrophage–rich, IFNγ+CD8 T cell–poor TME and a poor prognosis in patients with HGSOC. A, Correlation between CCL2 expression and B7-H3 protein in primary HGSOC tumors (n = 28) analyzed by Spearman correlation. B, Representative images of HGSOC samples showing B7-H3 expression and CD206+, CD8+, and IFNγ+CD8+ cells. Cells were stained with hematoxylin and eosin (H&E) or immunostained with the corresponding antibodies. Scale bar, 100 μm. Positive cells were stained brown in IHC, and red (CD8), green (IFNγ), and blue (DAPI) in immunofluorescence slides. The boxed area represents the zoomed image shown in the top right corner. C, Correlation between the infiltration of CD206+ cells and B7-H3 expression in the corresponding primary tumors of HGSOC (n = 62) analyzed using Jonckheere–Terpstra test. Data are presented as the median with 95% confidence intervals. D, Correlation between tumor-infiltrating CD8+ and IFNγ+CD8+ T cells (n = 62) analyzed using Spearman correlation. Blue and pink dots represent B7-H3–low and B7-H3–high expression cases, respectively. E, Comparisons of the number of tumor-infiltrating CD8+ T cells (left) and IFNγ+CD8+ T cells (right) in B7-H3–low and B7-H3–high groups by immunostaining (n = 62). Data are presented as the median with 95% confidence intervals; *, P < 0.05; N.S., not significant, Mann–Whitney U test. F, PFS (left) and OS (right) of patients with HGSOC (n = 62). Patients were classified into a B7-H3–low group (n = 31) and a B7-H3–high group (n = 31). *, P < 0.05; N.S., not significant, log-rank test.

References

    1. Sung H, Ferlay J, Siegel RL, Laversanne M, Soerjomataram I, Jemal A, et al. Global cancer statistics 2020: GLOBOCAN estimates of incidence and mortality worldwide for 36 cancers in 185 countries. CA Cancer J Clin 2021;71:209–49. - PubMed
    1. Ray-Coquard I, Pautier P, Pignata S, Perol D, Gonzalez-Martin A, Berger R, et al. Olaparib plus bevacizumab as first-line maintenance in ovarian cancer. N Engl J Med 2019;381:2416–28. - PubMed
    1. Gonzalez-Martin A, Pothuri B, Vergote I, DePont Christensen R, Graybill W, Mirza MR, et al. Niraparib in patients with newly diagnosed advanced ovarian cancer. N Engl J Med 2019;381:2391–402. - PubMed
    1. Matulonis UA, Shapira-Frommer R, Santin AD, Lisyanskaya AS, Pignata S, Vergote I, et al. Antitumor activity and safety of pembrolizumab in patients with advanced recurrent ovarian cancer: results from the phase II KEYNOTE-100 study. Ann Oncol 2019;30:1080–7. - PubMed
    1. Moore KN, Bookman M, Sehouli J, Miller A, Anderson C, Scambia G, et al. LBA31 primary results from IMagyn050/GOG 3015/ENGOT-OV39, a double-blind placebo (pbo)-controlled randomised phase III trial of bevacizumab (bev)-containing therapy ± atezolizumab (atezo) for newly diagnosed stage III/IV ovarian cancer (OC). Ann Oncol 2020;31:S1161–S2.

Publication types

MeSH terms