. 2021 Nov 19;12(1):6768.
doi: 10.1038/s41467-021-26881-w.

Self-organization of human dorsal-ventral forebrain structures by light induced SHH

Affiliations

Self-organization of human dorsal-ventral forebrain structures by light induced SHH

Riccardo De Santis et al. Nat Commun. .

Abstract

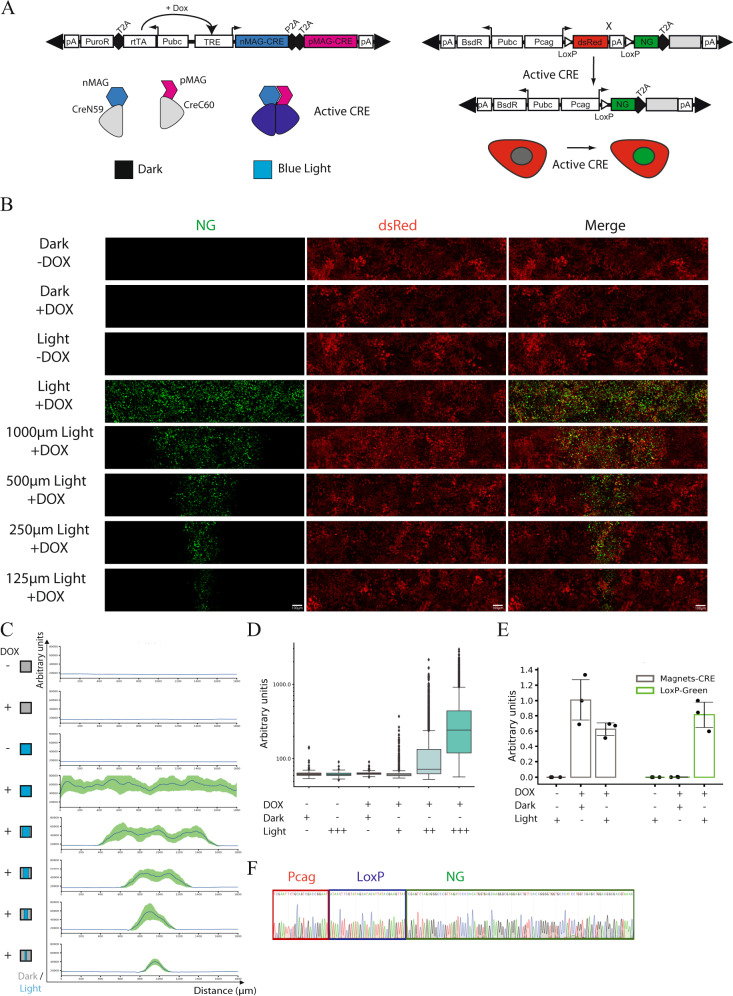
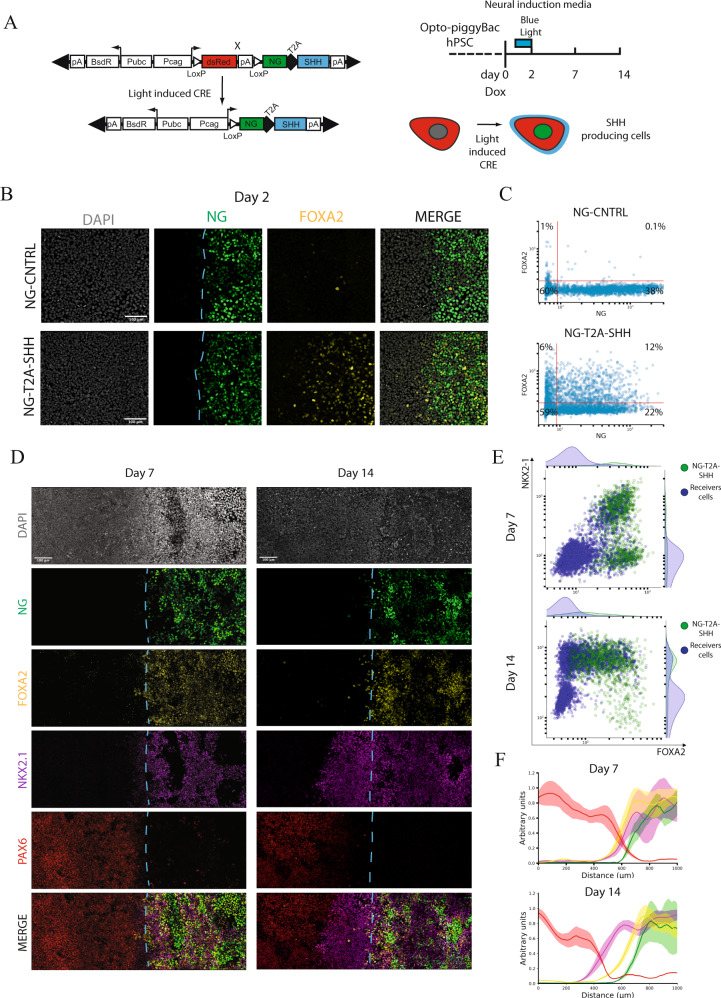
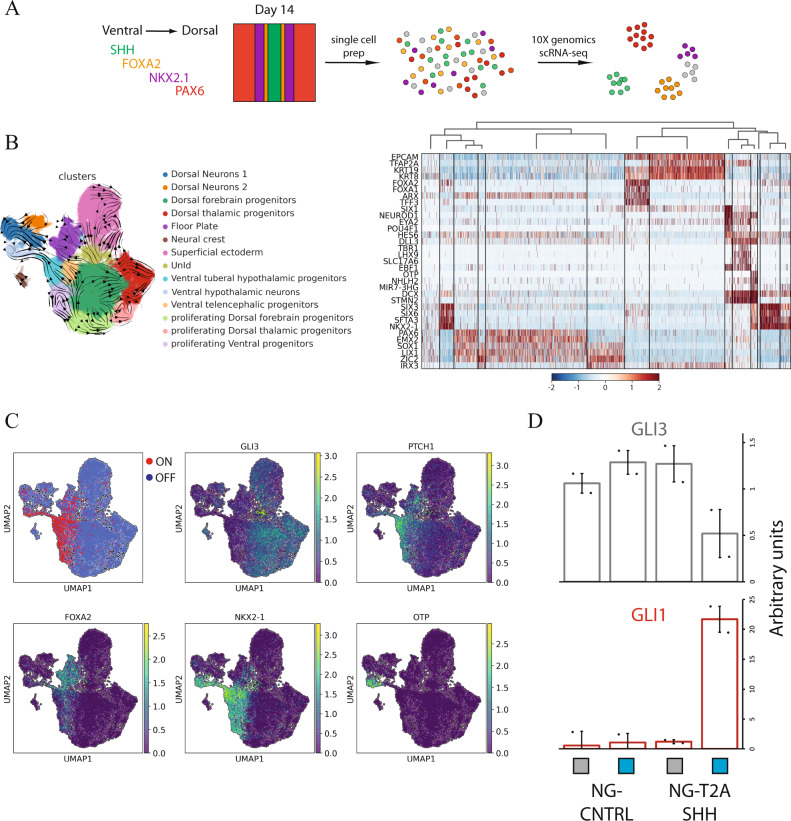
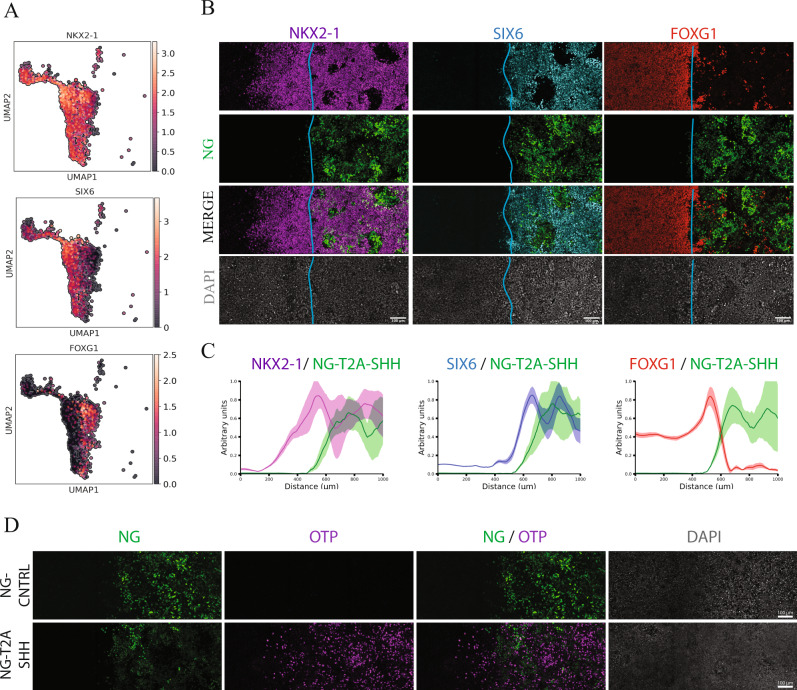
Organizing centers secrete morphogens that specify the emergence of germ layers and the establishment of the body's axes during embryogenesis. While traditional experimental embryology tools have been instrumental in dissecting the molecular aspects of organizers in model systems, they are impractical in human in-vitro model systems to dissect the relationships between signaling and fate along embryonic coordinates. To systematically study human embryonic organizer centers, we devised a collection of optogenetic ePiggyBac vectors to express a photoactivatable Cre-loxP recombinase, that allows the systematic induction of organizer structures by shining blue-light on human embryonic stem cells (hESCs). We used a light stimulus to geometrically confine SHH expression in neuralizing hESCs. This led to the self-organization of mediolateral neural patterns. scRNA-seq analysis established that these structures represent the dorsal-ventral forebrain, at the end of the first month of development. Here, we show that morphogen light-stimulation is a scalable tool that induces self-organizing centers.


Conflict of interest statement

A.H.B. is the co-founder of RUMI Scientific, RUMI Viro and OvaNova. A.H.B., F.E., and E.A.R. are shareholders of RUMI Scientific and RUMI Viro. R.D.S. has no competing interests to disclose.

Figures

Fig. 1
Fig. 1. Light-induced gene expression programs in hESCs.
A Schematization of the collection of optogenetic ePiggyBac vectors to conditionally express a photoactivatable Cre-loxP recombinase vector. Left panel. Puromycin selectable and Dox inducible piggyBac transposon carrying the CRE-MAGNETs system. Dox treatment induces the CRE-MAGNETs system which reconstitutes a fully active CRE in the presence of blue light. Right panel. Blasticidin selectable LoxP exchangeable dual colors piggyBac transposon. The first ORF (Red module) is constitutive expresses while the second ORF (Green module) depends on CRE-LoxP recombination. Gray Box is the possible cargo protein taking advantage of the T2A peptide. B Photomask induced light patterns showing the expression of the Red module (dsRed), Green module (NG) and merge composite channel. Dark control and spatially localized activation in presence and absence of DOX with different spatial features are shown (1000 μm, 500 μm, 250 μm, 125 μm). Scale bar: 100 μm. C Cumulative fluorescence intensity analysis (line profile) over the x-axis. x-axis displays the linear distance in μm. y-axis reports the cumulative fluorescent intensity profile in arbitrary units. Line profile shows the average (line) and SD (area) for the Green fluorescent channel. Quantification after 600 cycles (24 h) of pulsed Blue light (n = 3 biologically independent samples). D Single-cell fluorescent intensity quantification. Conditions: presence or absence of Dox with concomitant Dark or Light stimulation. We titrated the time of light stimulation using different pulsed light conditions. 1 cycle of pulsed light is equal to 20 s Light-ON and 120 s Light-OFF. The light stimulation intervals are 1 cycle, 25 cycles (1 h), and 600 cycles (24 h), data are displayed as a boxplot where center lines show the medians, box limits indicate the 25th and 75th percentiles and whiskers extend to minimum and maximum values (n = 5 biologically independent samples). E qRT-PCR showing mRNA induction of the MAGNETs system and light-induced expression of the Green module, data are displayed as mean and SD (n = 3 biologically independent samples). F Sanger sequencing of the genomic region flanking the LoxP site showing the recombination of the Red module and the generation of the Green module (Red box: Pcag-promoter, Blue box: LoxP, Green box: NG).
Fig. 2
Fig. 2. Medio-lateral neural patterning by light-induced SHH.
A Left panel. Schematization of Green module T2A human SHH. This setup allows conditional expression of SHH and fluorescent visualization of the light-induced cells. Right panel. Schematization of Blue-light stimulation and neural induction reporting analyzed time points. Neural induction is induced by inhibiting TGFβ signaling by dual SMADs inhibition that is maintained during the entire course of differentiation (14 days). Dox treatment starts at day “0” and it is washed-out at day “2”. B FOXA2 immunostaining in light induced SHH cells and NG-CNTRL during differentiation at day 2. DAPI-Gray, NG-Green, FOXA2-Yellow, Merge-Composite. Dashed cyan line indicates the border of SHH producing cells. Scale bar: 100μm. C Day 2 single-cell fluorescence quantification displayed as a scatterplot, reporting FOXA2 and NeonGreen (NG) intensity for NG-CNTRL and NG-T2A-SHH. D Immunostaining time-course analysis of the dorsal and ventral fates, revealing NG-Green (Organizer), FOXA2-Yellow (Ventral floor plate), NKX2-1-Magenta (Ventral neural progenitors), PAX6-Red (Dorsal neural progenitors), Merge-Composite at day 7 and day 14 during neural differentiation in response to ligh patterned SHH. Dashed cyan line indicates the border of SHH producing cells. Scale bar: 100 μm. E Single-cell fluorescence quantification of NG-T2A-SHH induced cells displayed as combined scatterplot and density histogram at day 7 (top) and day 14 (bottom). x-axis report FOXA2 while the y-axis the NKX2-1 fluorescence intensity profile. Each dot represents an individual cell that has been color coded according to its green module status. The green dots represent the NG-T2A-SHH positive cells, while the blue dots are NG-T2A-SHH negative cells. F Cumulative fluorescence intensity analysis (line profile) over the x-axis. x-axis displays the linear distance in μm. y-axis reports the cumulative fluorescent intensity profile in arbitrary units for each channel. Line profile shows the average (line) and SD (area) for each channel. The line profile is color-coded as the immunofluorescent channels, NG-Green, FOXA2-Yellow, NKX2-1-Magenta, PAX6-Red. Top panel. Day 7 quantification (n = 4 biologically independent samples). Bottom panel. Day 14 quantification (n = 4 biologically independent samples).
Fig. 3
Fig. 3. scRNA-seq characterization of light-induced SHH neural cells.
A Schematization of the scRNA-seq profiling strategy. B Left panel: UMAP plot labeled with the identified cell identities and RNA velocity vectors: (i) FOXA2+/ARX Floor Plate, (ii) NKX2-1+/RAX+/SIX6+ Ventral tuberal hypothalamic progenitors, (iii) NKX2-1+/FOXG1+ Ventral telencephalic progenitors, (iv) NKX2-1+/NHLH2+/OTP+ Ventral hypothalamic neurons, (v) TFAP2A+/KRT19+ Superficial ectoderm, (vi) SOX10+/PLP1+ Neural Crest, (vii) PAX6+/EMX2+/OTX2+ Dorsal forebrain progenitors, (viii) IRX3+/OLIG3+ Dorsal thalamic progenitors, (ix) TBR1+/LHX1+ Dorsal Neurons_1, (x) HES6+/DLL3+ Dorsal Neurons_2, dorsal and ventral proliferating progenitors, (xi) Dorsal, (xii) Dorsal thalamic, (xiii) Ventral and (xiv) an UnIdentified population (UnId). Right panel: z-score scaled heatmap of marker genes used for cell identities classification. C UMAP plot displaying SHH responsive and unresponsive status, and GLI3 and PTCH1 expression level. SHH responsive and unresponsive status have been computed imposing a threshold based on the normalized distribution of GLI3, GAS1 and PTCH1 counts, where GLI3-GAS1low and PTCH1high represent SHH responsive while GLI3-GAS1high, PTCH1low unresponsive. D qRT-PCR analysis of SHH responsive genes (GLI1 and GLI3) for NG-T2A-SHH and NG-CNTRL at day 14 of differentiation. The histogram displays the average and SD of differentiated cells exposed to light stimulation or dark control (n = 2 biologically independent samples). .
Fig. 4
Fig. 4. Spatial self-organization of telencephalic and hypothalamic fates upon light-induced SHH.
A UMAP plot showing a selected population of cell NKX2-1+. Expression of markers that distinguish hypothalamic and telencephalic populations (NKX2-1, SIX6 and FOXG1). B Immunostaining shows the spatial segregation of ventral population arising from a light-induced SHH source at day 14. (Green NG, Magenta NKX2.1, Cyan SIX6, Red FOXG1, Gray DAPI), Scale bar = 100 μm. C Cumulative fluorescence intensity analysis (line profile) over the x-axis. x-axis displays the linear distance in μm. y-axis shows the cumulative fluorescent intensity profile in arbitrary units for each channel. Line profile shows the average (line) and SD (area) for each channel. The line profile is color-coded as the immunofluorescent channels, NG-Green, NKX2-1-Magenta, SIX6-Cyan, FOXG1-Red at day 14 quantification (n = 3 biologically independent samples). D Immunostaining shows OTP positive cells induced in proximity of the NG-T2A-SHH organizer but not in the NG-CNTRL. Light induced SHH drive the self-organization of both neural progenitors and neurons (Green NG, Magenta OTP, Gray DAPI), Scale bar = 100 μm.

References

    1. Spemann H, Mangold H. Induction of embryonic primordia by implantation of organizers from a different species. 1923. Int J. Dev. Biol. 2001;45:13–38. - PubMed
    1. Harland R, Gerhart J. Formation and function of spemann’s organizer. Cell Dev. Biol. 1997;13:611–667. - PubMed
    1. Sasai Y, et al. Xenopus chordin: a novel dorsalizing factor activated by organizer-specific homeobox genes. Cell. 1994;79:779–790. - PMC - PubMed
    1. Hemmati-Brivanlou A, Melton DA. Inhibition of activin receptor signaling promotes neuralization in Xenopus. Cell. 1994;77:273–281. - PubMed
    1. Ozair MZ, Kintner C, Brivanlou AH. Neural induction and early patterning in vertebrates. Wiley Interdiscip. Rev. Dev. Biol. 2013;2:479–498. - PMC - PubMed

Publication types

MeSH terms