. 2021 Nov 19;12(1):6750.
doi: 10.1038/s41467-021-26999-x.

The autophagy protein ATG9A enables lipid mobilization from lipid droplets

Affiliations

The autophagy protein ATG9A enables lipid mobilization from lipid droplets

Elodie Mailler et al. Nat Commun. .

Abstract

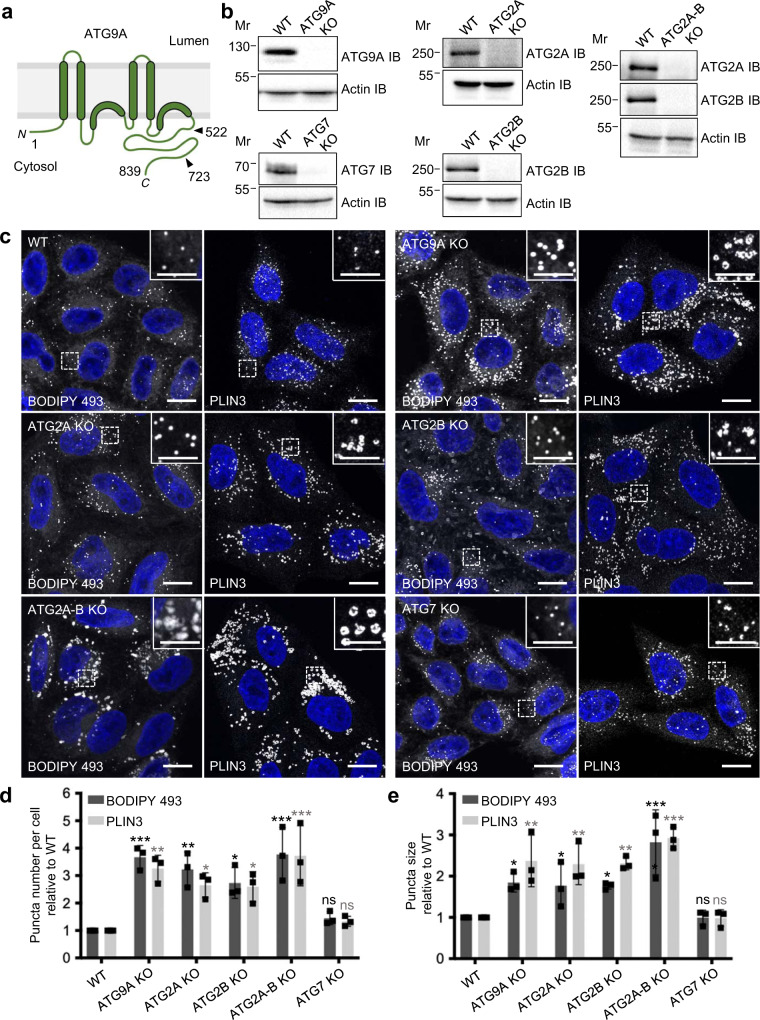
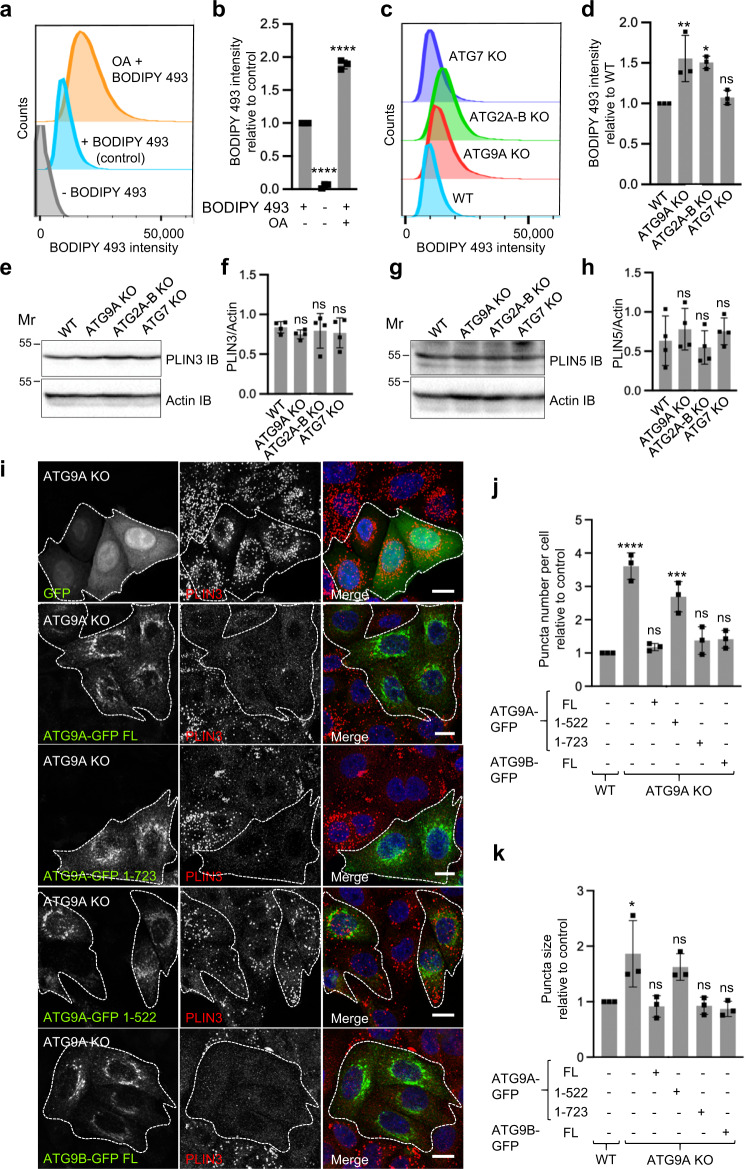
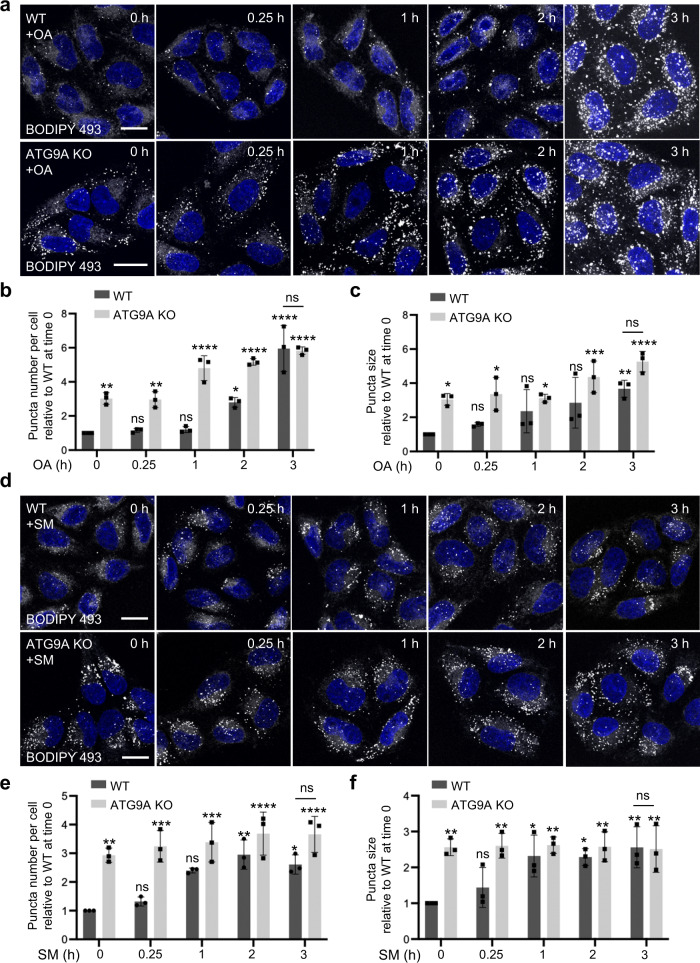
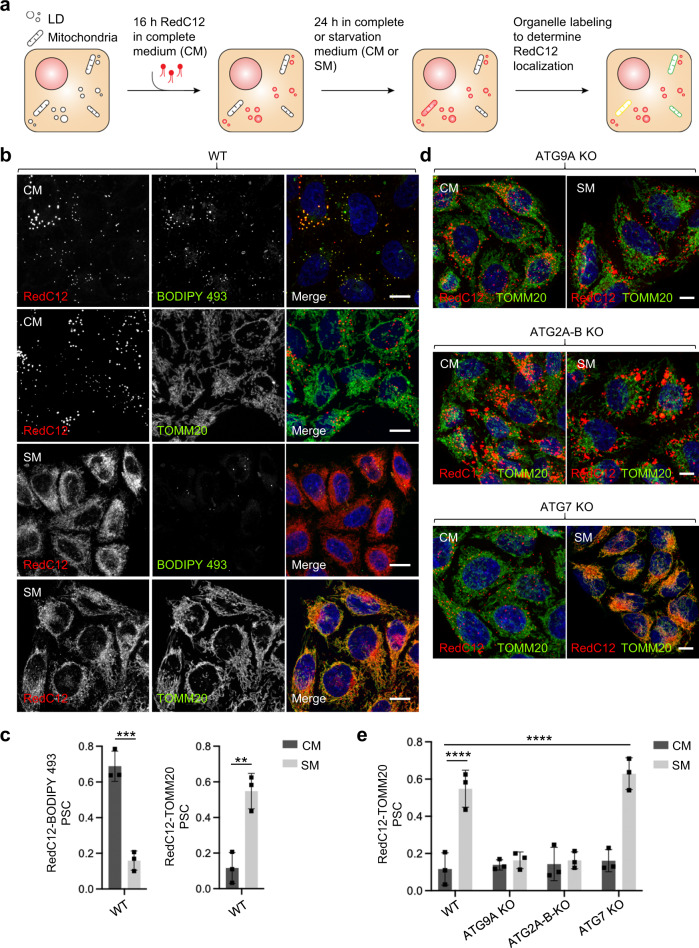
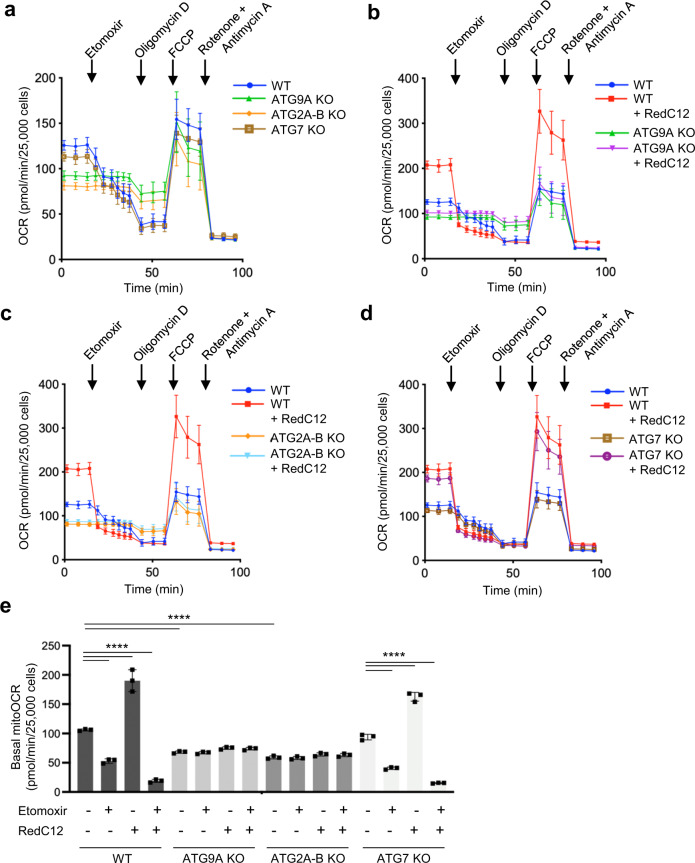
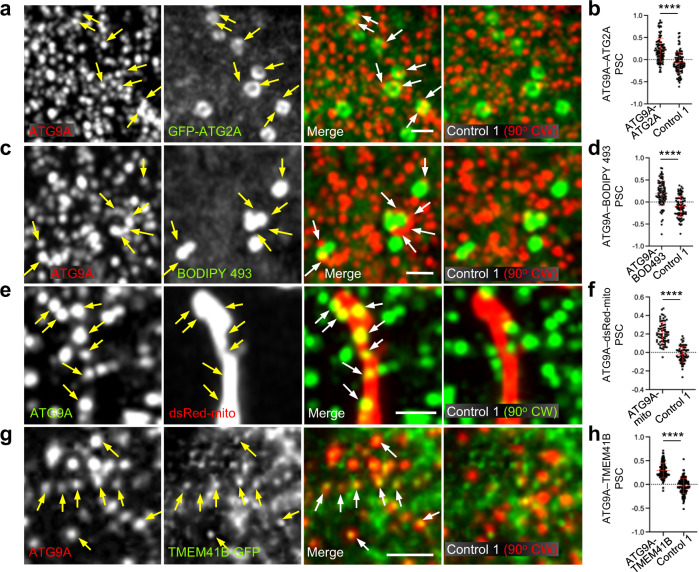
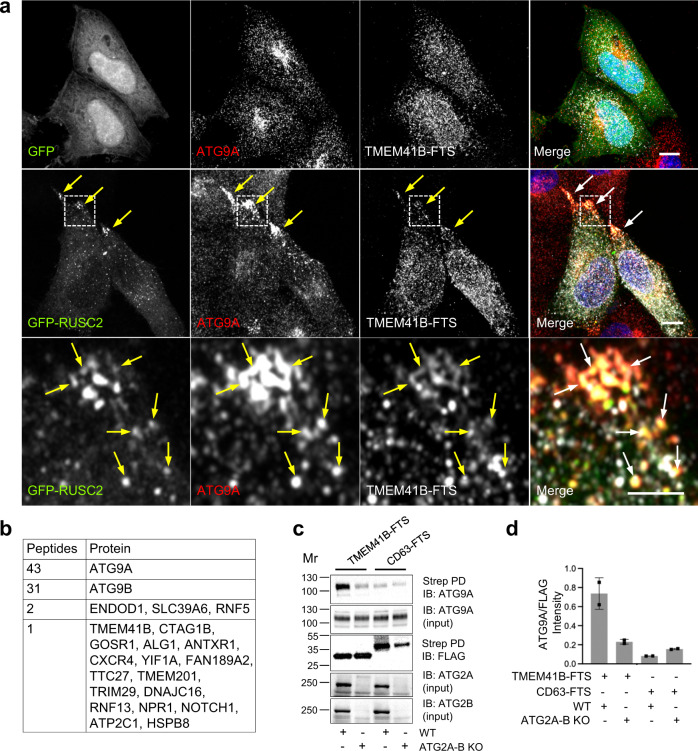
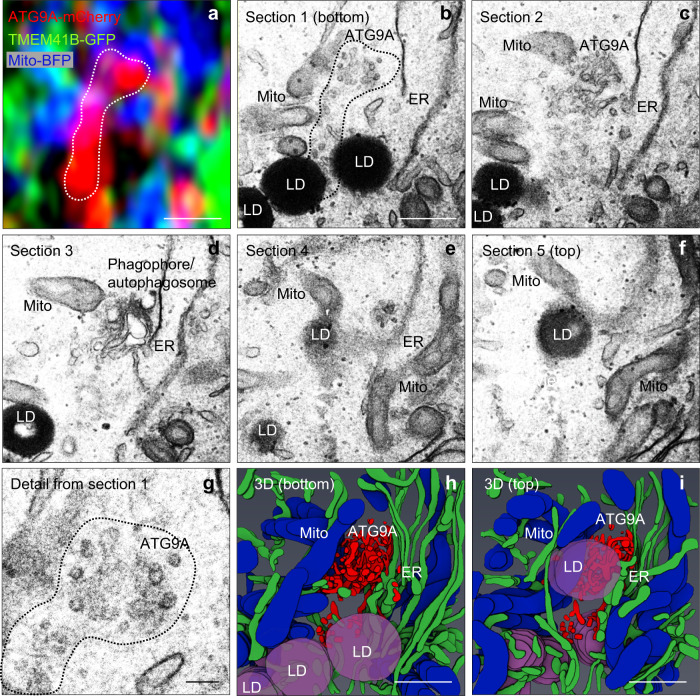
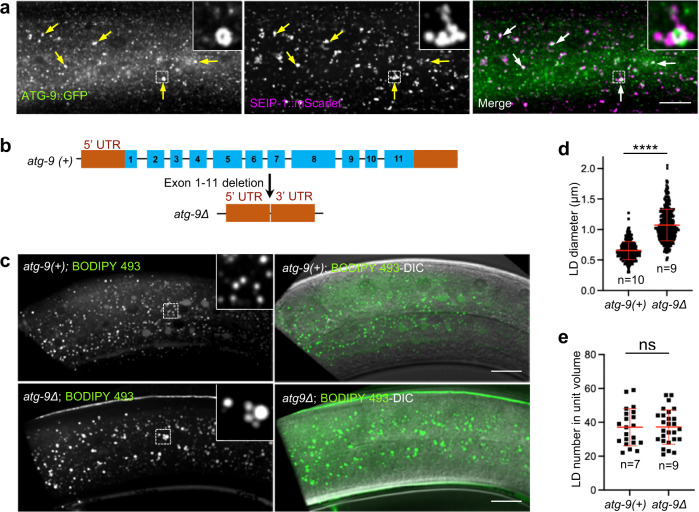
The multispanning membrane protein ATG9A is a scramblase that flips phospholipids between the two membrane leaflets, thus contributing to the expansion of the phagophore membrane in the early stages of autophagy. Herein, we show that depletion of ATG9A does not only inhibit autophagy but also increases the size and/or number of lipid droplets in human cell lines and C. elegans. Moreover, ATG9A depletion blocks transfer of fatty acids from lipid droplets to mitochondria and, consequently, utilization of fatty acids in mitochondrial respiration. ATG9A localizes to vesicular-tubular clusters (VTCs) that are tightly associated with an ER subdomain enriched in another multispanning membrane scramblase, TMEM41B, and also in close proximity to phagophores, lipid droplets and mitochondria. These findings indicate that ATG9A plays a critical role in lipid mobilization from lipid droplets to autophagosomes and mitochondria, highlighting the importance of ATG9A in both autophagic and non-autophagic processes.


Conflict of interest statement

The authors declare no competing interests.

Figures

Fig. 1
Fig. 1. ATG9A KO increases the number and size of LDs in HeLa cells.
a Schematic representation of human ATG9A showing the four transmembrane helices, two helices that partially penetrate the membrane, and the cytosolic N- and C-terminal domains,. Numbers indicate the position of amino-acid residues relevant to this study. b SDS-PAGE and immunoblot (IB) analysis of WT and KO HeLa cells using antibodies to the proteins indicated on the right of each panel. Actin IB was used as a loading control. The positions of molecular mass (Mr) markers (in kDa) are indicated on the left of each panel. Results are representative from three independent experiments. c Confocal fluorescence microscopy of WT and KO cells that were fixed, permeabilized and stained for LDs with BODIPY 493 (green) or antibody to PLIN3 (red) (both shown in grayscale). Nuclei were stained with DAPI (blue). Scale bars: 10 μm. Insets show enlarged views of the boxed areas. Scale bars: 1 μm. Results are representative from three independent experiments. d, e The number per cell (d) and size (e) of LDs were quantified in 20 cells in each of three independent experiments using the ‘Analyze particles’ function of Image J. Bar graphs represent the mean ± SD fold-change of these values for BODIPY 493 (black bars) and PLIN3 (gray bars) in KO relative to WT cells. Statistical significance was determined using one-way ANOVA with Tukey post-hoc test (ns [not significant] p > 0.05, *p < 0.05, **p < 0.01, ***p < 0.001).
Fig. 2
Fig. 2. Accumulation of neutral lipids and phenotypic rescue of ATG9A-KO cells.
ad Measurement of neutral lipid levels in WT HeLa cells by BODIPY 493 staining and FACS analysis. a WT cells were incubated for 2 h at 37 oC with or without 200 μM oleic acid (OA), and stained (+) or not (-) with BODIPY 493. b Quantification of the BODIPY 493 geometric mean fluorescence intensity (gMFI) of 100,000 cells per biological replicate in three independent experiments such as that shown in panel a. Bar graph represents the mean ± SD fold-change in each condition relative to non OA-incubated cells stained with BODIPY 493. Statistical significance was determined using one-way ANOVA with Tukey post-hoc test (****p < 0.0001). c WT, ATG9A-KO, ATG2A-B-KO and ATG7-KO cells were stained with BODIPY 493 and analyzed by FACS. d Quantification of the BODIPY 493 gMFI of 100,000 cells per biological replicate in three independent experiments such as that shown in c. Bar graph represents the mean ± SD fold-change in KO relative to WT cells. Statistics were as described in b (ns p > 0.05, *p < 0.05, **p < 0.01). eh SDS-PAGE and IB analysis of WT and KO cells for PLIN3 (e) and PLIN5 (g). The positions of molecular mass (Mr) markers (in kDa) are indicated on the left of each panel. Results are representative from three independent experiments. Bar graphs represent the mean ± SD of PLIN3 (f) and PLIN5 (h) levels normalized for actin from four independent experiments such as those in e and f, respectively. Statistical significance was determined using one-way ANOVA with Tukey post-hoc test (ns p > 0.05). ik Functional rescue of the LD phenotype of ATG9A-KO cells. i Confocal fluorescence microscopy of ATG9A-KO HeLa cells transiently transfected with plasmids encoding GFP (control), ATG9A-GFP FL (full length), ATG9A-GFP 1-522, ATG9A-GFP 1-723 or ATG9B-GFP FL (green), and stained with an antibody to PLIN3 (red) and DAPI (blue). Single-channel images are shown in grayscale. Transfected cells are outlined. Scale bar: 10 μm. Results are representative from three independent experiments. j, k The number per cell (j) and size (k) of LDs were quantified using the “Analyze particles” function of Image J in 20 cells in each of three independent experiments such as that shown in panel i. Bar graphs represent the mean ± SD fold-change of values relative to untransfected WT cells. Statistical significance was determined using one-sided ANOVA with Tukey post-hoc test (ns p > 0.05, *p < 0.05, ***p < 0.001, ****p < 0.0001).
Fig. 3
Fig. 3. ATG9A KO phenocopies LD alterations caused by OA feeding or starvation.
a Effect of OA treatment on LDs in WT and ATG9A-KO cells. Cells were incubated for the indicated times at 37 oC with 200 μM oleic acid (OA), fixed, permeabilized, stained for LDs with BODIPY 493 (green) (shown in grayscale) and nuclei with DAPI (blue), and examined by confocal fluorescence microscopy. Scale bars: 10 μm. Results are representative from three independent experiments. b, c The number per cell (b) and size (c) of LDs were quantified in 20 cells in each of three independent experiments using the “Analyze particles” function of Image J. Bar graphs represent the mean ± SD fold-change of these values relative to WT cells at time 0. Statistical significance was determined using one-way ANOVA with Tukey post-hoc test (ns p > 0.05, *p < 0.05, **p < 0.01, ***p < 0.001, ****p < 0.0001). d Effect of starvation on LDs in WT and ATG9A-KO cells. Cells were incubated for the indicated times in amino-acid- and serum-free medium (starvation medium or SM), and analyzed by confocal fluorescence microscopy as described for panel a. Scale bars: 10 μm. Results are representative from three independent experiments. e, f The number per cell (e) and size (f) of LDs were quantified as described for panels b, c.
Fig. 4
Fig. 4. Impairment of FA transfer from LDs to mitochondria in ATG9A-KO cells.
a Schematic representation of the microscopy pulse-chase assay for transfer of fluorescent fatty acid (FA, RedC12) from LDs to mitochondria. b WT HeLa cells were pulsed for 16 h with RedC12, chased for 24 h in regular culture medium (complete medium or CM) or amino-acid- and serum-free medium (starvation medium or SM), fixed, stained for LDs with BODIPY 493 (red), mitochondria with antibody to TOMM20 (green), and nuclei with DAPI (blue), and imaged by confocal fluorescence microscopy. Single-channel images are shown in grayscale. Scale bars: 10 μm. Results are representative from three independent experiments. c Quantification of co-localization of RedC12 with LDs and mitochondria in WT cells from experiments such as that shown in panel b. The Pearson-Spearman’s correlation coefficient (PSC) between signals in the two channels was calculated by using the PSC colocalization plugin in ImageJ. Bar graphs represent the mean ± SD from 20 cells per biological replicate in three independent experiments. Statistical significance was determined using an unpaired two-tailed Student’s t-test (**p < 0.01, ***p < 0.001). d ATG9A-KO, ATG2A-B-KO, and ATG7-KO cells were analyzed as described for WT cells in panel b. Results are representative from three independent experiments. e Quantification of co-localization of RedC12 with LDs and mitochondria from experiments such as that shown in panel d as described for WT cells in panel c. Statistical significance was determined using one-sided ANOVA with Tukey post hoc test (****p < 0.0001).
Fig. 5
Fig. 5. ATG9A KO and ATG2A-B KO block FA β-oxidation in mitochondria.
ae Mitochondrial β-oxidation of FAs in WT and KO cell lines was analyzed by measuring the oxygen consumption rate (OCR) with a Seahorse flux analyzer. The contribution of FA metabolism to the OCR was determined by the addition of 4 μM of the mitochondrial FA import inhibitor etomoxir. a Representative Seahorse analysis of OCR in WT and the indicated KO cell lines. bd Representative Seahorse analysis showing the OCR of WT and the indicated KO cell lines in the presence or absence of 1 μM RedC12 as an extra source of FAs. e Quantification of basal mitochondrial OCR in WT and KO cells with or without the indicated additives. Mitochondrial OCR was calculated by subtracting the OCR insensitive to rotenone plus antimycin A (last time point in ad) from the basal OCR. Bar graph represents the mean ± SD of OCR values from three independent experiments. Statistical significance was determined using one-way ANOVA with Tukey post hoc test (****p < 0.0001).
Fig. 6
Fig. 6. Immunofluorescence microscopy reveals apposition of ATG9A foci to LDs, mitochondria and ER.
a Confocal fluorescence microscopy of HeLa cells transiently transfected with a plasmid encoding GFP-ATG2A (green), fixed, permeabilized, and stained with an antibody to endogenous ATG9A (red). Images show single channels in grayscale, merged channels in green and red, and a random co-localization control in which the red channel was rotated 90o clockwise (CW). Images are enlargements of Box 1 in Supplementary Fig. 5c. Results are representative from three independent experiments. b Quantification of the co-localization of ATG9A with GFP-ATG2A by calculation of the PSC between signals in the green and red channels in experimental and control alignments. Calculations were done for several regions of interest per cell in 10 cells per biological replicate in three independent experiments (n = 108). Graphs show the mean ± SD of values from the three experiments. Statistical significance was determined using an unpaired two-tailed Student’s t-test (****p < 0.0001). c Confocal fluorescence microscopy of HeLa cells stained with an antibody to endogenous ATG9A (red) and BODIPY 493 (green) as described for panel a. Images are enlargements of Box 1 in Supplementary Fig. 5e. d ATG9A-BODIPY 493 co-localization quantified as described for panel b (n = 91). e Confocal fluorescence microscopy of HeLa cells stained with an antibody to endogenous ATG9A (green) and dsRed-mito (red) as described for panel a. f ATG9A–dsRed-mito co-localization quantified as described for panel b (n = 69). g Confocal fluorescence microscopy of HeLa cells transfected with a plasmid encoding TMEM41B-GFP (green) and stained with an antibody to endogenous ATG9A (red) as described for panel a. h ATG9A–TMEM41B-GFP co-localization quantified as described for panel b (n = 135). Arrows indicate individual ATG9A foci and their corresponding positions in other images. Scale bars in all the panels: 1 μm.
Fig. 7
Fig. 7. Association of ATG9A and TMEM41B structures.
a Redistribution of ATG9A and TMEM41B-FTS to cell vertices by overexpression of GFP-RUSC2. Confocal fluorescence microscopy of HeLa cells transiently transfected with plasmids encoding GFP (control) or GFP-RUSC2 (green) and TMEM41B-FTS, fixed, permeabilized and stained with antibodies to endogenous ATG9A (red) and FLAG epitope (to label TMEM41B-FTS) and with DAPI (blue). Single-channel images are shown in grayscale. Scale bars: 10 μm. Enlarged views of the boxed areas are shown in the bottom row. Scale bar: 1 μm. Co-localization at cell vertices is indicated by arrows. Results are representative from three independent experiments. b Summary of TAP-MS analysis of proteins that co-purify with ATG9A-FTS. Raw data are shown in Supplementary data 1. c Validation of ATG9A-TMEM41B interaction by Strep-Tactin pulldown (Strep PD) and IB. WT and ATG2A-B-KO HeLa cells were transiently transfected with plasmids encoding TMEM41B-FTS or CD63-FTS (non-specific control). Cell extracts were incubated with Strep-Tactin beads, and bound and input proteins analyzed by SDS-PAGE and immunoblotting with antibodies to ATG9A, ATG2A, ATG2B and the FLAG epitope. The positions of molecular mass (Mr) markers (in kDa) are indicated on the left. d Quantification of the ratio of ATG9A in the PD to FLAG in the input in two experiments such as that shown in c. Bars represent the means ± SD from two independent experiments.
Fig. 8
Fig. 8. Correlative light-electron microscopy of ATG9A localization relative to other organelles.
HeLa cells transiently transfected with plasmids encoding ATG9A-mCherry (red), TMEM41B-GFP (green) and mito-BFP (blue) were starved for 20 min prior to fixation and analysis by CLEM. a Airyscan image of an ATG9A-positive structure (outlined) in close proximity to TMEM41B and mitochondria. Scale bar: 0.5 μm. b Transmission EM (TEM) image corresponding to the Airyscan image shown in panel a. Scale bar: 0.5 μm. cf TEM images of sequential serial sections. g Enlarged view of the ATG9A-positive structure in b showing the typical appearance of a VTC. Scale bar: 0.1 μm. h, i 3D reconstruction of TEM images in panels bf using Amira software, viewed from the bottom (h) or the top (i) of the cell. The identity of different organelles is indicated. Scale bar: 0.5 μm. Results are representative from three independent experiments.
Fig. 9
Fig. 9. Deletion of atg-9 causes enlargement of LDs in C. elegans hypodermal cells.
a Fluorescence microscopy imaging of hypodermal tissue from WT C. elegans expressing endogenously tagged ATG-9::GFP (green) and SEIP-1::mScarlet (magenta). Scale bar: 20 μm. Arrows indicate puncta where ATG-9::GFP and SEIP-1::mScarlet co-localize. Insets are 4x magnified views of the boxed areas. Results are representative from three independent experiments. b Schematic representation of the genomic structure of the WT atg-9(+) and mutant atg-9Δ alleles. c Fluorescence microscopy and differential interference contrast (DIC) imaging of hypodermal tissue from WT (atg-9(+)) and atg-9Δ animals stained with BODIPY 493. Scale bars: 20 μm. Insets are 4x magnified views of the boxed areas. Results are representative from three independent experiments. d, e Quantification of LD diameter and number in WT (atg-9(+)) and atg-9Δ hypodermal tissue in the indicated number (n) of animals. d Graph showing the individual values and the mean ± SD of LD diameter. Approximately 30 LDs were measured per animal. Statistical significance was determined using the unpaired two-tailed Student’s t-test (****p < 0.0001). e Graph showing the individual values and the mean ± SD of LD number, quantified in a unit volume (L 18 μm x W 18  μm x H 10 μm) with three independent units measured per animal.

References

    1. Bento CF, et al. Mammalian autophagy: how does it work? Annu. Rev. Biochem. 2016;85:685–713. - PubMed
    1. Melia, T. J., Lystad, A. H. & Simonsen, A. Autophagosome biogenesis: From membrane growth to closure. J. Cell Biol. 219, (2020). - PMC - PubMed
    1. Yu L, Chen Y, Tooze SA. Autophagy pathway: Cellular and molecular mechanisms. Autophagy. 2018;14:207–215. - PMC - PubMed
    1. Axe EL, et al. Autophagosome formation from membrane compartments enriched in phosphatidylinositol 3-phosphate and dynamically connected to the endoplasmic reticulum. J. Cell Biol. 2008;182:685–701. - PMC - PubMed
    1. Hayashi-Nishino M, et al. A subdomain of the endoplasmic reticulum forms a cradle for autophagosome formation. Nat. Cell Biol. 2009;11:1433–1437. - PubMed

Publication types

MeSH terms