. 2021 Nov 19;12(1):6754.
doi: 10.1038/s41467-021-27049-2.

A national cohort study (2000-2018) of long-term air pollution exposure and incident dementia in older adults in the United States

Affiliations

A national cohort study (2000-2018) of long-term air pollution exposure and incident dementia in older adults in the United States

Liuhua Shi et al. Nat Commun. .

Abstract

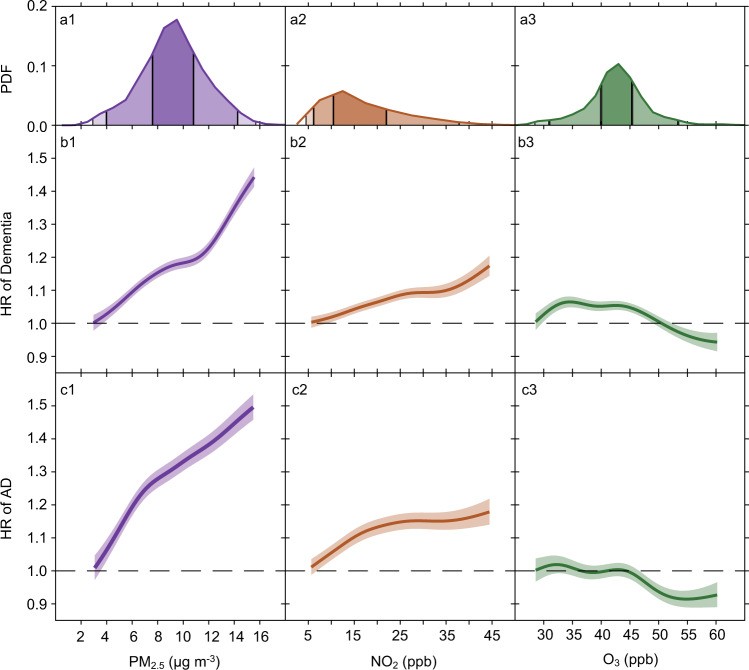
Air pollution may increase risk of Alzheimer's disease and related dementias (ADRD) in the U.S., but the extent of this relationship is unclear. Here, we constructed two national U.S. population-based cohorts of those aged ≥65 from the Medicare Chronic Conditions Warehouse (2000-2018), combined with high-resolution air pollution datasets, to investigate the association of long-term exposure to ambient fine particulate matter (PM2.5), nitrogen dioxide (NO2), and ozone (O3) with dementia and AD incidence, respectively. We identified ~2.0 million incident dementia cases (N = 12,233,371; dementia cohort) and ~0.8 million incident AD cases (N = 12,456,447; AD cohort). Per interquartile range (IQR) increase in the 5-year average PM2.5 (3.2 µg/m3), NO2 (11.6 ppb), and warm-season O3 (5.3 ppb) over the past 5 years prior to diagnosis, the hazard ratios (HRs) were 1.060 (95% confidence interval [CI]: 1.054, 1.066), 1.019 (95% CI: 1.012, 1.026), and 0.990 (95% CI: 0.987, 0.993) for incident dementias, and 1.078 (95% CI: 1.070, 1.086), 1.031 (95% CI: 1.023, 1.039), and 0.982 (95%CI: 0.977, 0.986) for incident AD, respectively, for the three pollutants. For both outcomes, concentration-response relationships for PM2.5 and NO2 were approximately linear. Our study suggests that exposures to PM2.5 and NO2 are associated with incidence of dementia and AD.


Conflict of interest statement

The authors declare no competing interests.

Figures

Fig. 1
Fig. 1. Maps of the spatial distributions of air pollutants studied.
The three panels present the average concentrations of a annual PM2.5 (μg/m³), b annual NO2 (ppb), and c warm-season O3 (ppb) at 1-km2 resolution across the contiguous United States over the study period, respectively. Map was made from the census bureau shapefile (cb_2017_us_county_500k.shp, https://www2.census.gov/geo/tiger/GENZ2017/shp/) using R software, and no licenses are required as this map was provided free of any copyright restrictions. Source data are provided as a Source Data file.
Fig. 2
Fig. 2. Results of the Cox proportional hazards models.
The two panels present the hazard ratios of a dementia (n = 12,233,371 individuals examined) or b Alzheimer’s disease (AD, n = 12,456,447 individuals examined) associated with per IQR increase in annual PM2.5, or annual NO2, or warm-season O3 concentration, respectively. The estimated hazard ratios were obtained using single pollutant, bi-pollutant, and tri-pollutant models. Error bars stand for the 95% confidence intervals. The gray and white stripes are used to distinguish any two adjacent models. Source data are provided as a Source Data file.
Fig. 3
Fig. 3. Concentration-response curves. Panel.
a presents the probability distribution functions (PDF) of long-term PM2.5, NO2, and O3 exposures; Panel b presents the concentration–response relationships between each pollutant and dementia; Panel c presents the concentration-response relationships between each pollutant and Alzheimer’s disease (AD). The concentration–response curves, derived from the tri-pollutant models, are shown for the concentration ranges between 0.5th to 99.5th percentiles of the pollutants, i.e. with 1% poorly constrained extreme values excluded. Shading areas (from the darkest to the lightest) in a represent pollutant concentration ranges of the IQR (i.e., 25th to 75th percentiles), 95% (2.5th to 97.5th), and 99% (0.5th to 99.5th), respectively. Source data are provided as a Source Data file.
Fig. 4
Fig. 4. Effect modifications by sex, race, Medicaid eligibility, age, and population density.
Results represent the hazard ratios of dementia (n = 12,233,371 individuals examined) or Alzheimer’s disease (AD, n = 12,456,447 individuals examined), from the tri-pollutant models, per IQR increase in 5-year average PM2.5, NO2, or O3. Error bars stand for the 95% confidence intervals. The blue dashed lines indicate the overall effect estimates for all groups. “Other” includes Asian, Hispanic, American Indian or Alaskan Native, and unknown. “Density Q1–Q4” denotes quartiles of population density, i.e., low population density, low-medium population density, medium-high population density, and high population density. Source data are provided as a Source Data file.

References

    1. Livingston G, et al. Dementia prevention, intervention, and care. Lancet. 2017;390:2673–2734. doi: 10.1016/S0140-6736(17)31363-6. - DOI - PubMed
    1. Heron, M. P. Deaths: leading causes for 2017. Natl. Vital. Stat. Rep.68, 1–77 (2019). - PubMed
    1. Khachaturian ZS, Khachaturian AS, Thies W. The draft “National Plan” to address Alzheimer’s disease-National Alzheimer’s Project Act (NAPA) Alzheimer’s Dement. 2012;8:234–236. doi: 10.1016/j.jalz.2012.04.004. - DOI - PubMed
    1. Peters R, et al. Air pollution and dementia: a systematic review. J. Alzheimer’s Dis. 2019;70:S145–S163. doi: 10.3233/JAD-180631. - DOI - PMC - PubMed
    1. Fu, P. & Yung, K. K. L. Air pollution and Alzheimer’s disease: a systematic review and meta-analysis. J. Alzheimer’s Dis.77, 701–714 (2020). - PubMed

Publication types