

Advanced trap lateral flow immunoassay sensor for the detection of cortisol in human bodily fluids
- PMID: 34799635
- PMCID: PMC8604903
- DOI: 10.1038/s41598-021-02084-7
Advanced trap lateral flow immunoassay sensor for the detection of cortisol in human bodily fluids
Abstract
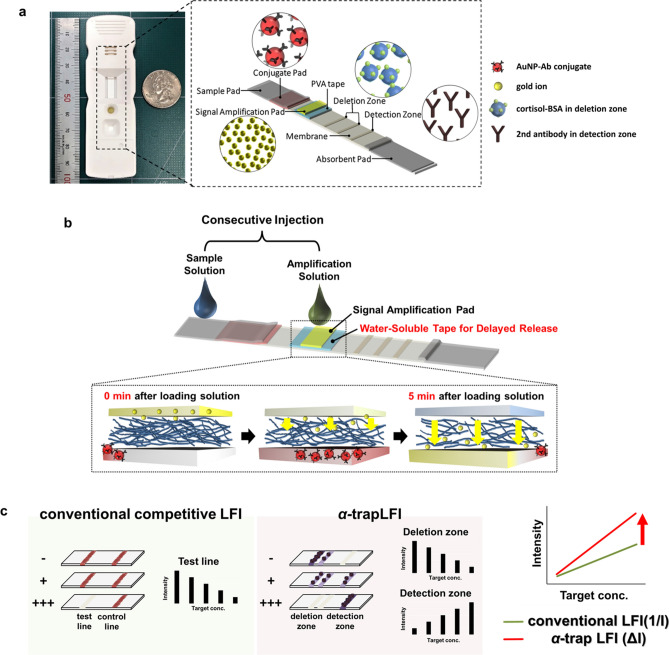
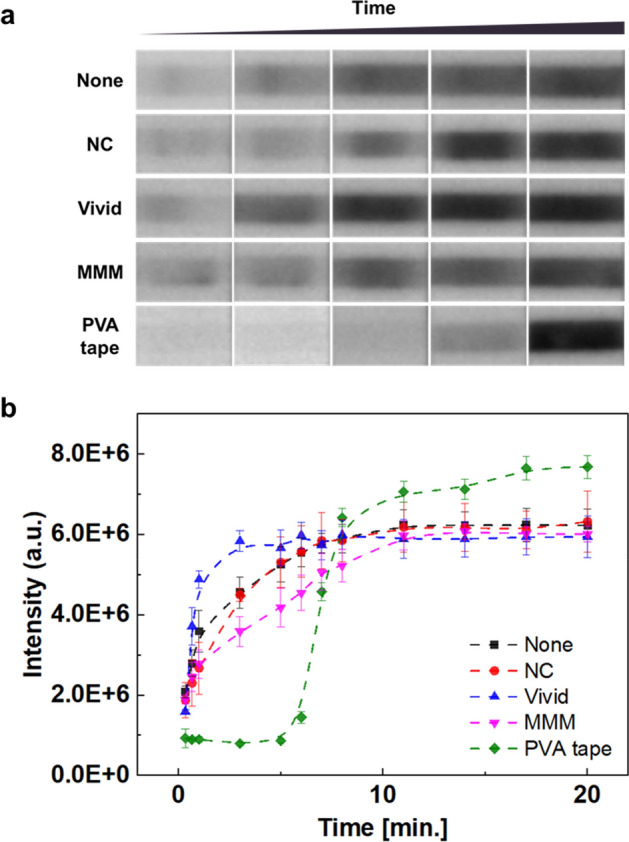
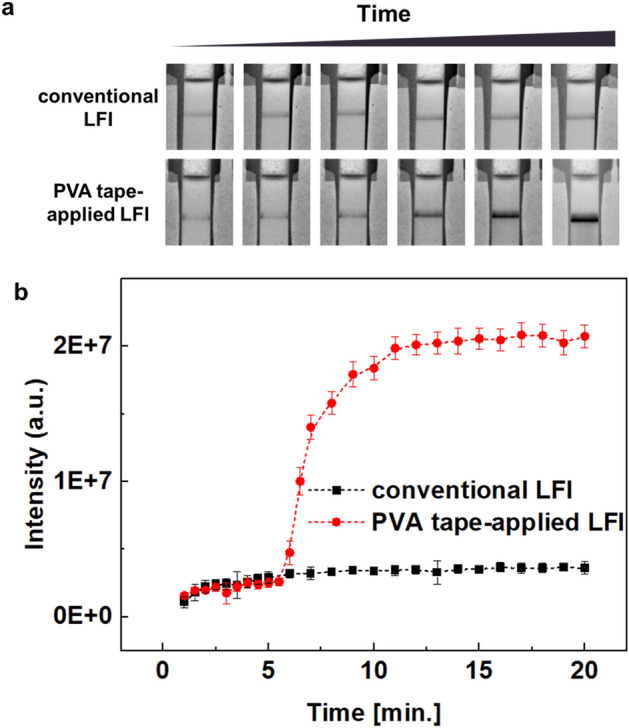
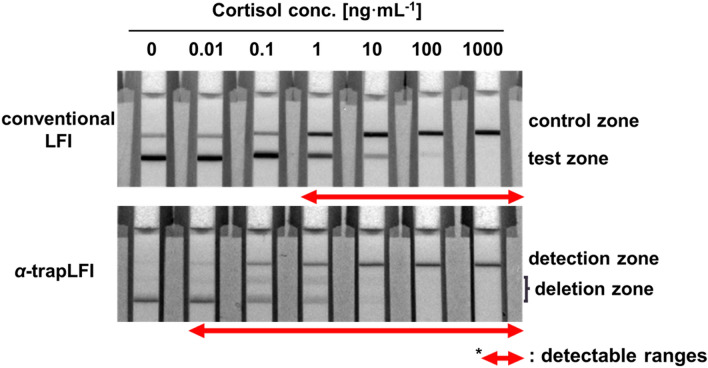
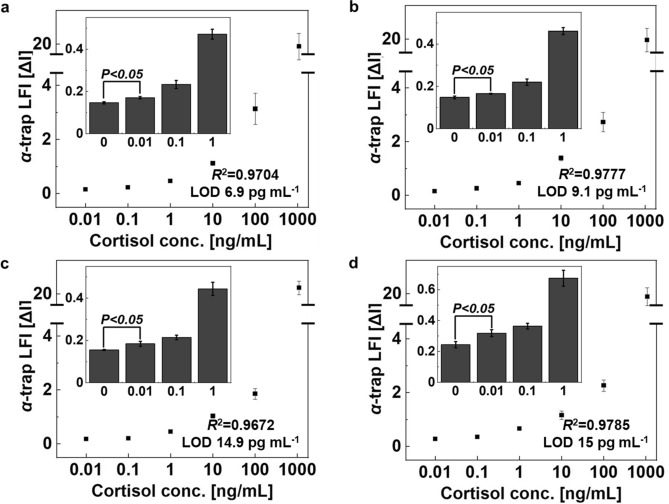
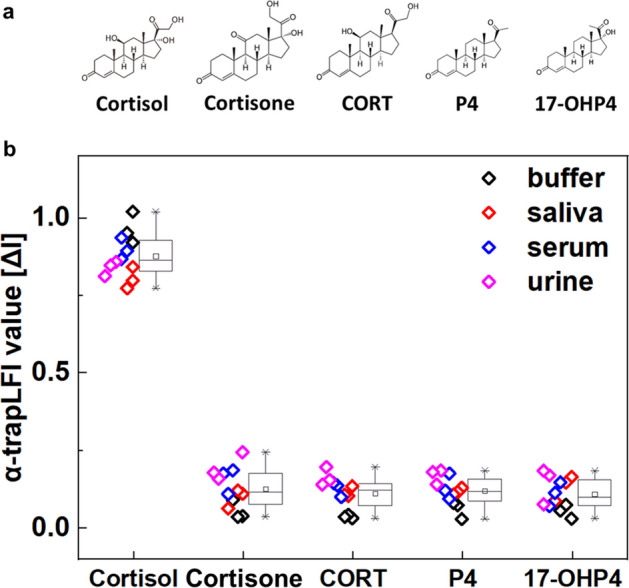
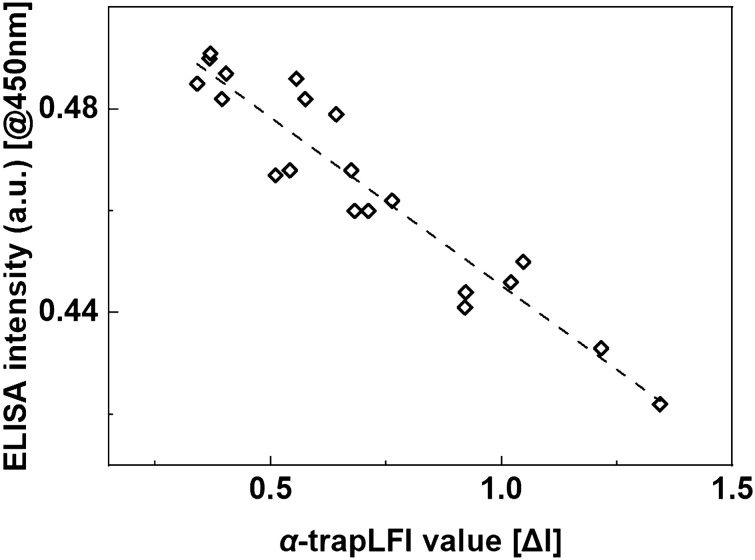
Paper-based biosensors based on lateral flow immunoassay (LFI) are promising candidates for POC diagnosis because of their ease of use and rapid target detection. However, the low sensitivity of LFI limits its application, and signal amplification has been used in numerous studies to increase its sensitivity. We developed an advanced trap LFI (α-trapLFI), a simple-to-use sensor, with an additional step for signal amplification. Here, signal amplification is automatically implemented following delayed release of enhancement solution induced by water-soluble polyvinyl alcohol tape. As the polyvinyl alcohol tape is exposed to water, its polymer structure is perturbed (within 5 min), allowing ions to pass through. This new sensor was designed to have a short time delay between the flow of solutions used for the immunoassay and signal amplification. The α-trapLFI was subsequently used to detect cortisol with high sensitivity (9.1 pg∙mL-1) over a broad detection range (0.01-1000 ng∙mL-1) in bodily fluids. Furthermore, an excellent correlation was obtained by analyzing 20 human real saliva samples using this sensor and a conventional ELISA (R2 = 0.90). The new sensor will be helpful in detecting various small molecules for simple, rapid, and portable POC diagnosis of stress disorders.
© 2021. The Author(s).
Conflict of interest statement
The authors declare no competing interests.
Figures
Similar articles
-
Automatically Signal-Enhanced Lateral Flow Immunoassay for Ultrasensitive Salivary Cortisol Detection.Anal Chem. 2025 Feb 11;97(5):2707-2713. doi: 10.1021/acs.analchem.4c04700. Epub 2025 Feb 2. Anal Chem. 2025. PMID: 39895203 Free PMC article.
-
High sensitive and broad-range detection of cortisol in human saliva using a trap lateral flow immunoassay (trapLFI) sensor.Analyst. 2018 Aug 6;143(16):3883-3889. doi: 10.1039/c8an00719e. Analyst. 2018. PMID: 30022174
-
Paper-Based Analytical Biosensor Chip Designed from Graphene-Nanoplatelet-Amphiphilic-diblock-co-Polymer Composite for Cortisol Detection in Human Saliva.Anal Chem. 2017 Feb 7;89(3):2107-2115. doi: 10.1021/acs.analchem.6b04769. Epub 2017 Jan 19. Anal Chem. 2017. PMID: 28050904
-
Light source-free smartphone detection of salivary cortisol via colorimetric lateral flow immunoassay using a photoluminescent film.Biosens Bioelectron. 2025 Mar 1;271:116971. doi: 10.1016/j.bios.2024.116971. Epub 2024 Nov 20. Biosens Bioelectron. 2025. PMID: 39612559
-
Towards Lateral Flow Quantitative Assays: Detection Approaches.Biosensors (Basel). 2019 Jul 17;9(3):89. doi: 10.3390/bios9030089. Biosensors (Basel). 2019. PMID: 31319629 Free PMC article. Review.
Cited by
-
A dual-color plasmonic immunosensor for salivary cortisol measurement.Nanoscale Adv. 2022 Nov 8;5(2):329-336. doi: 10.1039/d2na00563h. eCollection 2023 Jan 18. Nanoscale Adv. 2022. PMID: 36756275 Free PMC article.
-
Advancements in Cortisol Detection: From Conventional Methods to Next-Generation Technologies for Enhanced Hormone Monitoring.ACS Sens. 2024 Apr 26;9(4):1666-1681. doi: 10.1021/acssensors.3c01912. Epub 2024 Mar 29. ACS Sens. 2024. PMID: 38551608 Free PMC article. Review.
-
Automatically Signal-Enhanced Lateral Flow Immunoassay for Ultrasensitive Salivary Cortisol Detection.Anal Chem. 2025 Feb 11;97(5):2707-2713. doi: 10.1021/acs.analchem.4c04700. Epub 2025 Feb 2. Anal Chem. 2025. PMID: 39895203 Free PMC article.
-
Physisorption of Affinity Ligands Facilitates Extracellular Vesicle Detection with Low Non-Specific Binding to Plasmonic Gold Substrates.ACS Appl Mater Interfaces. 2022 Jun 15;14(23):26548-26556. doi: 10.1021/acsami.2c07317. Epub 2022 Jun 2. ACS Appl Mater Interfaces. 2022. PMID: 35653580 Free PMC article.
-
Post-Assay Chemical Enhancement for Highly Sensitive Lateral Flow Immunoassays: A Critical Review.Biosensors (Basel). 2023 Sep 1;13(9):866. doi: 10.3390/bios13090866. Biosensors (Basel). 2023. PMID: 37754100 Free PMC article. Review.
References
Publication types
MeSH terms
Substances
Grants and funding
LinkOut - more resources
Full Text Sources
Research Materials
