. 2021 Nov 19;4(1):1308.
doi: 10.1038/s42003-021-02807-6.

Manifold learning analysis suggests strategies to align single-cell multimodal data of neuronal electrophysiology and transcriptomics

Affiliations

Manifold learning analysis suggests strategies to align single-cell multimodal data of neuronal electrophysiology and transcriptomics

Jiawei Huang et al. Commun Biol. .

Abstract

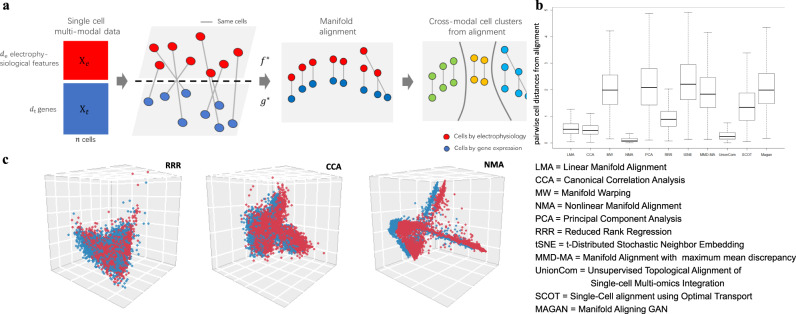
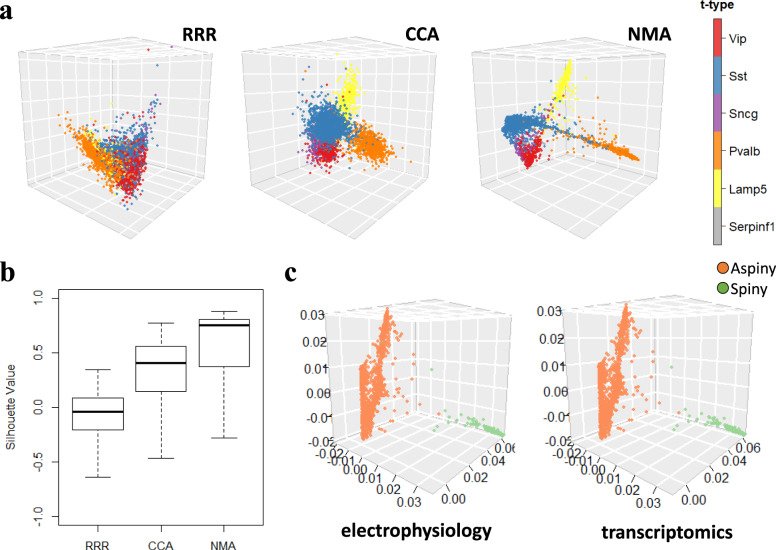
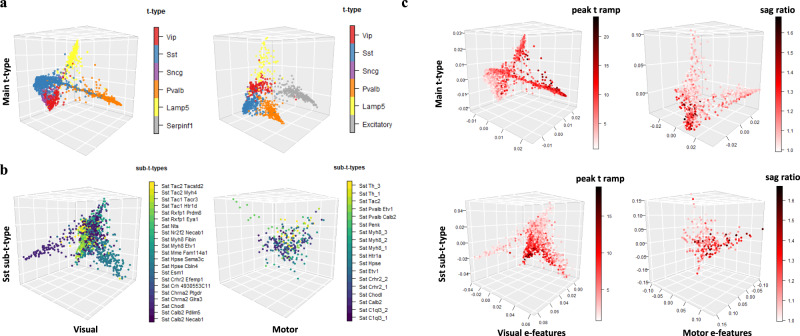
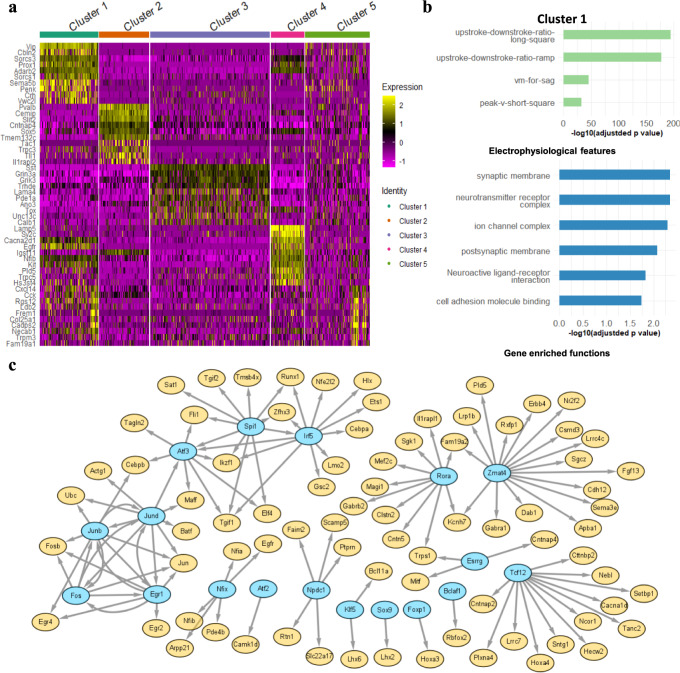
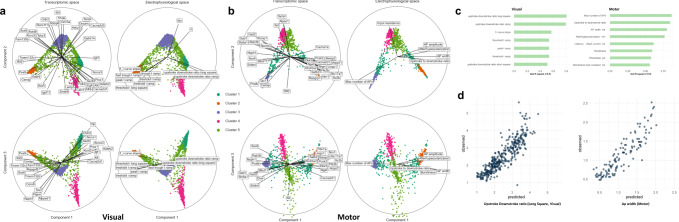
Recent single-cell multimodal data reveal multi-scale characteristics of single cells, such as transcriptomics, morphology, and electrophysiology. However, integrating and analyzing such multimodal data to deeper understand functional genomics and gene regulation in various cellular characteristics remains elusive. To address this, we applied and benchmarked multiple machine learning methods to align gene expression and electrophysiological data of single neuronal cells in the mouse brain from the Brain Initiative. We found that nonlinear manifold learning outperforms other methods. After manifold alignment, the cells form clusters highly corresponding to transcriptomic and morphological cell types, suggesting a strong nonlinear relationship between gene expression and electrophysiology at the cell-type level. Also, the electrophysiological features are highly predictable by gene expression on the latent space from manifold alignment. The aligned cells further show continuous changes of electrophysiological features, implying cross-cluster gene expression transitions. Functional enrichment and gene regulatory network analyses for those cell clusters revealed potential genome functions and molecular mechanisms from gene expression to neuronal electrophysiology.


Conflict of interest statement

The authors declare no competing interests.

Figures

Fig. 1
Fig. 1. Manifold learning aligns single-cell multimodal data and reveals nonlinear relationships between cellular transcriptomics and electrophysiology.
a Manifold learning analysis inputs single-cell multimodal data: Xe, the electrophysiological data (red,de electrophysiological features by n cells) and Xt, the gene expression data (blue, dt genes by n cells). It then aims to find the optimal functions f*(.) and g*(.) to project Xe and Xt onto the same latent space with dimension d. Thus, it reduces the dimensions of multimodal data of n single cells to X~e (d reduced electrophysiological features by n cells) and X~t (dreduced gene expression features by n cells). If manifold learning is used, then the latent space aims to preserve the manifold structures among cells from each modality, i.e., manifold alignment. Finally, it clusters the cells on the latent space to identify cross-modal cell clusters. b Boxplots show the pairwise cell distance (Euclidean Distance) after alignment on the latent space for 3654 neuronal cells (aspiny) in the mouse visual cortex (Methods). The cell coordinates on the latent space are standardized per cell (i.e., each row of X~=[X~e,X~t]) to compare methods. Each box represents one alignment method. The box indicates the lower and upper quantiles of the data, with a horizontal line at the median. The vertical line extended from the boxplot shows a 1.5 interquartile range beyond the 75th percentile or 25th percentile. The machine learning methods for alignment include linear manifold alignment (LMA), nonlinear manifold alignment (NMA), manifold warping (MW), Canonical Correlation Analysis (CCA), Reduced Rank Regression (RRR), Principal Component Analysis (PCA, no alignment), t-SNE (t-Distributed Stochastic Neighbor Embedding, no alignment), MMD-MA (Manifold Alignment with maximum mean discrepancy measurement), unsupervised topological alignment of single-cell multi-omics integration (UnionCom), Single-Cell alignment using Optimal Transport (SCOT), and Manifold Aligning GAN (MAGAN). c The cells on the latent space (3D) after alignment by RRR, CCA, and NMA. The red and blue dots represent the cells from gene expression and electrophysiological data, respectively. The blue dots are drifted −0.05 on the y-axis to show the alignment.
Fig. 2
Fig. 2. Manifold alignment of single-cell multimodalities recovers known cell types.
a Scatterplots show 3645 neuronal cells in the mouse visual cortex from electrophysiological data on the latent spaces (3D) after alignment by Reduced Rank Regression (RRR), Canonical Correlation Analysis (CCA), and Nonlinear Manifold Alignment (NMA). The cells are colored by prior known transcriptomic types (t-types). Red: Vip type; Blue: Sst type; Purple: Sncg type; Orange: Pvalb type; Yellow: Lamp5 type; Gray: Serpinf1 type. The cells from gene expression data on the latent spaces were shown in Fig. S3. b The boxplots show the silhouette values of cells for quantifying how well the coordinates of the cells on the latent spaces correspond to the t-types by RRR, CCA and NMA (Methods). c Scatterplots show neuronal cells in the mouse visual cortex on the latent spaces (3D) after alignment by NMA. Dots are colored according to the reconstructed morphological types (orange: aspiny, lightgreen: spiny).
Fig. 3
Fig. 3. Trajectories across t-types on the latent space after nonlinear manifold alignment along with continuous electrophysiology changes.
a Scatterplots show trajectories across t-types on the latent space (3D used here) after nonlinear manifold alignment of the cells in the visual cortex (left) and motor cortex (right). Cells in shared t-types between two regions are highlighted with the same color for comparison. Red: Vip type; Blue: Sst type; Purple: Sncg type; Orange: Pvalb type; Yellow: Lamp5 type; Gray: other t-types not shared (e.g., Excitatory neurons in the visual cortex). b Scatterplots show trajectories for Sst sub t-types on the latent space (3D used here) after nonlinear manifold alignment of the cells in the visual cortex (left) and motor cortex (right). c Scatterplots show continuous changes of select electrophysiological features in t-types and Sst sub-t-types in the visual cortex (left) and motor cortex (right). The “peak t ramp” is the time taken from membrane potential to AP peak for ramp stimulus.
Fig. 4
Fig. 4. Differentially expressed genes, enrichments, and gene regulatory networks for cross-modal cell clusters.
a The gene expression levels across all 3654 cells for Top 10 differential expressed genes (DEGs) of each cross-modal cell cluster in the mouse visual cortex. The cell clusters were identified by the gaussian mixture model (Methods). The expression levels are normalized (Methods). b The select enriched biological functions and pathways of DEGs (GO and KEGG terms with adjusted p value <0.05) and representative electrophysiological features (adjusted p value <0.05) in Cluster 1 of the mouse visual cortex. c Gene regulatory networks that link transcription factors (TFs, cyan) to target genes (Orange) in Cluster 1 of the mouse visual cortex.
Fig. 5
Fig. 5. Association and prediction of electrophysiological features from gene expression.
a Bibiplots for the mouse visual cortex using the NMA’s latent spaces (first three components used). Cells are dots (n = 3654). Transcriptomic and electrophysiological latent spaces are shown as columns. Each biplot shows the subspace of two components. Cells are colored by their cross-modal clusters. The line length of a gene or electrophysiological feature (i.e., radius) corresponds to its correlation with the latent space with max value = 1. The genes and electrophysiological features with correlations >0.6 are shown here. The label positions are slightly adjusted to avoid overlapping. b Similar to (a) but for the mouse motor cortex (n = 1208). c The representative electrophysiological features in the cross-modal clusters with testing R2 > 0.5 (90% training set, 10% testing set, see Methods). d The predicted values by gene expression (x-axis) vs. the observed values (y-axis) of the upstroke downstroke ratio (R2=0.805) in the visual cortex and the action potential width (R2=0.800) in the mouse motor cortex.

References

    1. Eberwine J, Sul J-Y, Bartfai T, Kim J. The promise of single-cell sequencing. Nat. Methods. 2014;11:25–27. doi: 10.1038/nmeth.2769. - DOI - PubMed
    1. Gouwens NW, et al. Classification of electrophysiological and morphological neuron types in the mouse visual cortex. Nat. Neurosci. 2019;22:1182–1195. doi: 10.1038/s41593-019-0417-0. - DOI - PMC - PubMed
    1. Bomkamp C, et al. Transcriptomic correlates of electrophysiological and morphological diversity within and across excitatory and inhibitory neuron classes. PLoS Comput Biol. 2019;15:e1007113. doi: 10.1371/journal.pcbi.1007113. - DOI - PMC - PubMed
    1. Tripathy SJ, et al. Transcriptomic correlates of neuron electrophysiological diversity. PLoS Comput Biol. 2017;13:e1005814. doi: 10.1371/journal.pcbi.1005814. - DOI - PMC - PubMed
    1. Scala, F. et al. Phenotypic variation of transcriptomic cell types in mouse motor cortex. Nature598, 144–150 (2020). - PMC - PubMed

Publication types