. 2021 Dec 2;81(23):4784-4798.e7.
doi: 10.1016/j.molcel.2021.10.025. Epub 2021 Nov 19.

Conformational surveillance of Orai1 by a rhomboid intramembrane protease prevents inappropriate CRAC channel activation

Affiliations

Conformational surveillance of Orai1 by a rhomboid intramembrane protease prevents inappropriate CRAC channel activation

Adam G Grieve et al. Mol Cell. .

Abstract

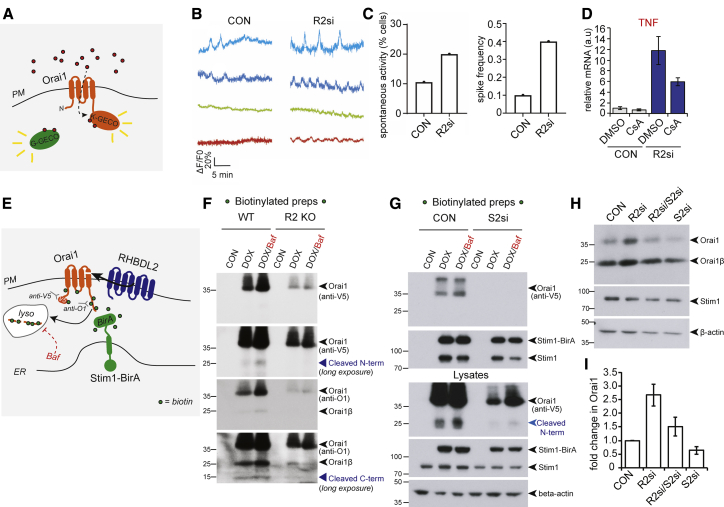
Calcium influx through plasma membrane calcium release-activated calcium (CRAC) channels, which are formed of hexamers of Orai1, is a potent trigger for many important biological processes, most notably in T cell-mediated immunity. Through a bioinformatics-led cell biological screen, we have identified Orai1 as a substrate for the rhomboid intramembrane protease RHBDL2. We show that RHBDL2 prevents stochastic calcium signaling in unstimulated cells through conformational surveillance and cleavage of inappropriately activated Orai1. A conserved disease-linked proline residue is responsible for RHBDL2's recognizing the active conformation of Orai1, which is required to sharpen switch-like signaling triggered by store-operated calcium entry. Loss of RHBDL2 control of CRAC channel activity causes severe dysregulation of downstream CRAC channel effectors, including transcription factor activation, inflammatory cytokine expression, and T cell activation. We propose that this surveillance function may represent an ancient activity of rhomboid proteases in degrading unwanted signaling proteins.

Keywords: CRAC channel; Orai1; RHBDL2; T cell; calcium; rhomboid protease; signalling; transmembrane.


Conflict of interest statement

Declaration of interests The authors declare no competing interests.

Figures

None
Graphical abstract
Figure 1
Figure 1
Orai1 is an RHBDL2 substrate (A) Scheme of the alkaline phosphatase-transmembrane domain (AP-TMD) screen. Each AP-TMD (orange) has a signal sequence for ER insertion. Upon co-expression with RHBDL2 (blue), if AP-TMD is cleaved, it will release AP into the extracellular medium. In the dashed box (E′), the topology of V5-Orai1 is illustrated, indicating the epitopes recognized by antibodies in (E). GA, Golgi apparatus; PM, plasma membrane. For the screen, mouse sequences for RHBDL2 and the candidate TMDs were used. (B–D) HEK293 cells were transfected with pcDNA, 3xHA-RHBDL1-4, or RHBDL2 mutants (S → A or WR → AA) and indicated AP-TMDs for 48 h. Soluble AP is AP with a signal sequence but no TMD. Released AP was collected over the final 16 h of expression. Values represent the level of released AP/total AP (B and D); in (C) these values were converted into a normalized level of “RHBDL2-stimulated AP release” (for each AP-TMD: AP release upon RHBDL2 expression was divided by values taken for pcDNA transfected controls multiplied by 100). All values have AP release with pcDNA subtracted (which is RHBDL2 independent). For the screen, n = 2 biological repeats for each AP-TMD. Error bars indicate SEM. (E) Western blots of lysates from HEK293 cells transfected with V5-hOrai1 and indicated RHBDL2 constructs for 48 h, treated with 100 nM bafilomycin A1 (Baf A1) for 16 h and probed with indicated antibodies. Different full-length forms of Orai1 (Orai1β arises from alternative methionines; Fukushima et al., 2012); cleavage products are indicated by blue arrowheads.
Figure 2
Figure 2
RHBDL2 downregulates CRAC channel activity (A) Overview of the SOCE pathway. Upon depletion of ER Ca2+ stores (red dots) by thapsigargin (step 1), Stim1 (green) oligomerizes and extends into ER-PM contact sites. It traps and nucleates Orai1 (orange) into functional CRAC channels (step 2). For simplicity, Stim1 and Orai1 are illustrated as monomeric. RHBDL2 (blue) cleaves the fourth TMD in Orai1, which anchors the C-terminal Stim1 interaction site. (B) SOCE is monitored by cytosolic Fura-2 fluorescence and compared between control HEK293 cells and those transfected with GFP-RHBDL2 or Orai1 siRNA. Cells were stimulated with 2 μM thapsigargin in Ca2+-free buffer, followed by readmission of 1 mM external Ca2+. (C and D) Aggregate data from cells treated as in (B) are plotted, analyzing the peak Ca2+ level in each condition (C) and rate of Ca2+ entry (D). Each bar in (C) and (D) represents between 34 and 68 cells. (E) Ba2+ entry is compared between cells transfected with empty vector or GFP-RHBDL2, after treatment with 2 μM thapsigargin in Ba2+/Ca2+-free buffer. (F) The rate of Ba2+ entry is plotted; each bar represents between 12 and 19 cells. For two-tailed t tests, ∗∗∗p < 0.001. In bar charts, error bars indicate SEM. (G) PFA-fixed HEK293 cells transfected with NFAT1(1-460)-GFP and indicated RHBDL2/4 constructs were treated with DMSO or 1 μM thapsigargin for 45 min. Single confocal sections of GFP fluorescence are depicted with inverted grayscale lookup tables. Scale bar, 10 μm.
Figure 3
Figure 3
RHBDL2 regulates normal SOCE (A–C) SOCE is monitored by cytosolic Fura-2 fluorescence and compared between wild-type and RHBDL2 mutant HEK293 cells (CRISPR-mediated deletion of the catalytic histidine; R2 KO). Cells were stimulated with 2 μM thapsigargin in Ca2+-free buffer, followed by readmission of external Ca2+. (D–F) Aggregate data from cells treated as in (A)–(C) are plotted, analyzing the peak Ca2+ level in each condition (D), rate of Ca2+ entry (E), and total ER Ca2+released by thapsigargin treatment (F). Each bar in (D)–(F) represents between 11 and 35 cells. (G–I) SOCE monitored as in (A)–(C), but with indicated doses of ATP or bradykinin in place of thapsigargin in (G) and (H), or comparing scrambled siRNA and RHBDL2 siRNA-treated HaCaT cells in (I). Cells were stimulated in Ca2+-free buffer, followed by readmission of 2 mM external Ca2+. (J and K) Aggregate data from cells treated as in (I) are plotted, analyzing the peak Ca2+ level in each condition (J) and rate of Ca2+ entry (K). Each bar in (J) and (K) represents between 22 and 36 cells. For two-tailed t tests, p < 0.05, ∗∗p < 0.01, and ∗∗∗p < 0.001, compared with wild-type or scrambled siRNA controls. Error bars indicate SEM.
Figure 4
Figure 4
RHBDL2 regulates human T cell activation (A) TaqMan assays for RHBDL2 mRNA levels in T cells transduced with virus encoding control or RHBDL2 shRNAs. Error bars represent RQ standard error. (B) T cell activation measured by quantification of surface CD69 expression by fluorescence-activated cell sorting (FACS). CD69 expression is compared between control and RHBDL2 shRNA transduced primary CD4 T cells after stimulation with CD3. Each trace represents three biological replicates. In the dashed box, the calculated EC50 of anti-CD3 for each shRNA. Error indicates SEM. (C) SOCE is monitored by cytosolic Fura-2 fluorescence and compared between control and RHBDL2 shRNA transduced T cells. T cells were stimulated with 2 μM thapsigargin in Ca2+-free buffer, followed by readmission of 2 mM external Ca2+. (D and E) Aggregate data from T cells treated as in (C) are plotted, analyzing the peak Ca2+ level in each condition (D) and rate of Ca2+ entry (E). Each bar in (D) and (E) represents between 34 and 45 cells. For two-tailed t tests, ∗∗∗p < 0.001, compared with control shRNA transduced T cells. Error bars represent SEM.
Figure 5
Figure 5
RHBDL2 controls signaling by optimizing stoichiometry between Orai1 and Stim1 (A) Immunofluorescent labeling of Orai1-myc and LAMP1 in HEK293 cells transfected with indicated siRNA for 72 h and transfected with hOrai1-myc 24 h prior to fixation. Scale bar, 10 μm. (B) Western blots of HaCaT lysates after cells were treated with control or RHBDL1-4 siRNAs for 96 h, labeled for endogenous Orai1, Stim1, and beta-actin. Full-length Orai1 (FL) and Orai1β (FLβ) are indicated by arrowheads. (C) Quantification of the fold change in Orai1 and Stim1 protein abundance, from three independent experiments performed as in (B). Error bars represent SEM. (D) Western blots of HEK293T lysates after cells were treated with control or RHBDL1-4 siRNAs for 72 h, expressing V5-hOrai1 for the final 24 h. Full-length Orai1 (FL) and Orai1β (FLβ) are indicated by arrowheads. (E) SOCE is compared between wild-type (WT) and RHBDL2 KO HEK293 cells overexpressing GFP or Stim1-YFP. Cells were stimulated with 2 μM thapsigargin in Ca2+-free buffer, followed by readmission of 2 mM external Ca2+. (F) Aggregate data from cells treated as in (E) are plotted, analyzing the rate of Ca2+ entry. Each bar in (F) represents between 29 and 46 cells. For two-tailed t tests, ∗∗p < 0.001 and ∗∗∗p < 0.001, compared with wild-type. Error bars represent SEM.
Figure 6
Figure 6
RHBDL2 prevents inappropriate CRAC channel activation in resting cells (A) Scheme of the hOrai1-K-GECO and Cyto-G-GECO reporter assay for spontaneous CRAC channel activity. K-GECO fluorescence is a measure of CRAC channel activity; G-GECO fluorescence is a measure of global cytoplasmic Ca2+ fluctuations. (B) Four representative line traces of K-GECO fluorescence in single HaCaT cells treated with control siRNA or RHBDL2 siRNA. Spontaneous CRAC channel activation is defined as a >20% increase in the peak amplitude (ΔF/F0). (C) Quantification of spontaneous CRAC channel activity, defined as a >20% increase above the baseline K-GECO fluorescence (see Figure S4C). Quantification of the percentage of cells displaying spontaneous CRAC channel activity (38 individual cells analyzed in control, 45 individual cells analyzed in RHBDL2 siRNA cells), and the K-GECO fluorescence spike frequency (number of spontaneous CRAC channel activity events over 10 min, relative to the number of cells). (D) TaqMan assay for TNF-alpha in HaCaT cells treated with control or RHBDL2 siRNAs for 48 h. Cyclosporin A (1 μm) was added for the final 24 h. Error bars represent RQ standard error. Each bar represents one of at least four biological replicates. (E) A scheme of the Stim1-BirA experiment in (F) and (G), illustrating the biotinylation of V5-hOrai1 (orange) by Stim1-BirA (green) at PM-ER contact sites, and the consequence of RHBDL2 (blue) activity. Biotin is indicated by green dots. For simplicity, Stim1 and Orai1 are illustrated as monomeric. (F and G) Western blots of neutravidin agarose-based biotin preparations (in F and G, upper) and total cell lysates (in G, lower) from wild-type (WT) or RHBDL2 knockout (R2 KO) HaCaT cells. The expression of V5-hOrai1 and Stim1-BirA was induced with doxycycline (DOX; 250 μg/mL final) for 96 h in the presence of 50 μm biotin. Six hours prior to lysis, bafilomycin A1 (BAF; 100 nm final) was added to block lysosomal degradation. In (G), cells were treated twice with Stim2 siRNAs for 96 h prior to lysis. Blots were probed for the N-terminal or C-terminal epitopes recognized by V5 and O1 antibodies, respectively. Stim1 and Stim1-BirA were probed for using an anti-Stim1 antibody. Different full-length forms of Orai1 and their cleavage products are indicated by the blue arrowheads. (H) Western blots of HaCaT lysates after treatment with control and RHBDL2 siRNA for 72 h, and when used, Stim2 siRNA for 96 h, labeled for endogenous Orai1, Stim1, and beta-actin. Full-length Orai1 (FL) and Orai1β (FLβ) are indicated by arrowheads. (I) Quantification of the fold change in Orai1 protein abundance, from three independent experiments performed as in (H). Error bars represent SEM.
Figure 7
Figure 7
RHBDL2 recognition of Orai1 is sensitive to calcium and conformationally determined (A–D) HA immunoprecipitates (IP) and inputs from HEK293 cells transiently expressing WT or SA mutant 3xHA-RHBDL2 and wild-type or mutant V5-hOrai for 24 h were immunoblotted for V5, HA, and beta-actin. In (D), 5 min prior to lysis, cells were washed in PBS and incubated with external solution containing 2 mM Ca2+ or Ca2+-free solution containing 1 mM EGTA. This panel is representative of at least three separate repeat results for each Orai1 construct. (E) Structures of Drosophila Orai WT (left) or Orai H206A (right), highlighting the accessibility of the fourth TMD and the large change in conformation around the Drosophila equivalent of proline-245 in human Orai1. (F) HA immunoprecipitates (IP) and inputs from HEK293 cells transiently expressing 3xHA-RHBDL2 SA and wild-type or mutant V5-hOrai for 24 h were immunoblotted for V5, HA, and beta-actin. (G) Lysates from HEK293 cells transiently expressing pcDNA3.1 or WT 3xHA-RHBDL2 and wild-type or mutant forms of V5-hOrai for 24 h were immunoblotted for V5, HA, and beta-actin. (H) HEK293 cells were transfected with pcDNA, 3xHA-RHBDL2 or RHBDL2 SA, and AP-TMD4 or AP-TMD P245L from hOrai1 for 48 h. Released AP was collected over the final 16 h. Values represent the level of released alkaline phosphatase/total alkaline phosphatase. Error bars represent SEM.

Comment in

Similar articles

Cited by

References

    1. Adrain C., Strisovsky K., Zettl M., Hu L., Lemberg M.K., Freeman M. Mammalian EGF receptor activation by the rhomboid protease RHBDL2. EMBO Rep. 2011;12:421–427. - PMC - PubMed
    1. Akiyama Y., Maegawa S. Sequence features of substrates required for cleavage by GlpG, an Escherichia coli rhomboid protease. Mol. Microbiol. 2007;64:1028–1037. - PubMed
    1. Baker R.P., Urban S. Cytosolic extensions directly regulate a rhomboid protease by modulating substrate gating. Nature. 2015;523:101–105. - PMC - PubMed
    1. Bakowski D., Parekh A.B. Voltage-dependent Ba2+ permeation through store-operated CRAC channels: implications for channel selectivity. Cell Calcium. 2007;42:333–339. - PubMed
    1. Bassett A.R., Tibbit C., Ponting C.P., Liu J.L. Highly efficient targeted mutagenesis of Drosophila with the CRISPR/Cas9 system. Cell Rep. 2013;4:220–228. - PMC - PubMed

Publication types

MeSH terms

LinkOut - more resources