

Impact of the COVID-19 pandemic on emergency department attendances and acute medical admissions
- PMID: 34800973
- PMCID: PMC8605447
- DOI: 10.1186/s12873-021-00529-w
Impact of the COVID-19 pandemic on emergency department attendances and acute medical admissions
Abstract
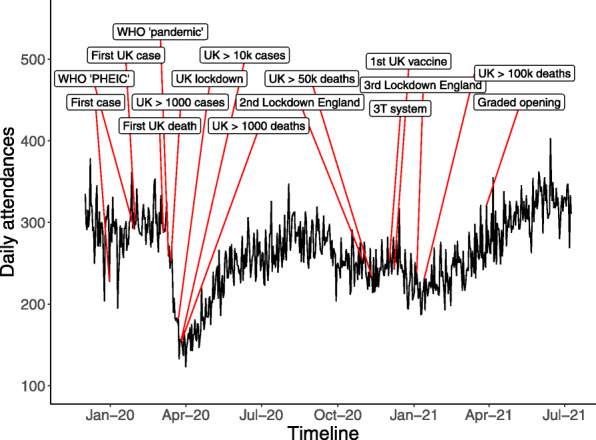
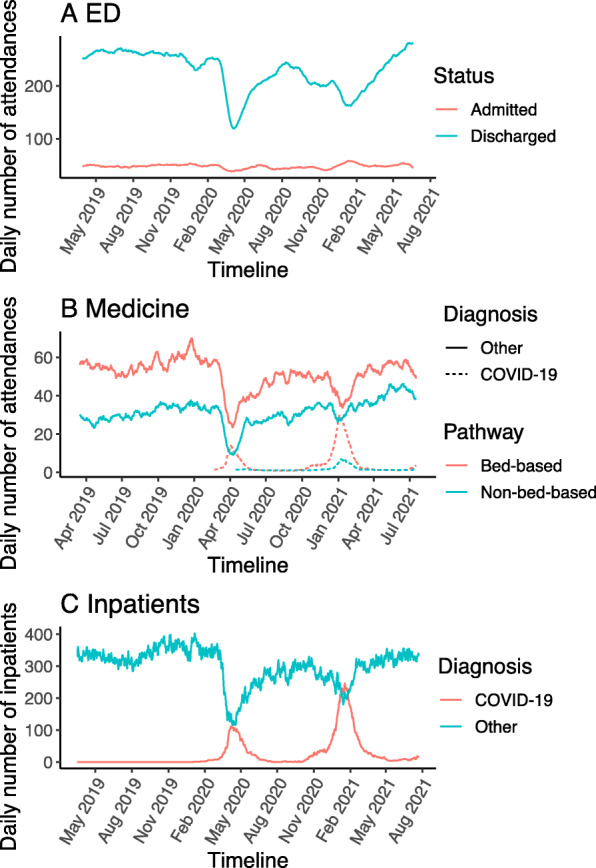
Background: To better understand the impact of the COVID-19 pandemic on hospital healthcare, we studied activity in the emergency department (ED) and acute medicine department of a major UK hospital.
Methods: Electronic patient records for all adult patients attending ED (n = 243,667) or acute medicine (n = 82,899) during the pandemic (2020-2021) and prior year (2019) were analysed and compared. We studied parameters including severity, primary diagnoses, co-morbidity, admission rate, length of stay, bed occupancy, and mortality, with a focus on non-COVID-19 diseases.
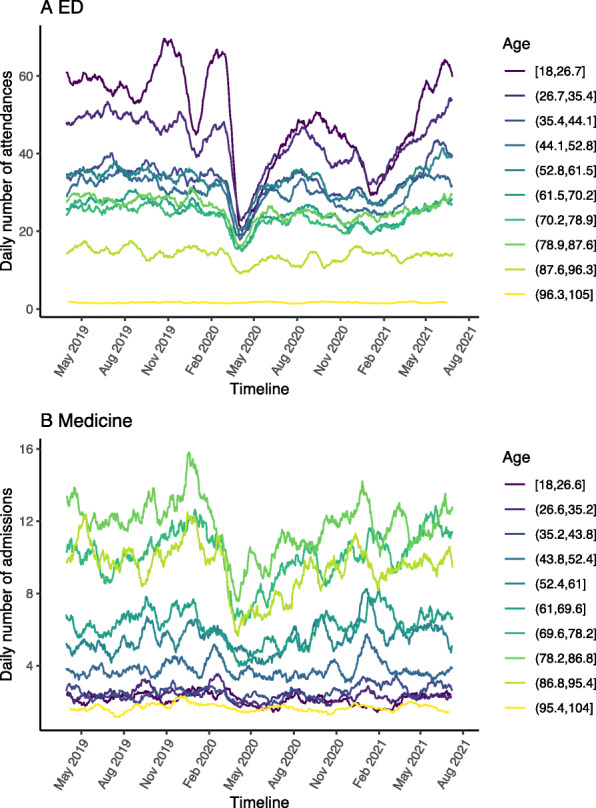
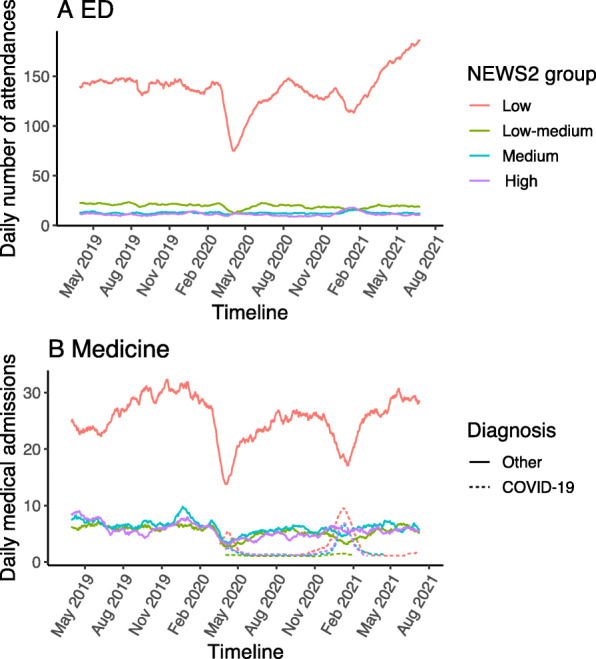
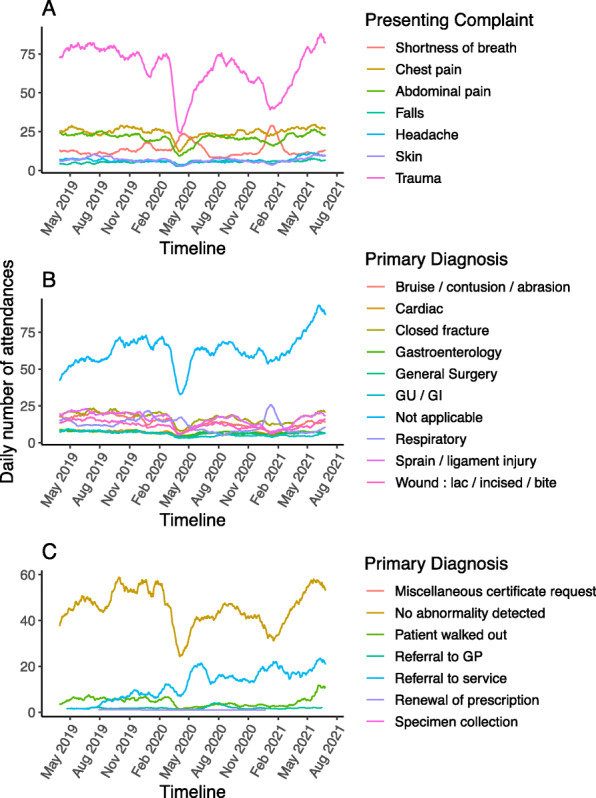
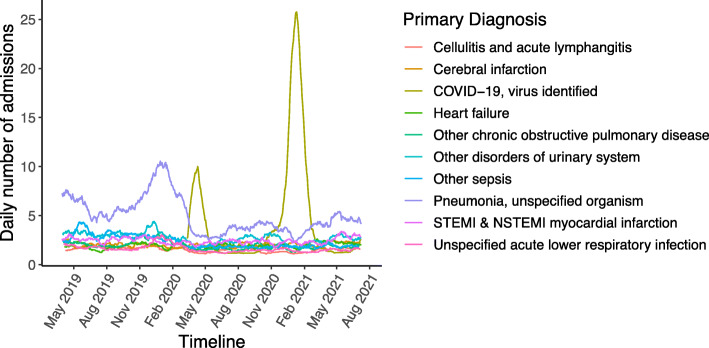
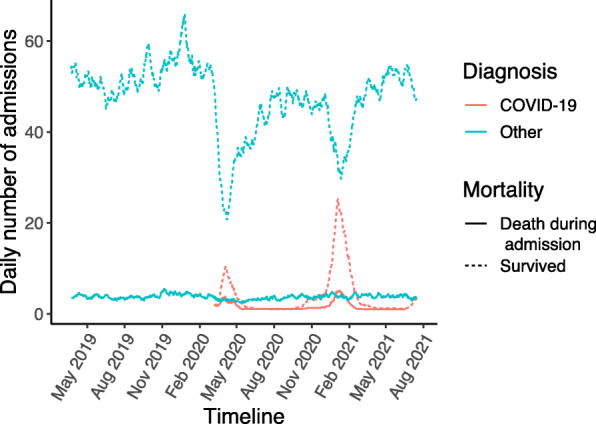
Results: During the first wave of the pandemic, daily ED attendance fell by 37%, medical admissions by 30% and medical bed occupancy by 27%, but all returned to normal within a year. ED attendances and medical admissions fell across all age ranges; the greatest reductions were seen for younger adults in ED attendances, but in older adults for medical admissions. Compared to non-COVID-19 pandemic admissions, COVID-19 admissions were enriched for minority ethnic groups, for dementia, obesity and diabetes, but had lower rates of malignancy. Compared to the pre-pandemic period, non-COVID-19 pandemic admissions had more hypertension, cerebrovascular disease, liver disease, and obesity. There were fewer low severity ED attendances during the pandemic and fewer medical admissions across all severity categories. There were fewer ED attendances with common non-respiratory illnesses including cardiac diagnoses, but no change in cardiac arrests. COVID-19 was the commonest diagnosis amongst medical admissions during the first wave and there were fewer diagnoses of pneumonia, myocardial infarction, heart failure, cellulitis, chronic obstructive pulmonary disease, urinary tract infection and other sepsis, but not stroke. Levels had rebounded by a year later with a trend to higher levels of stroke than before the pandemic. During the pandemic first wave, 7-day mortality was increased for ED attendances, but not for non-COVID-19 medical admissions.
Conclusions: Reduced ED attendances in the first wave of the pandemic suggest opportunities for reducing low severity presentations to ED in the future, but also raise the possibility of harm from delayed or missed care. Reassuringly, recent rises in attendance and admissions indicate that any deterrent effect of the pandemic on attendance is diminishing.
Keywords: Acute medicine; COVID-19; Emergency department; Hospital admissions; Non-COVID-19 disease.
© 2021. The Author(s).
Conflict of interest statement
The authors declare that they have no competing interests.
Figures
References
-
- UK Government 2020, Coronavirus (COVID-19) in the UK; viewed 1 October 2021. https://coronavirus.data.gov.uk.
-
- Simon S. 2020, Second Phase of NHS response to COVID-19: Letter from Simon Stevens and Amanda Pritchard; viewed 1 October 2021. https://www.england.nhs.uk/coronavirus/publication/second-phase-of-nhs-r....
-
- Rosenberg ES, Dufort EM, Blog DS, Hall EW, Hoefer D, Backenson BP, Muse AT, Kirkwood JN, St. George K, Holtgrave DR, Hutton BJ, Zucker HA, New York State Coronavirus 2019 Response Team. Anand M, Kaufman A, Kuhles D, Maxted A, Newman A, Pulver W, Smith L, Sommer J, White J, Dean A, Derbyshire V, Egan C, Fuschino M, Griesemer S, Hull R, Lamson D, Laplante J, McDonough K, Mitchell K, Musser K, Nazarian E, Popowich M, Taylor J, Walsh A, Amler S, Huang A, Recchia R, Whalen E, Lewis E, Friedman C, Carrera S, Eisenstein L, DeSimone A, Morne J, Johnson M, Navarette K, Kumar J, Ostrowski S, Mazeau A, Dreslin S, Yates N, Greene D, Heslin E, Lutterloh E, Rosenthal E, Barranco M, Anand M, Kaufman A, Kuhles D, Maxted A, Newman A, Pulver W, Smith L, Sommer J, White J, Dean A, Derbyshire V, Egan C, Fuschino M, Griesemer S, Hull R, Lamson D, Laplante J, McDonough K, Mitchell K, Musser K, Nazarian E, Popowich M, Taylor J, Walsh A, Amler S, Huang A, Recchia R, Whalen E, Lewis E, Friedman C, Carrera S, Eisenstein L, DeSimone A, Morne J, Johnson M, Navarette K, Kumar J, Ostrowski S, Mazeau A, Dreslin S, Yates N, Greene D, Heslin E, Lutterloh E, Rosenthal E, Barranco M. COVID-19 testing, epidemic features, hospital outcomes, and household prevalence, New York state-march 2020. Clin Infect Dis. 2020;71(8):1953–1959. doi: 10.1093/cid/ciaa549. - DOI - PMC - PubMed
Publication types
MeSH terms
LinkOut - more resources
Full Text Sources
Medical
