

Accounting for space, time, and behavior using GPS derived dynamic measures of environmental exposure
- PMID: 34801405
- PMCID: PMC9129269
- DOI: 10.1016/j.healthplace.2021.102706
Accounting for space, time, and behavior using GPS derived dynamic measures of environmental exposure
Abstract
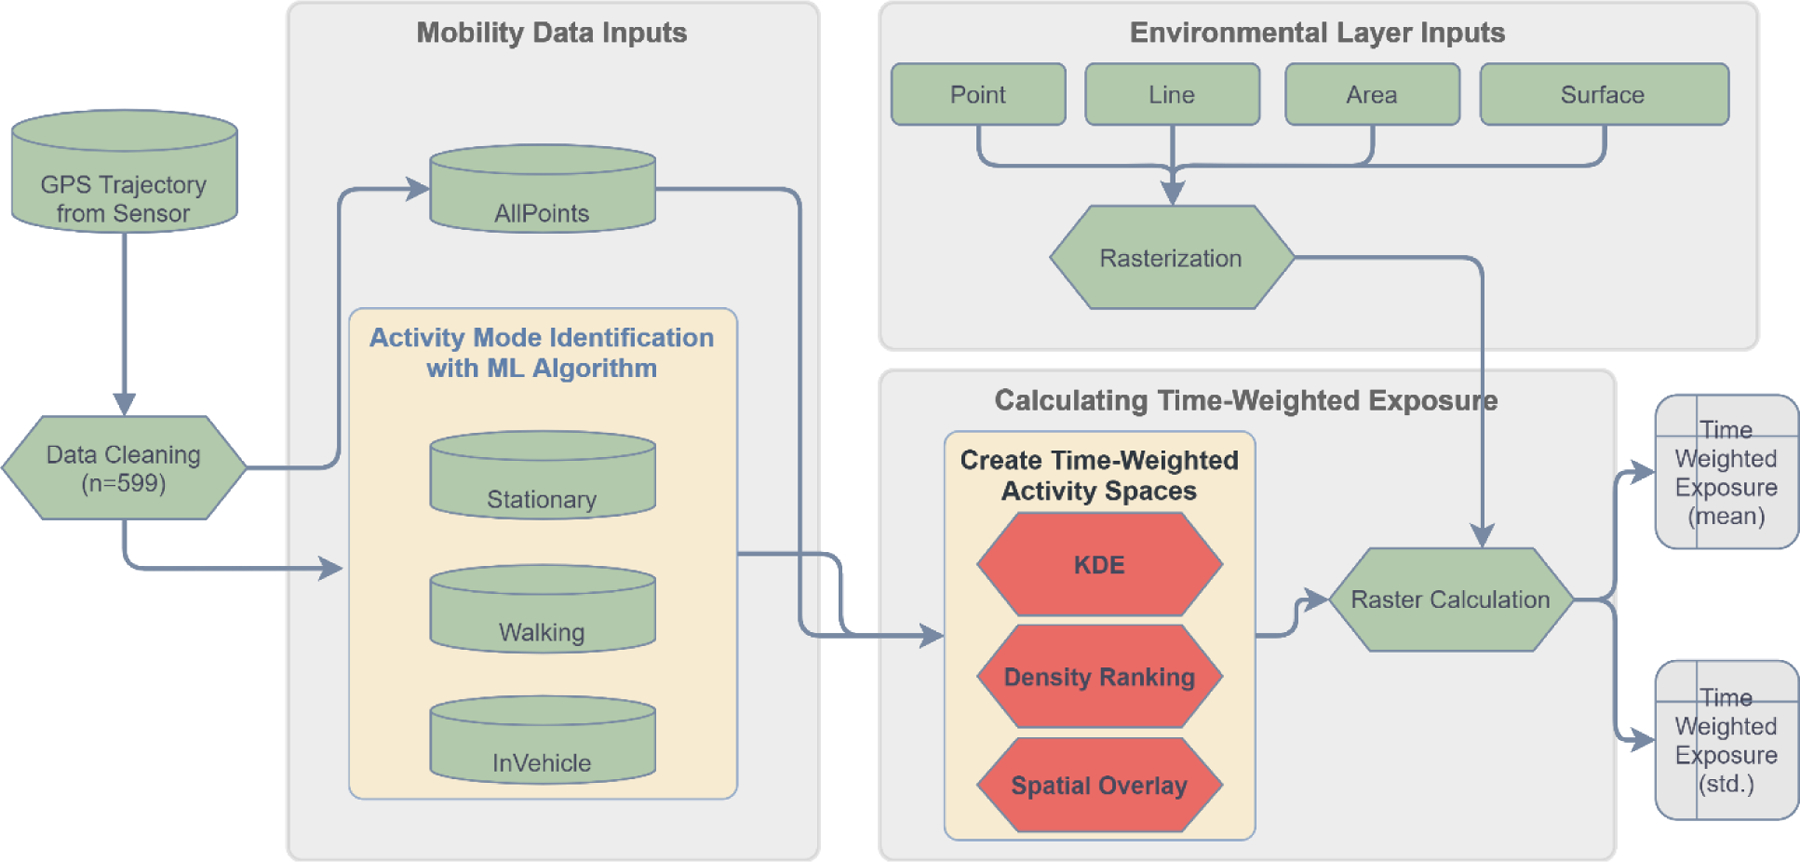
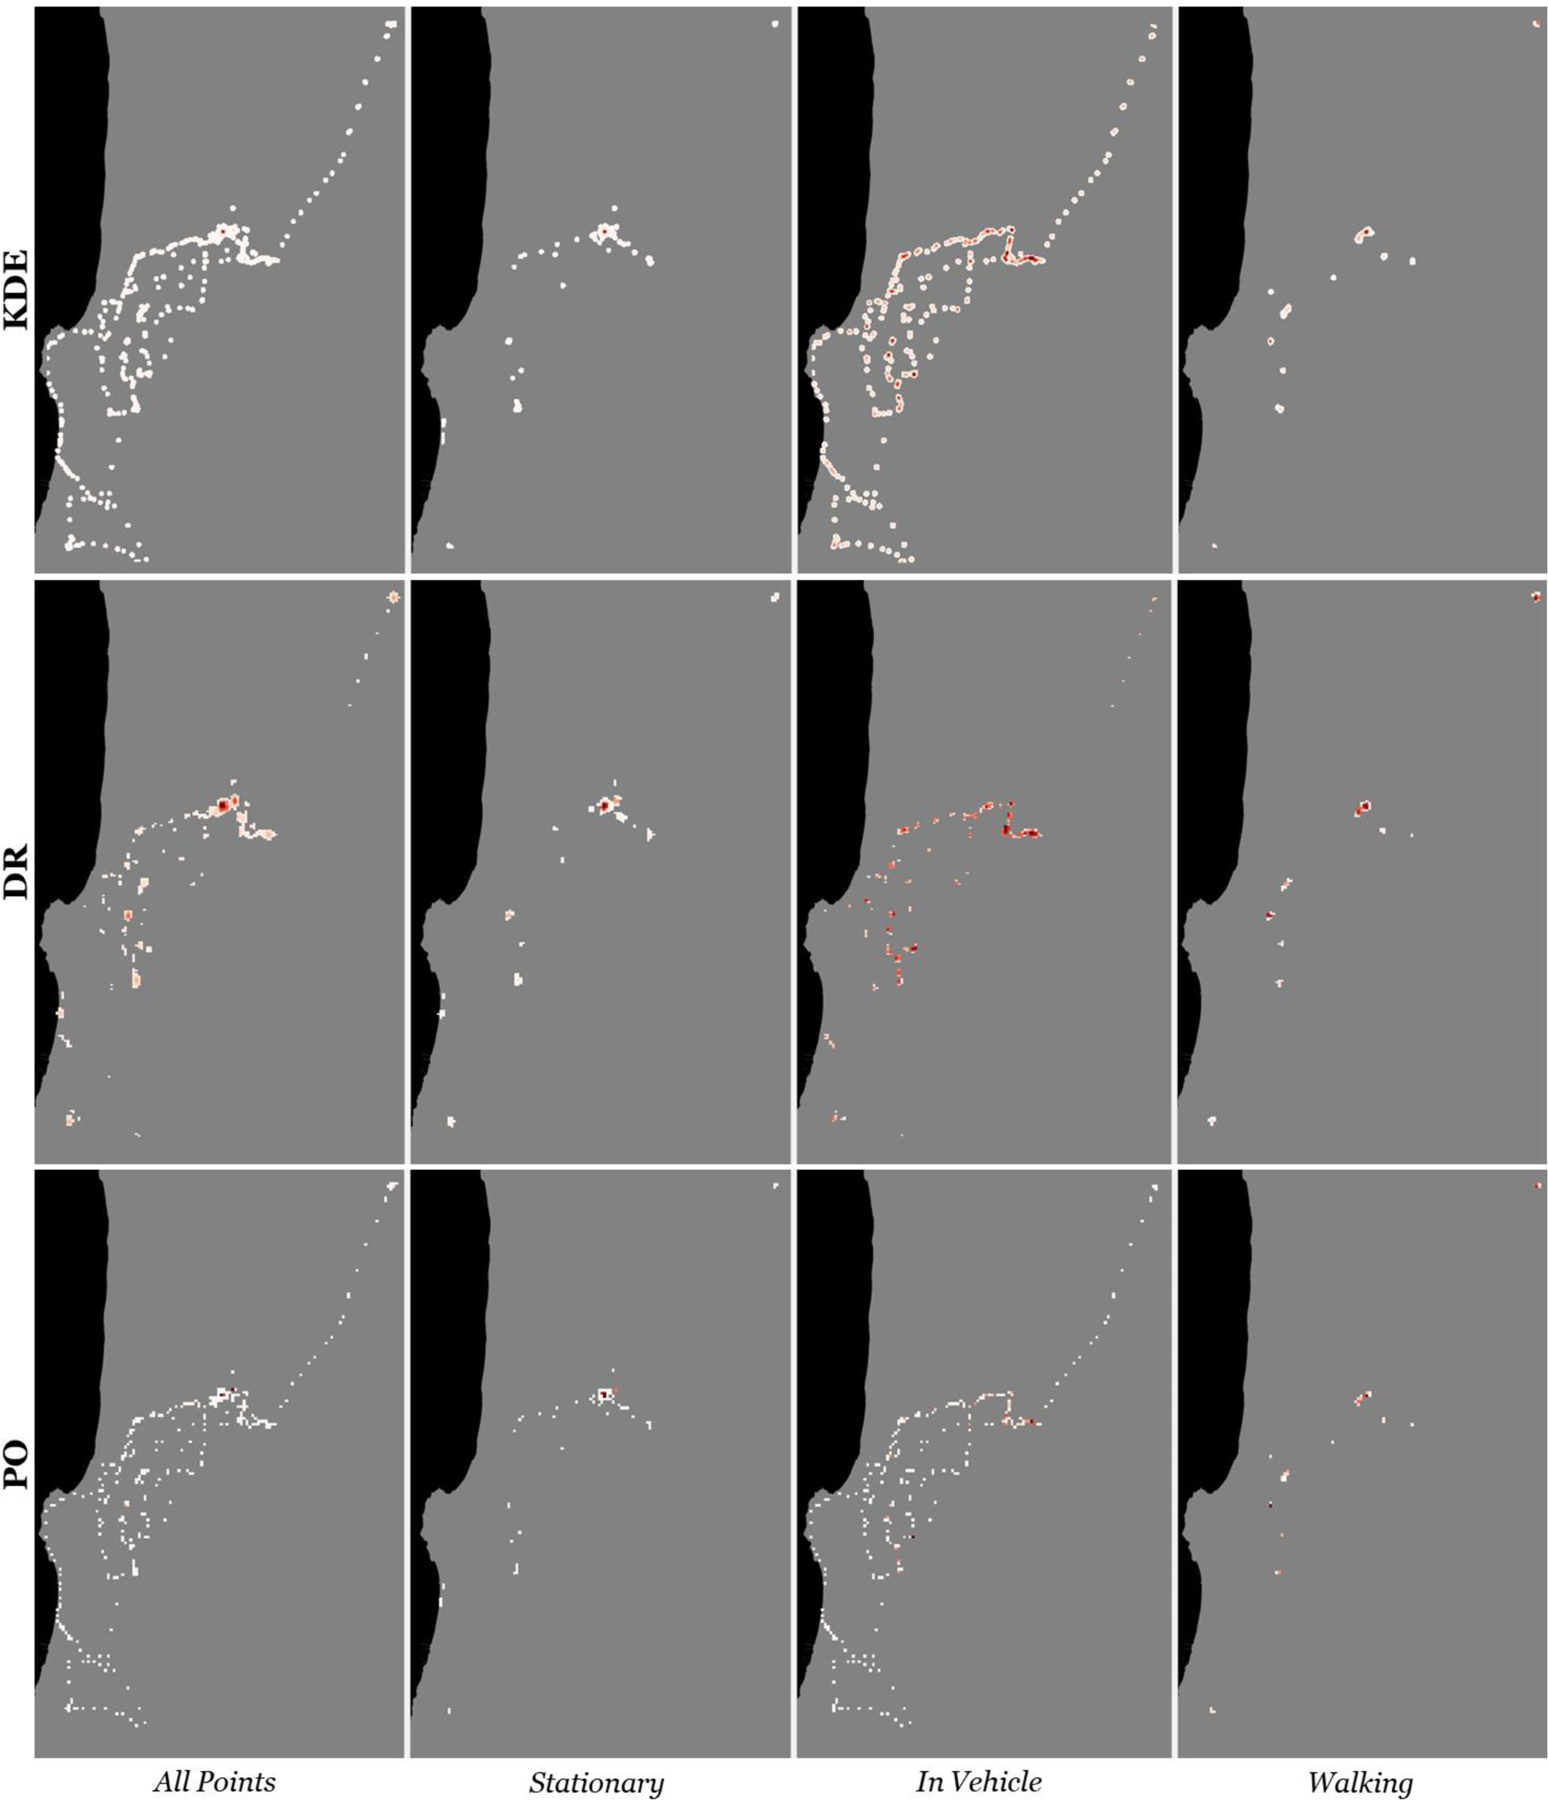
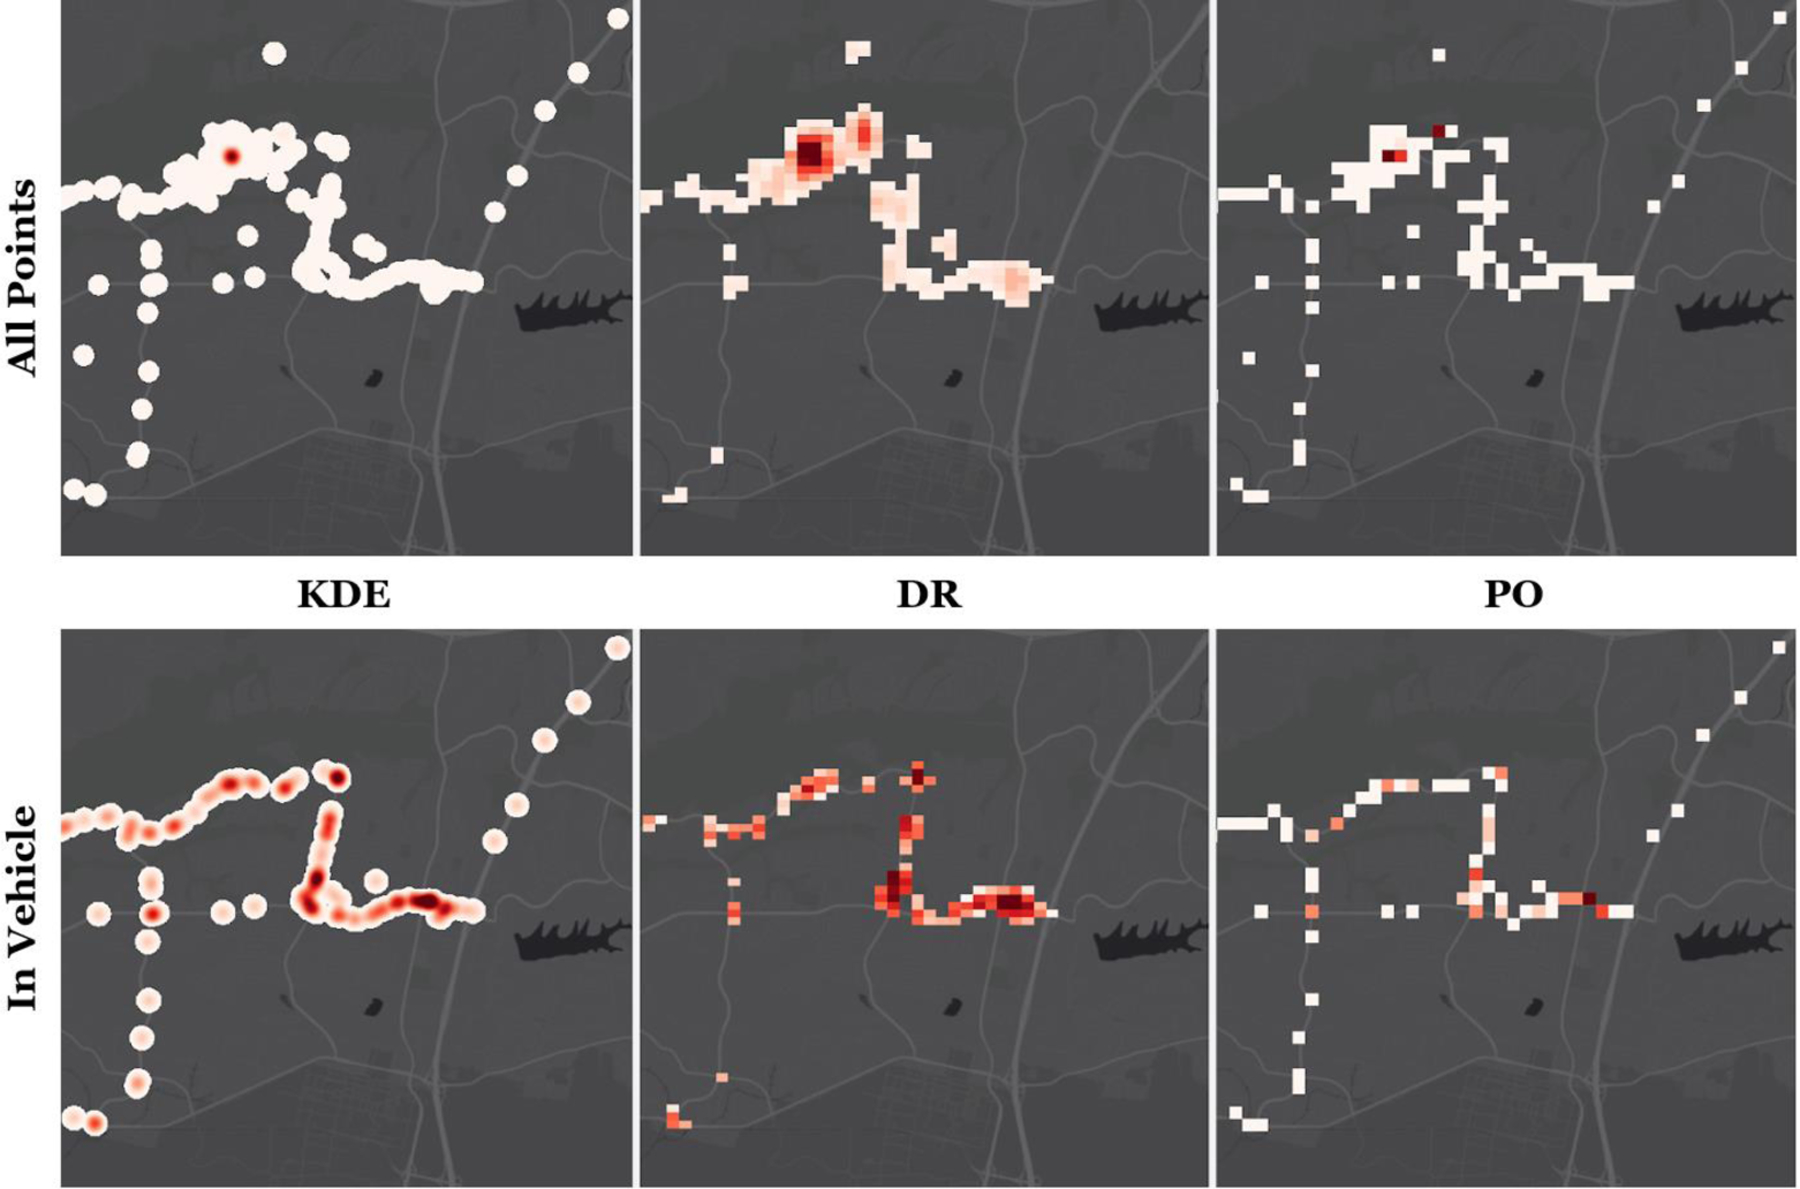
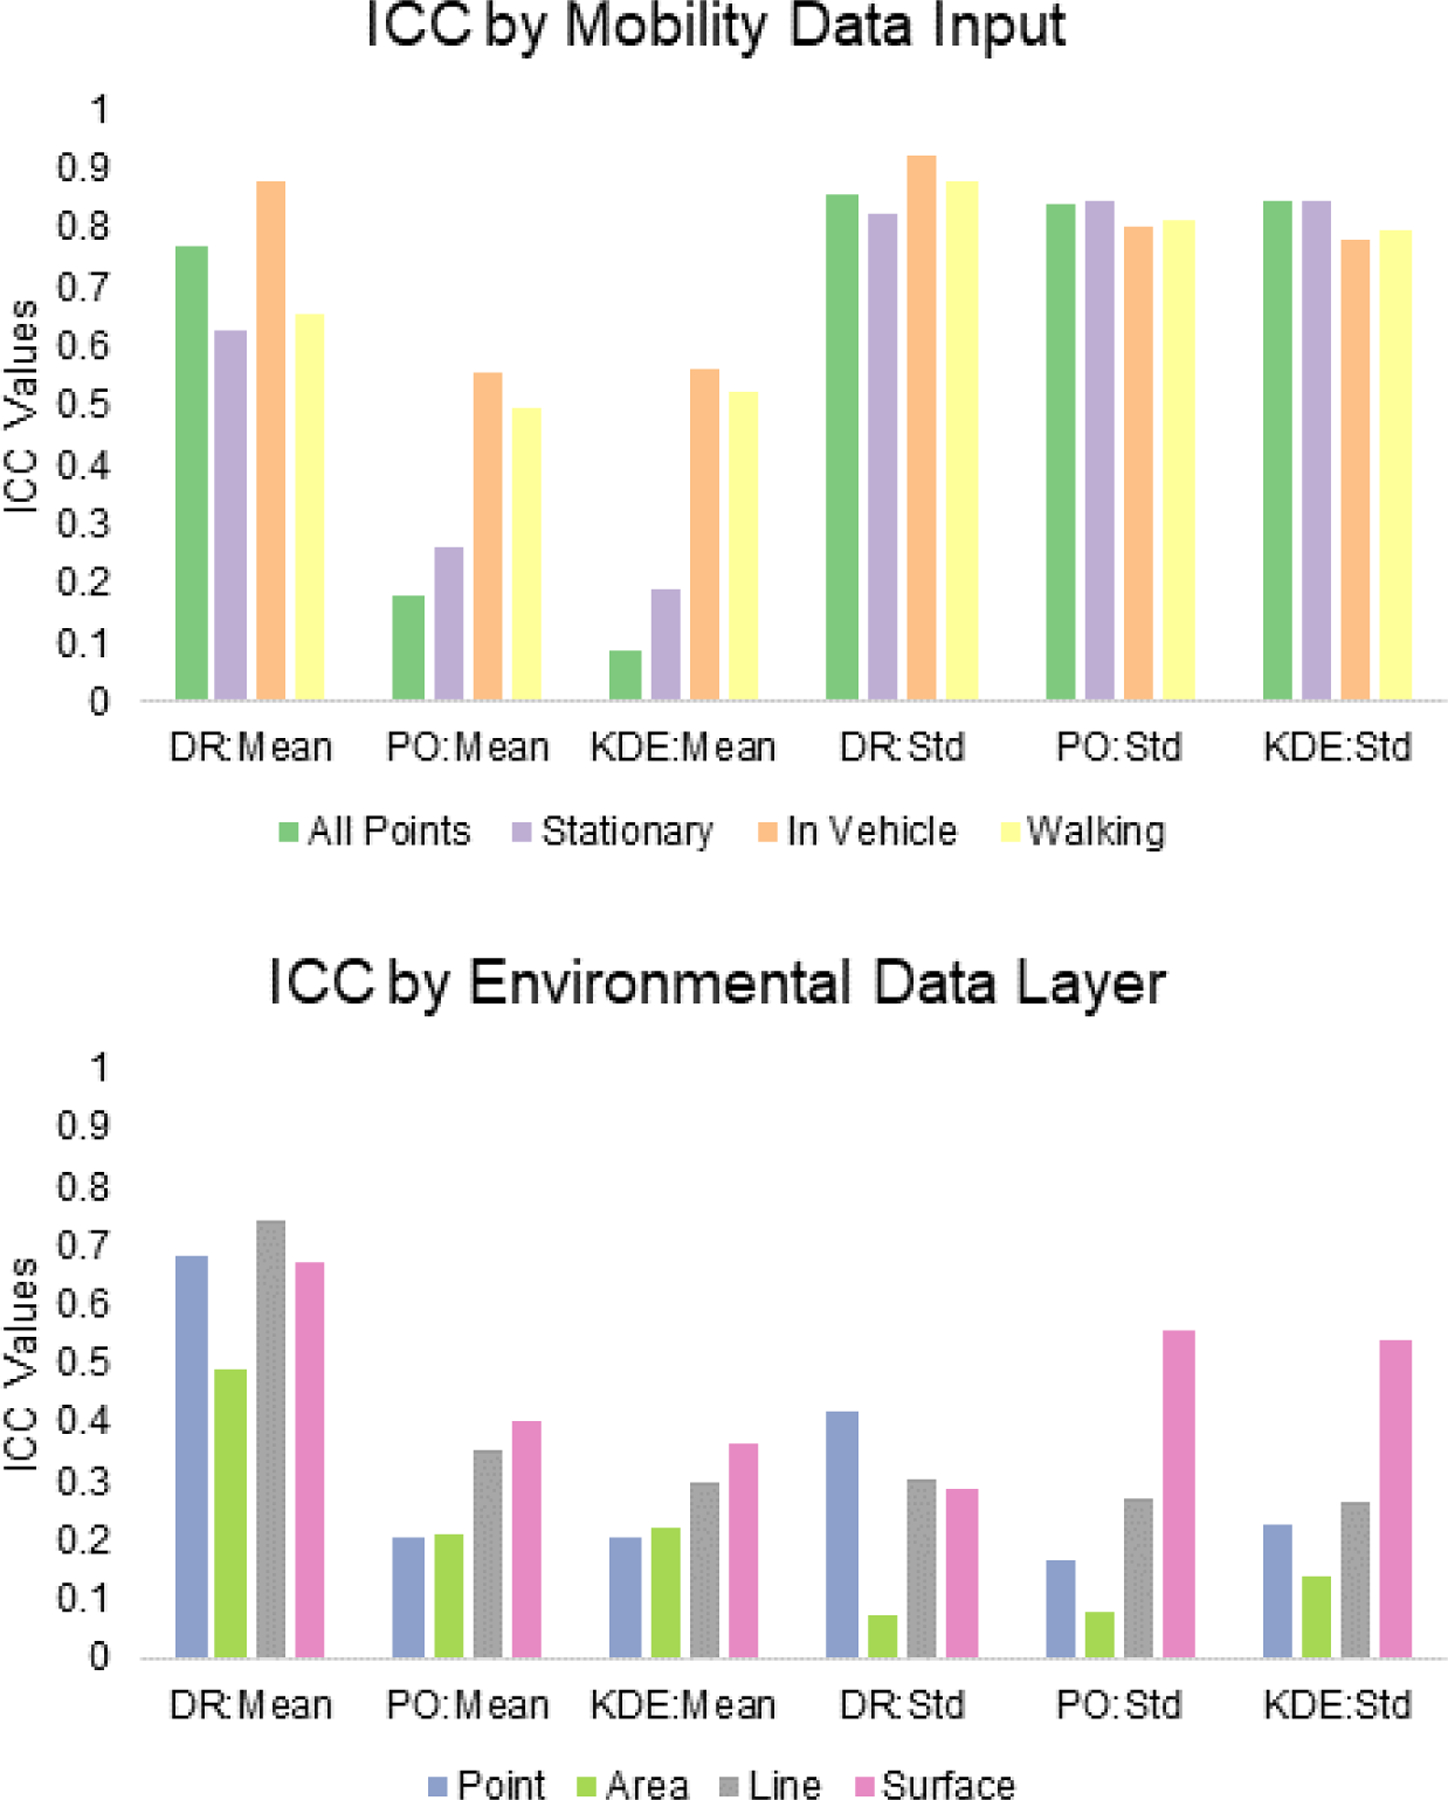
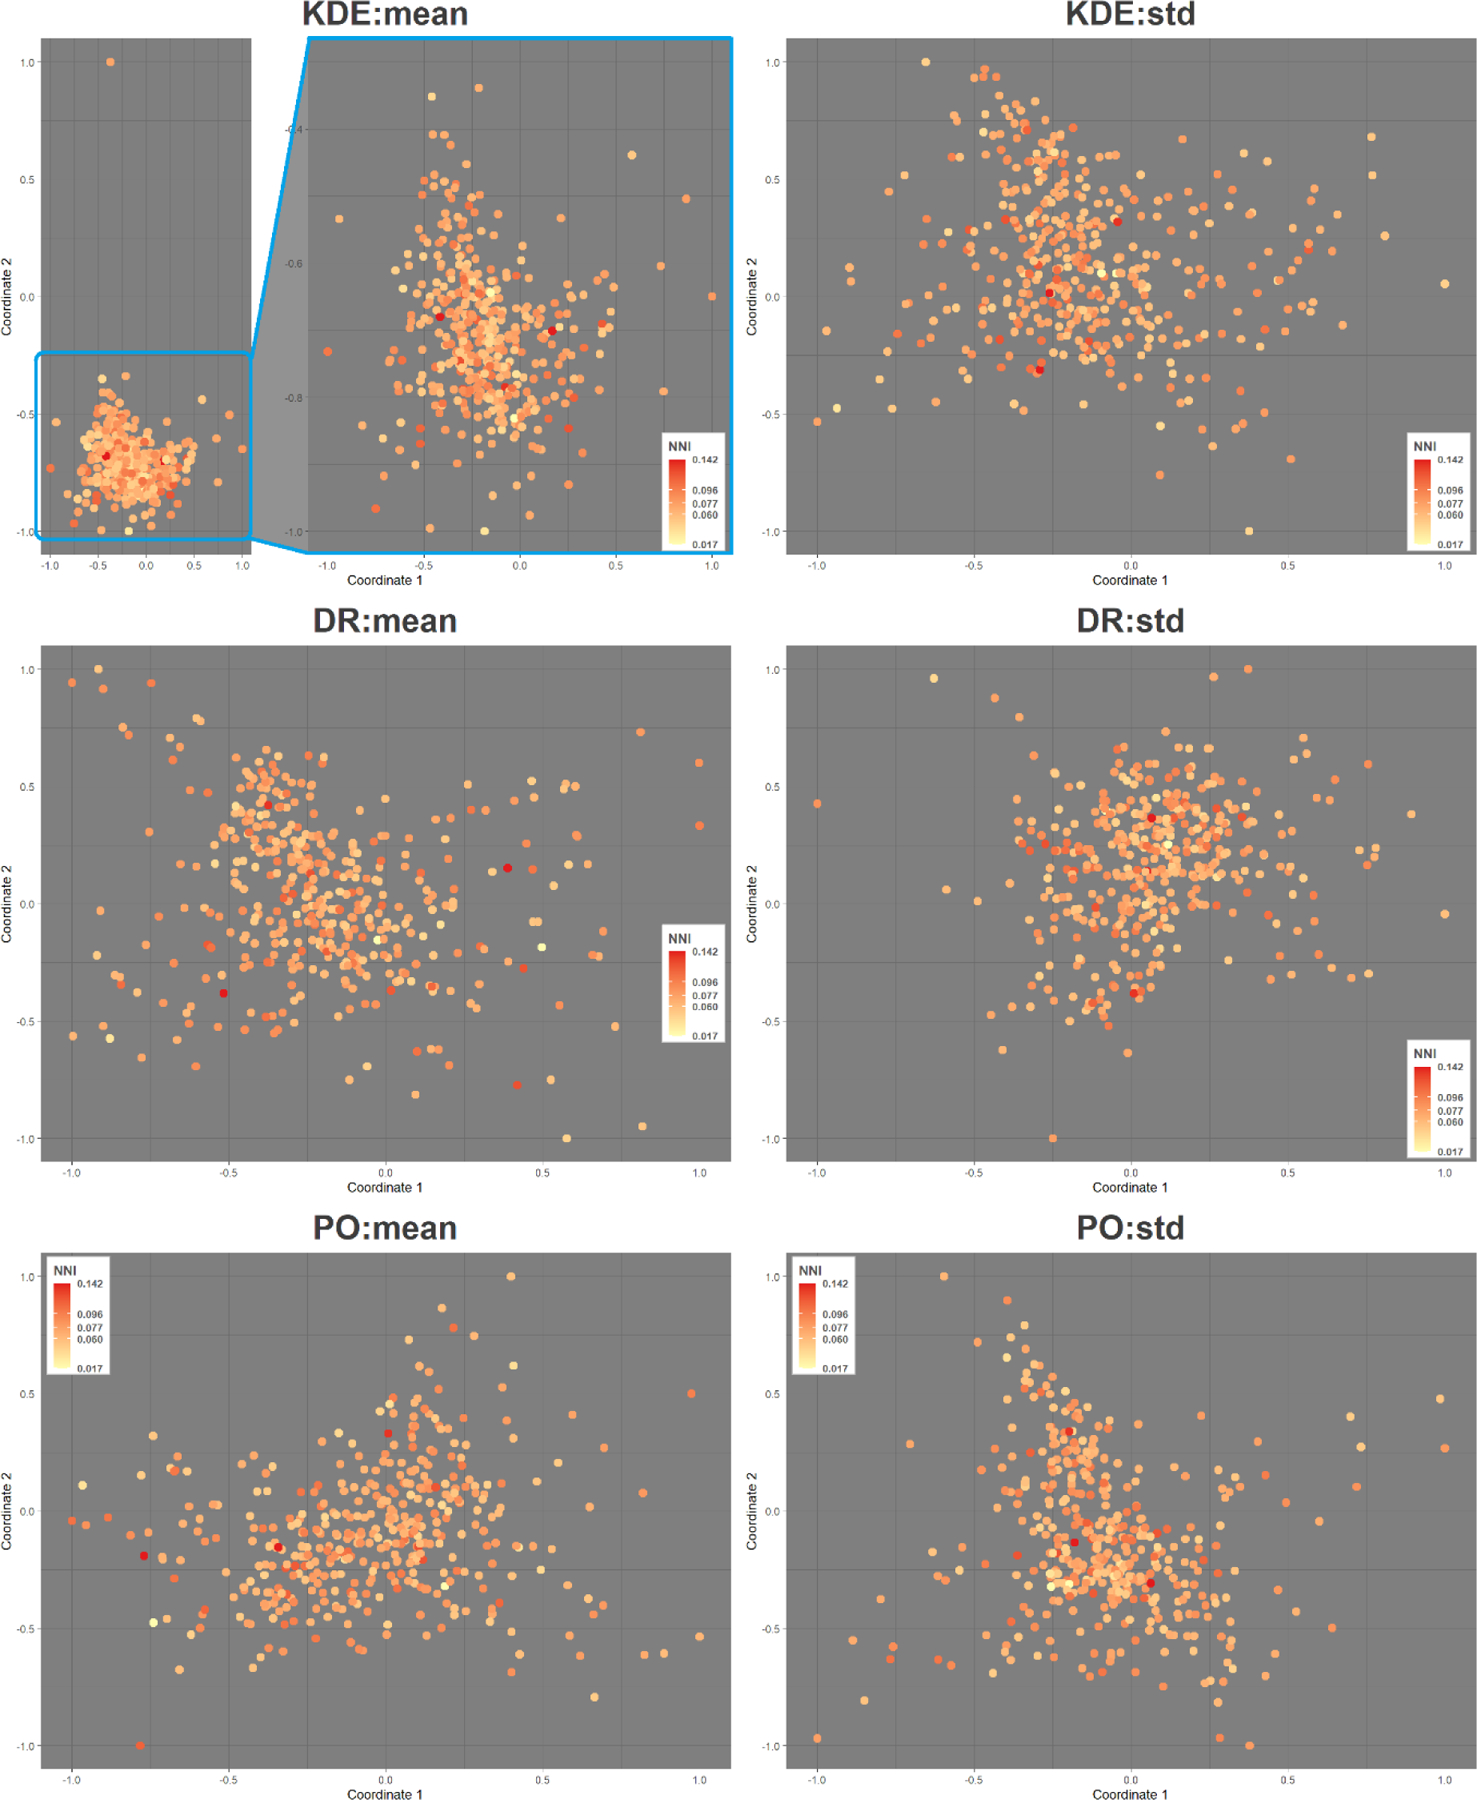
Time-weighted spatial averaging approaches (TWSA) are an increasingly utilized method for calculating exposure using global positioning system (GPS) mobility data for health-related research. They can provide a time-weighted measure of exposure, or dose, to various environments or health hazards. However, little work has been done to compare existing methodologies, nor to assess how sensitive these methods are to mobility data inputs (e.g., walking vs driving), the type of environmental data being assessed as the exposure (e.g., continuous surfaces vs points of interest), and underlying point-pattern clustering of participants (e.g., if a person is highly mobile vs predominantly stationary). Here we contrast three TWSA approaches that have been previously used or recently introduced in the literature: Kernel Density Estimation (KDE), Density Ranking (DR), and Point Overlay (PO). We feed GPS and accelerometer data from 602 participants through each method to derive time-weighted activity spaces, comparing four mobility behaviors: all movement, stationary time, walking time, and in-vehicle time. We then calculate exposure values derived from the various TWSA activity spaces with four environmental layer data types (point, line, area, surface). Similarities and differences across TWSA derived exposures for the sample and between individuals are explored, and we discuss interpretation of TWSA outputs providing recommendations for researchers seeking to apply these methods to health-related studies.
Keywords: Activity space; Dynamic exposure; Human health; Movement; Spatial-temporal analysis; Time weighting; Wearable sensors.
Copyright © 2021 The Authors. Published by Elsevier Ltd.. All rights reserved.
Conflict of interest statement
Declarations of interest: None
Figures
References
-
- Fuller D, Stanley KG. The future of activity space and health research. Heal Place. 2019;58:102131. - PubMed
-
- Rainham D, McDowell I, Krewski D, Sawada M. Conceptualizing the healthscape: contributions of time geography, location technologies and spatial ecology to place and health research. Soc Sci Med [Internet]. 2010. Mar [cited 2014 Jun 3];70(5):668–76. Available from: http://www.ncbi.nlm.nih.gov/pubmed/19963310 - PubMed
-
- Perchoux C, Chaix B, Cummins S, Kestens Y. Conceptualization and measurement of environmental exposure in epidemiology: accounting for activity space related to daily mobility. Health Place [Internet]. 2013. May [cited 2014 Jun 12];21:86–93. Available from: http://www.ncbi.nlm.nih.gov/pubmed/23454664 - PubMed
-
- Boruff BJ, Nathan A, Nijënstein S. Using GPS technology to (re)-examine operational definitions of “neighbourhood” in place-based health research. Int J Health Geogr [Internet]. 2012. Jan [cited 2014 Jun 12];11:22. Available from: http://www.pubmedcentral.nih.gov/articlerender.fcgi?artid=3490929&tool=p... - PMC - PubMed
Publication types
MeSH terms
Grants and funding
LinkOut - more resources
Full Text Sources
