. 2022 Jan 28:165:108091.
doi: 10.1016/j.neuropsychologia.2021.108091. Epub 2021 Nov 19.

Electrophysiological correlates of perceptual prediction error are attenuated in dyslexia

Affiliations

Electrophysiological correlates of perceptual prediction error are attenuated in dyslexia

Sara D Beach et al. Neuropsychologia. .

Abstract

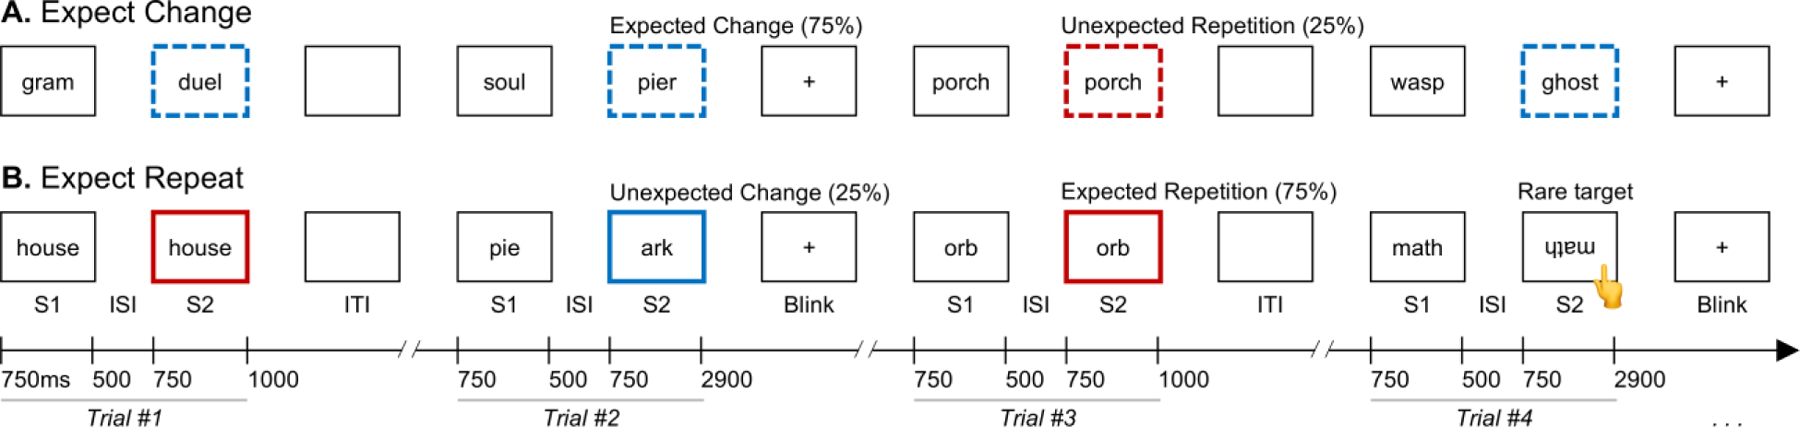
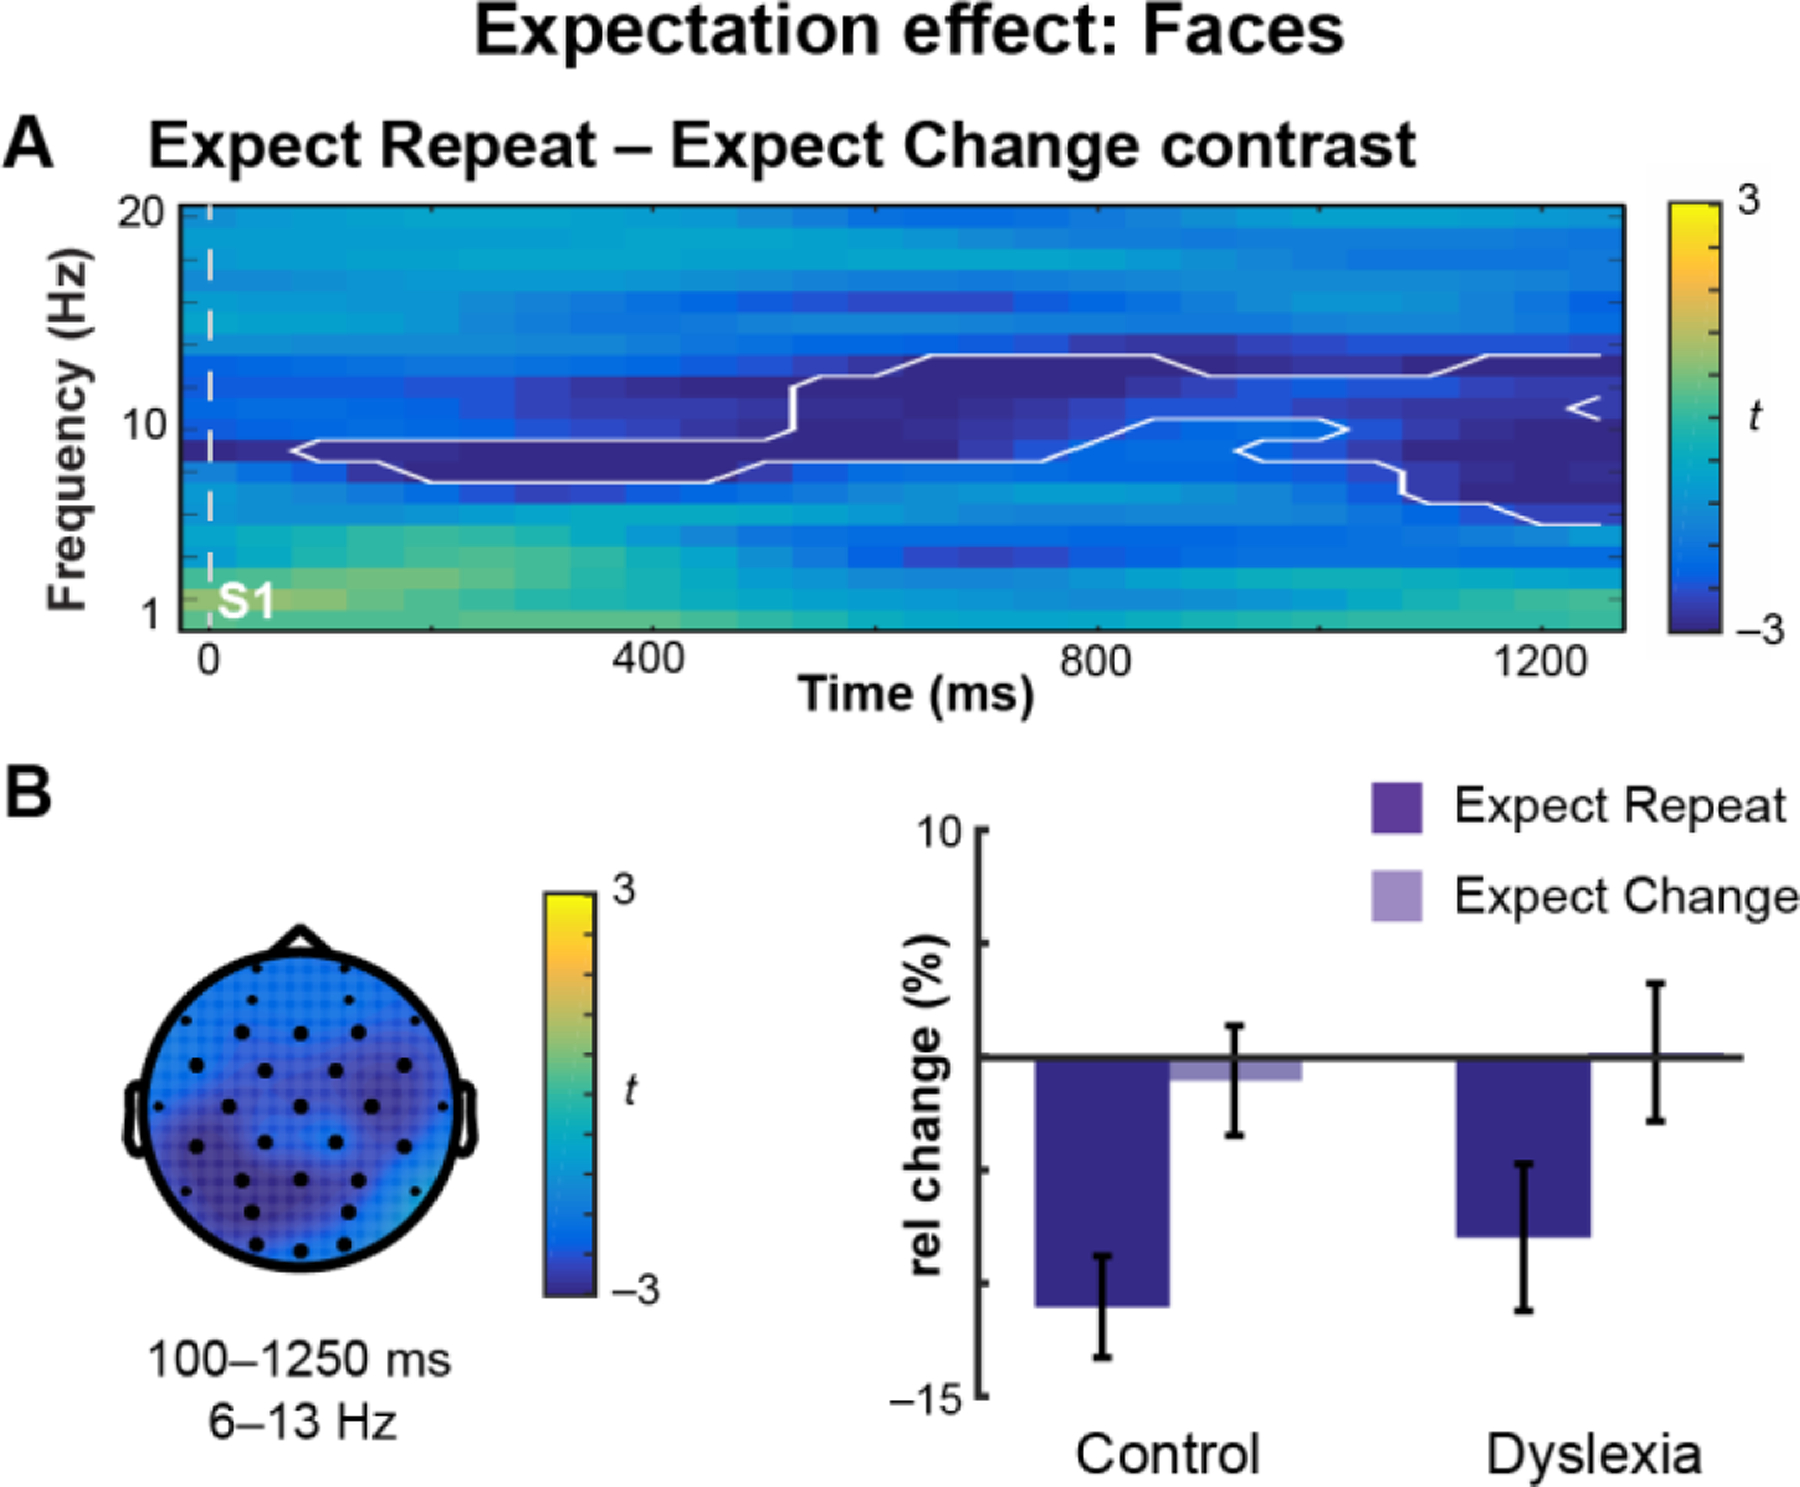
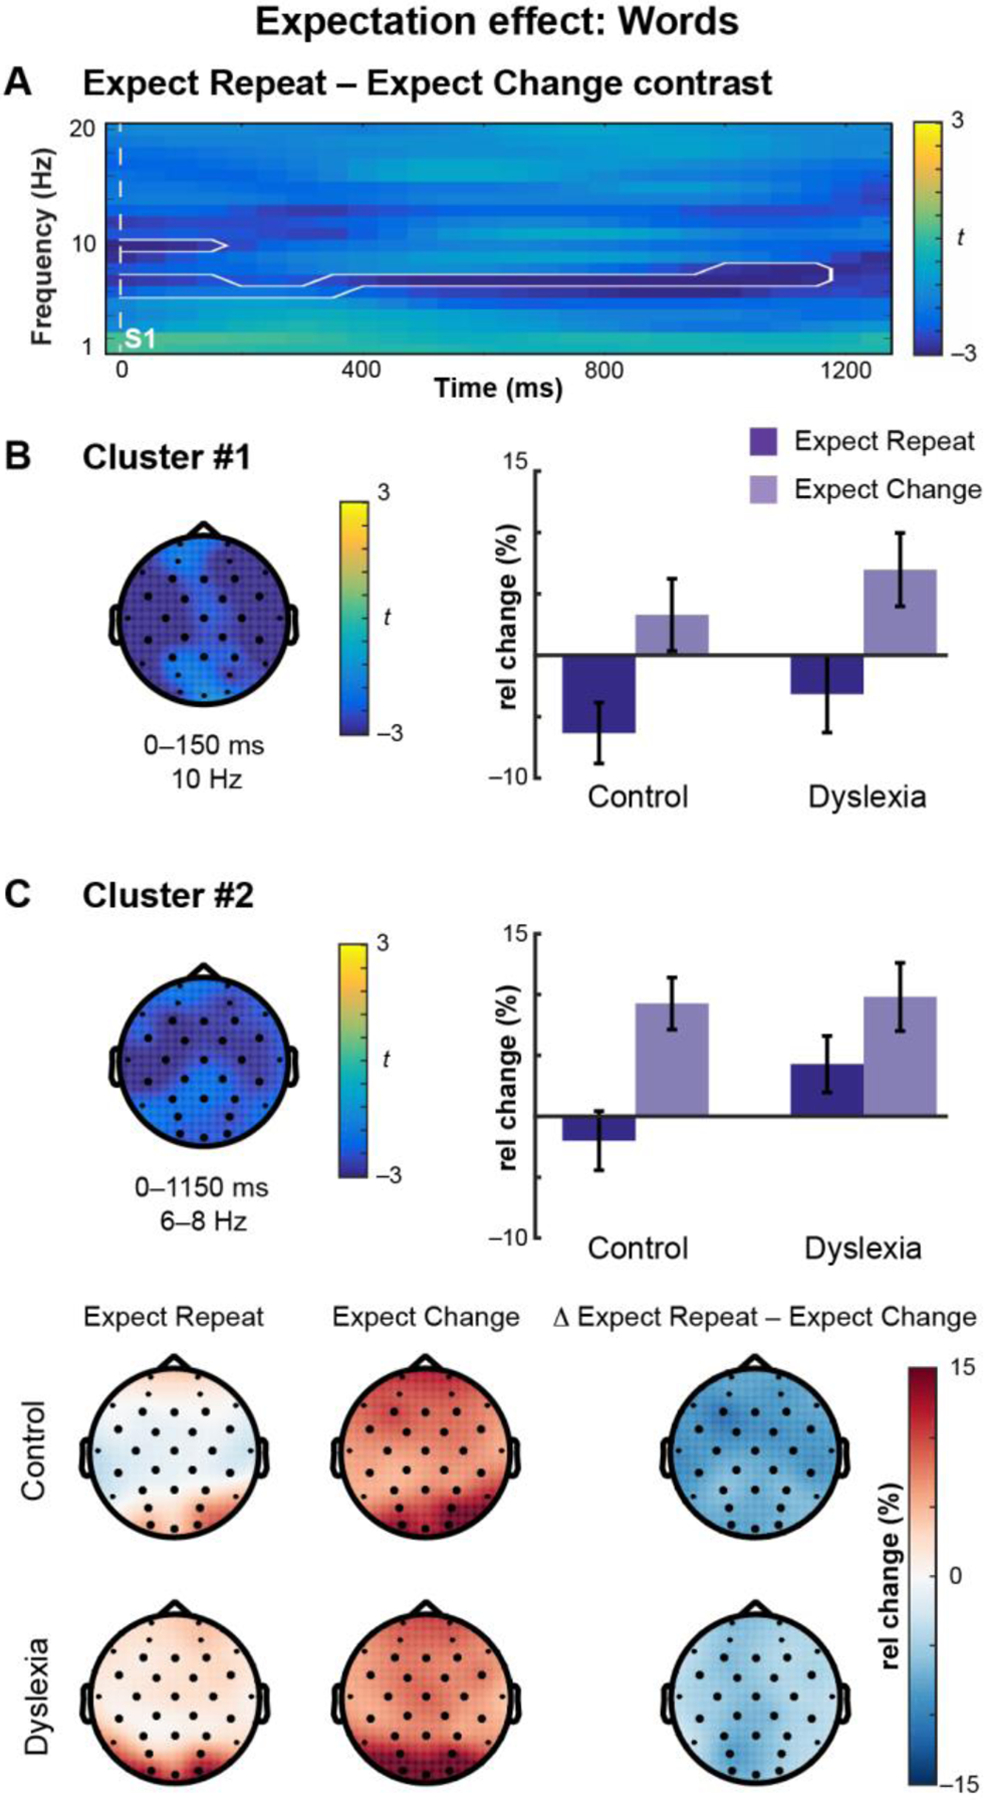
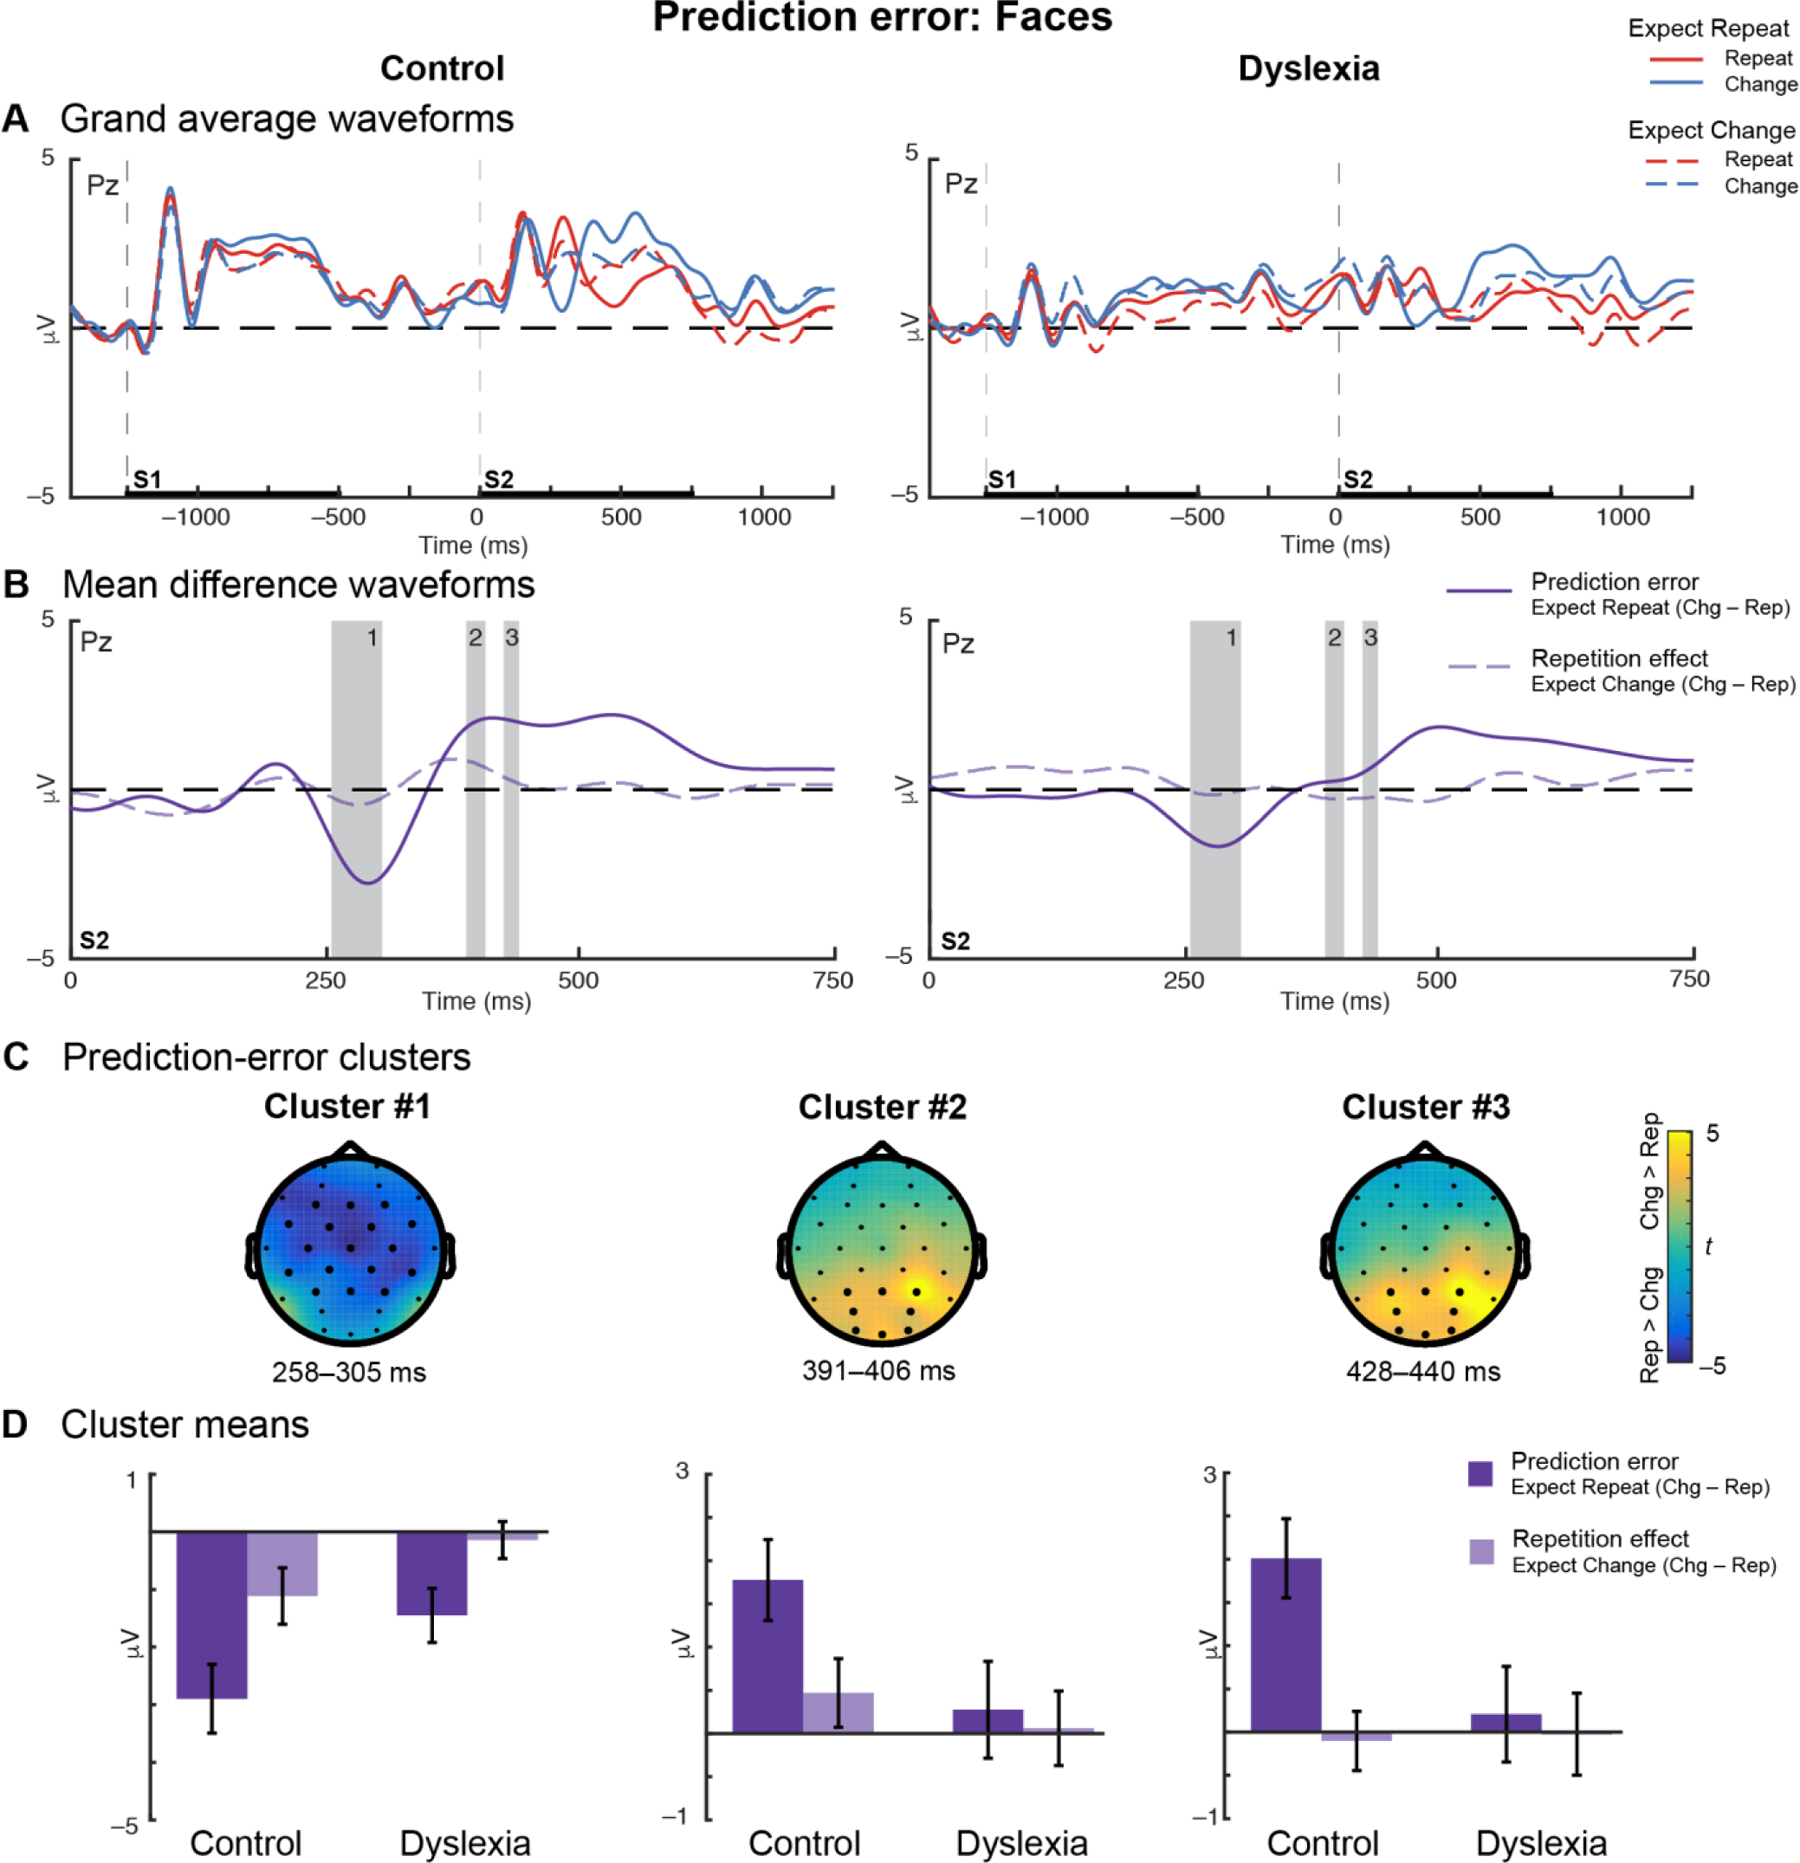
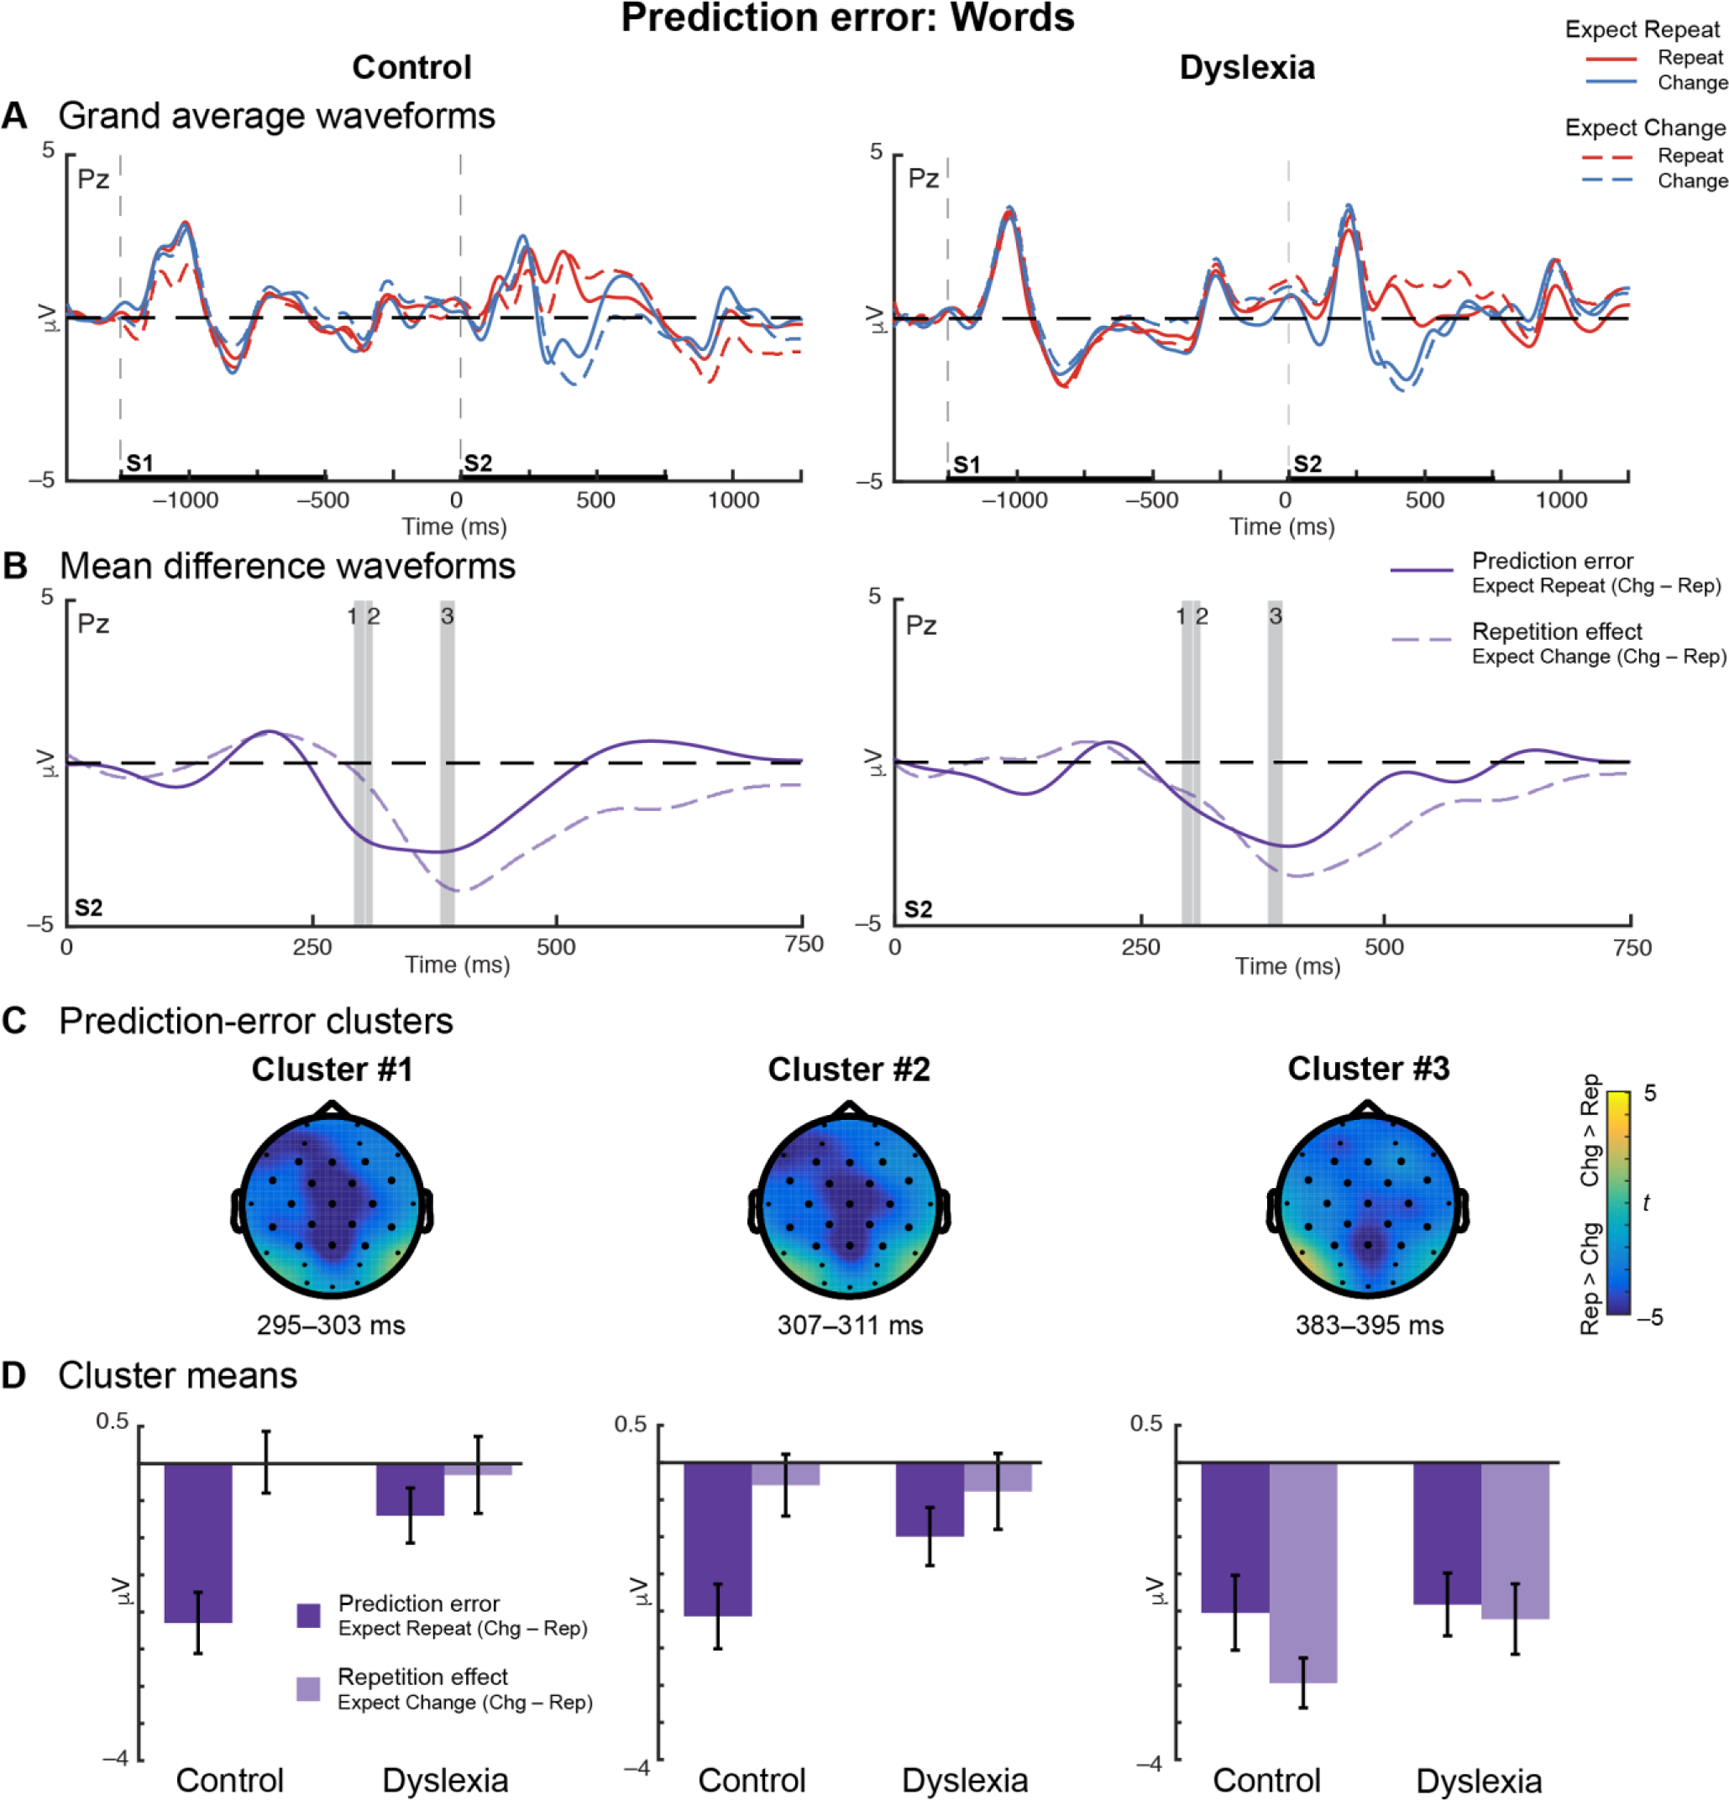
A perceptual adaptation deficit often accompanies reading difficulty in dyslexia, manifesting in poor perceptual learning of consistent stimuli and reduced neurophysiological adaptation to stimulus repetition. However, it is not known how adaptation deficits relate to differences in feedforward or feedback processes in the brain. Here we used electroencephalography (EEG) to interrogate the feedforward and feedback contributions to neural adaptation as adults with and without dyslexia viewed pairs of faces and words in a paradigm that manipulated whether there was a high probability of stimulus repetition versus a high probability of stimulus change. We measured three neural dependent variables: expectation (the difference between prestimulus EEG power with and without the expectation of stimulus repetition), feedforward repetition (the difference between event-related potentials (ERPs) evoked by an expected change and an unexpected repetition), and feedback-mediated prediction error (the difference between ERPs evoked by an unexpected change and an expected repetition). Expectation significantly modulated prestimulus theta- and alpha-band EEG in both groups. Unexpected repetitions of words, but not faces, also led to significant feedforward repetition effects in the ERPs of both groups. However, neural prediction error when an unexpected change occurred instead of an expected repetition was significantly weaker in dyslexia than the control group for both faces and words. These results suggest that the neural and perceptual adaptation deficits observed in dyslexia reflect the failure to effectively integrate perceptual predictions with feedforward sensory processing. In addition to reducing perceptual efficiency, the attenuation of neural prediction error signals would also be deleterious to the wide range of perceptual and procedural learning abilities that are critical for developing accurate and fluent reading skills.

Keywords: Adaptation; Dyslexia; Event-related potentials; Expectation; Prediction error; Repetition; Time-frequency.


Conflict of interest statement

Declarations of interest: none

Figures

Figure 1.
Figure 1.. Task design.
Participants viewed pairs of stimuli under conditions that manipulated the probability of stimulus repetition. Each trial consisted of a pair of stimuli, S1 and S2. (A) In the Expect Change condition, participants were told to expect to see each stimulus only once. The S2 stimulus differed from the S1 stimulus on 75% of trials (Expected Changes) and was the same as the S1 stimulus on 25% of trials (Unexpected Repetitions). (B) In the Expect Repeat condition, participants were told to expect to see each stimulus twice in a row. The S2 stimulus was the same as the S1 stimulus on 75% of trials (Expected Repetitions) and differed from the S1 stimulus on 25% of trials (Unexpected Changes). In all conditions, participants pressed a button whenever they observed an upside-down stimulus (illustrated in Trial #4 above), which occurred on approximately 5% of trials. For brevity, only the Words condition is shown; the trial structure was identical in the Faces condition. The convention of line colors and dashing denoting conditions is consistent with Figures 4 and 5.
Figure 2.
Figure 2.. Expectation of face repetition versus change modulates neural oscillations.
(A) Oscillatory power prior to S2 onset plotted in Control subjects as a time-frequency representation of the Expect Repeat – Expect Change contrast, where color indicates the t-statistic. One extended cluster (white outline) was identified in the Control group. (B) Topographical plot of the cluster. The t-statistic is averaged over time and frequency. Dark electrodes belong to the cluster. Barplot of the mean-difference values extracted from the cluster for Control and Dyslexia groups, expressed as a percent change from baseline. Error bars represent (between-subjects) SEM. Both groups showed desynchronization in the Expect Repeat condition.
Figure 3.
Figure 3.. Expectation of word repetition versus change modulates neural oscillations.
(A) Oscillatory power prior to S2 onset plotted in Control subjects as a time-frequency representation of the Expect Repeat – Expect Change contrast, where color indicates the t-statistic. Two clusters (white outlines) were identified in the Control group. (B) Topographical plot of the cluster at 10 Hz. The t-statistic is averaged over time and frequency. Dark electrodes belong to the cluster. In the barplot, mean-difference values extracted from the cluster for Control and Dyslexia groups demonstrate desynchronization in the Expect Repeat condition. Error bars represent (between-subjects) SEM. (C) Topographical plot of the cluster at 6–8 Hz. The t-statistic is averaged over time and frequency. Dark electrodes belong to the cluster. In the barplot, mean-difference values extracted from the cluster for Control and Dyslexia groups demonstrate synchronization in the Expect Change condition. A significant Group × Expectation interaction is plotted in detail in the lower panel. Each group showed synchronization in the Expect Change condition. Post-hoc tests revealed significant expectation condition-related modulation in each group.
Figure 4.
Figure 4.. Reduced prediction error in dyslexia for unexpected changes versus expected repetitions of faces.
(A) Grand-average waveforms for Control (left) and Dyslexia (right) groups plotted at representative electrode Pz show that ERPs diverge during the during the second stimulus (S2) interval for Repetition (red) and Change (blue) trials under the expectation of repetition (solid lines) or of change (dashed lines). (B) Mean-difference waveforms for prediction error in the Expect Repeat condition (solid dark purple) and repetition in the Expect Change condition (dashed light purple) during S2 presentation. Control data are plotted on the left and Dyslexia on the right; gray bars on both indicate the durations of the prediction-error clusters identified in the Control group. (C) Topographical plots for each of the three prediction-error clusters identified in the Control group. Color indicates the prediction-error effect expressed as a t-statistic, averaged over the duration of the cluster. Dark electrodes significantly differentiate Change versus Repeat trials. (D) Mean-difference voltage values extracted from each cluster for Control and Dyslexia groups. Error bars represent (between-subjects) SEM. Overall, greater voltage differences are observed under the Expect Repeat condition than the Expect Change condition. In each cluster, prediction error is significantly or trends larger in Control versus Dyslexia.
Figure 5.
Figure 5.. Reduced prediction error in dyslexia for unexpected changes versus expected repetitions of words.
(A) Grand-average waveforms for Control (left) and Dyslexia (right) groups plotted at representative electrode Pz show that ERPs diverge during the second stimulus (S2) interval for Repetition (red) and Change (blue) trials under the expectation of repetition (solid lines) or of change (dashed lines). (B) Mean-difference waveforms for prediction error in the Expect Repeat condition (solid dark purple) and repetition in the Expect Change condition (dashed light purple) during S2 presentation. Control data are plotted on the left and Dyslexia on the right; gray bars on both indicate the durations of the prediction-error clusters identified in the Control group. (C) Topographical plots for each of the three prediction-error clusters identified in the Control group. Color indicates the prediction-error effect expressed as a t-statistic, averaged over the duration of the cluster. Dark electrodes significantly differentiate Change versus Repetition trials. (D) Mean-difference voltage values extracted from each cluster for Control and Dyslexia groups. Error bars represent (between-subjects) SEM. Prediction-error effects are accompanied by substantial repetition effects in Cluster #3. In Clusters #1 and 2, prediction error is significantly or trends larger in Control versus Dyslexia.

Similar articles

Cited by

References

    1. Ahissar M, Lubin Y, Putter-Katz H, & Banai K (2006). Dyslexia and the failure to form a perceptual anchor. Nature Neuroscience, 9(12), 1558. - PubMed
    1. Arciuli J, & Simpson IC (2012). Statistical learning is related to reading ability in children and adults. Cognitive Science, 36(2), 286–304. - PubMed
    1. Atiani S, Elhilali M, David SV, Fritz JB, & Shamma SA (2009). Task difficulty and performance induce diverse adaptive patterns in gain and shape of primary auditory cortical receptive fields. Neuron, 61(3), 467–480. - PMC - PubMed
    1. Auksztulewicz R, & Friston K (2016). Repetition suppression and its contextual determinants in predictive coding. Cortex, 80, 125–140. - PMC - PubMed
    1. Baldeweg T (2007). ERP repetition effects and mismatch negativity generation: A predictive coding perspective. Journal of Psychophysiology, 21(3–4), 204–213.

Publication types