Multicenter Study
. 2022 May;161(5):1239-1249.
doi: 10.1016/j.chest.2021.10.049. Epub 2021 Nov 18.

Identification of Sputum Biomarkers Predictive of Pulmonary Exacerbations in COPD

Collaborators, Affiliations
Multicenter Study

Identification of Sputum Biomarkers Predictive of Pulmonary Exacerbations in COPD

Charles R Esther Jr et al. Chest. 2022 May.

Abstract

Background: Improved understanding of the pathways associated with airway pathophysiologic features in COPD will identify new predictive biomarkers and novel therapeutic targets.

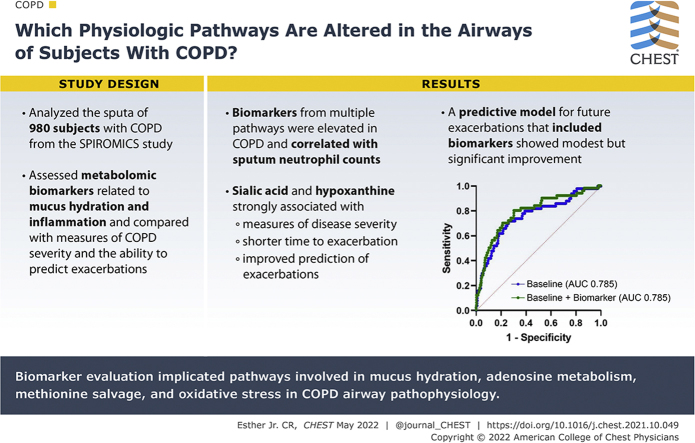
Research question: Which physiologic pathways are altered in the airways of patients with COPD and will predict exacerbations?

Study design and methods: We applied a mass spectrometric panel of metabolomic biomarkers related to mucus hydration and inflammation to sputa from the multicenter Subpopulations and Intermediate Outcome Measures in COPD Study. Biomarkers elevated in sputa from patients with COPD were evaluated for relationships to measures of COPD disease severity and their ability to predict future exacerbations.

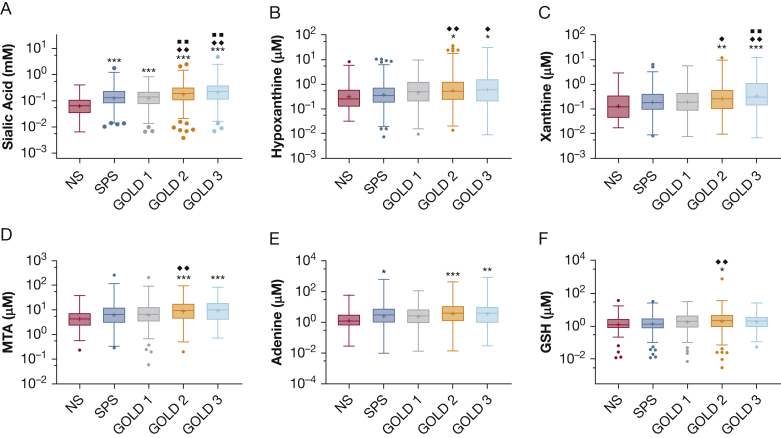
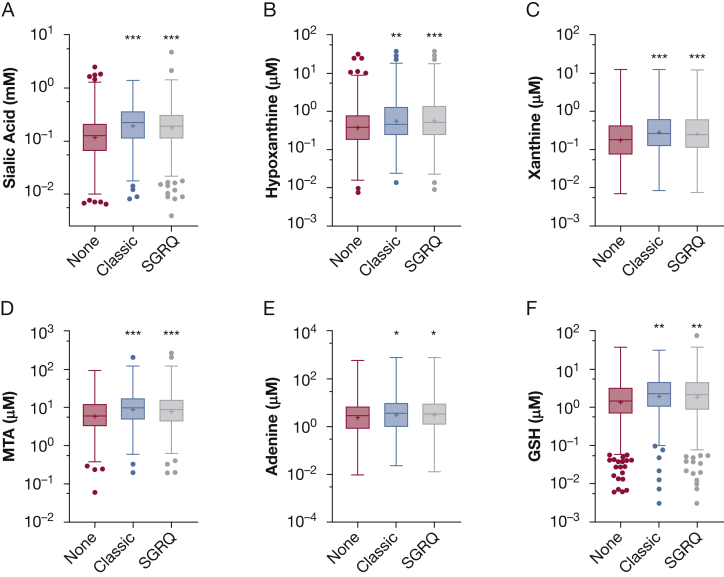
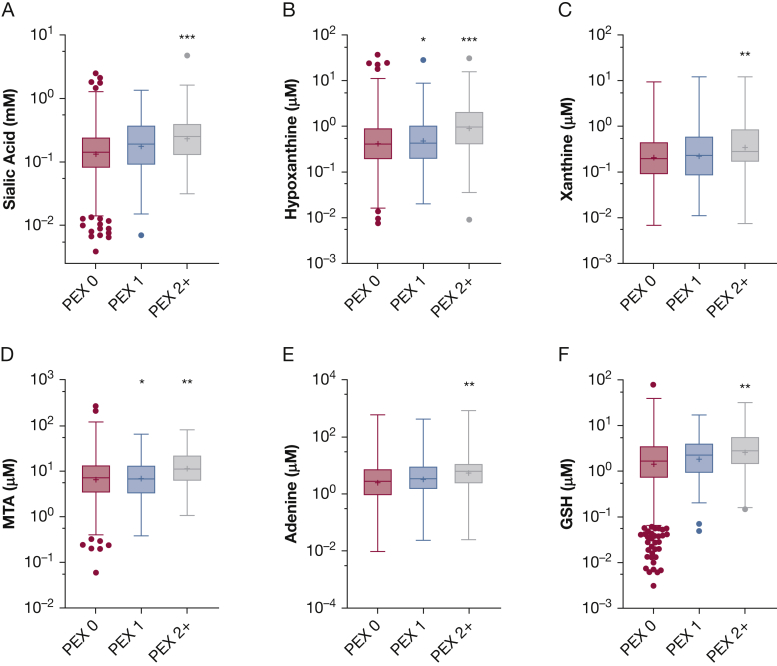
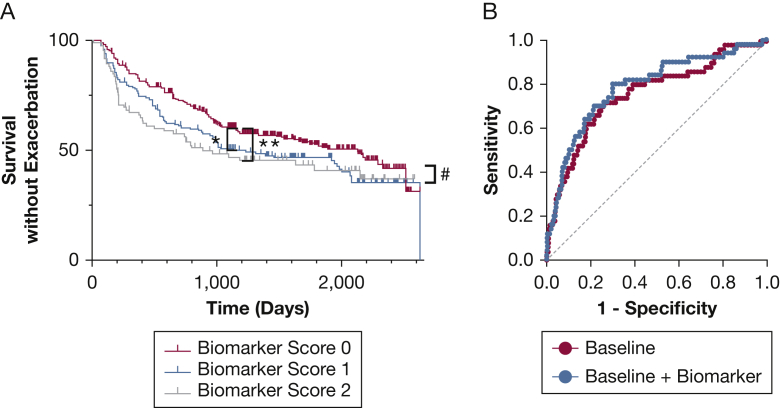
Results: Sputum supernatants from 980 patients were analyzed: 77 healthy nonsmokers, 341 smokers with preserved spirometry, and 562 patients with COPD (178 with Global Initiative on Chronic Obstructive Lung Disease [GOLD] stage 1 disease, 303 with GOLD stage 2 disease, and 81 with GOLD stage 3 disease) were analyzed. Biomarkers from multiple pathways were elevated in COPD and correlated with sputum neutrophil counts. Among the most significant analytes (false discovery rate, 0.1) were sialic acid, hypoxanthine, xanthine, methylthioadenosine, adenine, and glutathione. Sialic acid and hypoxanthine were associated strongly with measures of disease severity, and elevation of these biomarkers was associated with shorter time to exacerbation and improved prediction models of future exacerbations.

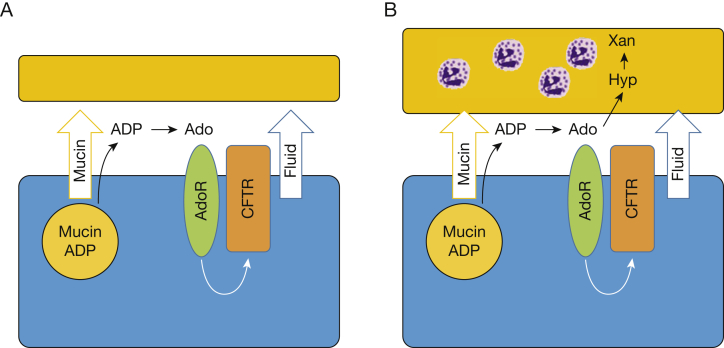
Interpretation: Biomarker evaluation implicated pathways involved in mucus hydration, adenosine metabolism, methionine salvage, and oxidative stress in COPD airway pathophysiologic characteristics. Therapies that target these pathways may be of benefit in COPD, and a simple model adding sputum-soluble phase biomarkers improves prediction of pulmonary exacerbations.

Trial registry: ClinicalTrials.gov; No.: NCT01969344; URL: www.

Clinicaltrials: gov.

Keywords: adenosine; glutathione; inflammation; metabolomics; methionine salvage; mucus.


Figures

None
Graphical abstract
Figure 1
Figure 1
A-F, Box-and-whisker plots showing sputum biomarkers by patient group. A, Sputum sialic acid was increased in all GOLD stages relative to the NS group and increased in GOLD stage 2 and GOLD stage 3 groups relative to SPS or GOLD stage 1 groups. B, Adenosine metabolite hypoxanthine also was elevated in those with more severe disease (GOLD stages 2 and 3) relative to NS and SPS groups. C, Similar findings for xanthine as those in (B). D, E, Methionine salvage pathway metabolites MTA (D) and adenine (E) were elevated in GOLD stages 2 and 3 groups relative to the NS group. F, Differences in sputum GSH were modest among patient groups and were statistically significant only for the GOLD stage 2 group relative to the NS or SPS groups. ∗P < .05, ∗∗P < .01, or ∗∗∗P < .001 vs NS, respectively. ♦P < .05 or ♦♦P < .01 vs SPS group. ■■P < .01 vs GOLD stage 1 group. All P values from Tukey multiple comparisons test after analysis of variance. GOLD = Global Initiative on Chronic Obstructive Lung Disease; GSH = glutathione; MTA = methylthioadenosine; NS = nonsmoker; SPS = smokers with preserved spirometry.
Figure 2
Figure 2
A-F, Box-and-whisker plots showing sputum biomarkers and bronchitis. A, Sputum sialic acid was increased in patients with chronic bronchitis defined by classic or SGRQ criteria vs those without chronic bronchitis. B-F, Similar findings were observed for hypoxanthine (B), xanthine (C), MTA (D), adenine (E), and GSH (F). ∗P < .05, ∗∗P < .01, or ∗∗∗P < .001 vs none, respectively. P values from Tukey multiple comparisons test after analysis of variance. SGRQ = St. George’s Respiratory Questionnaire; GSH = glutathione; MTA = methylthioadenosine.
Figure 3
Figure 3
A-F, Box-and-whisker plots showing sputum biomarkers and pulmonary exacerbations. A, Sputum sialic acid was elevated in patients who experienced PEX2+ in the year after study entry relative to those with PEX 0. B, Sputum hypoxanthine was elevated in those who experienced PEX 2+ as well as those who experienced PEX 1. C-F, Similar observations were made for xanthine (C), MTA (D), adenine (E), and GSH (F). ∗P < .05, ∗∗P < .01, or ∗∗∗P < .001 vs PEX 0, respectively. P values from Tukey multiple comparisons test after analysis of variance. GSH = glutathione; MTA = methylthioadenosine; PEX 0 = 0 pulmonary exacerbations; PEX 1 = one pulmonary exacerbation; PEX 2+ = two or more pulmonary exacerbations.
Figure 4
Figure 4
A, B, Predictive ability of biomarkers. A, Time to exacerbation based on biomarker score reflecting elevated sialic acid or hypoxanthine levels, or both in patients with COPD (n = 562). In the full data set, exacerbations occurred sooner in those with a biomarker score of 2 relative to those with a biomarker score of 0 (P = .02 for the model by log-rank Mantel-Cox test, with P = .02 by log-rank after test after Tukey-Kramer adjustment). Analyses also were performed with data censored at 3 years to assess shorter-term predictions, and in this model, both biomarker scores 1 and 2 were predictive of time to exacerbation (P = .008 for model, P = .027 for score 1, and P = .002 for score 2 in after test). ∗P < .05 and ∗∗P < .01 by after test for model censored at 3 years, and #P < .05 by after test for full model. B, Receiver operating characteristic (ROC) curves from logistic regression to predict those with multiple future exacerbations. The baseline model (red) used prior number of exacerbations, percent predicted FEV1, age, and sex as variables (area under the ROC curve [AUC], 0.758; 95% CI, 0.683-0.834; P < .001). The baseline plus biomarker model (blue) adding a biomarker score showed modest but significant improvement (AUC, 0.785; 95% CI, 0.713-0.857; P < .001; P = .0059 vs baseline model by likelihood ratio test). Differences were confirmed using cross-validated AUC analyses (see text).
Figure 5
Figure 5
A, B, Diagrams showing mechanisms of disease in COPD. A, In health, noxious stimuli such as smoking trigger release of mucin granules from airway epithelia into the extracellular space. These granules contain ADP and other nucleotides, which are metabolized on the airway surface to Ado. Ado stimulates AdoRs, which in turn activate CFTR and other channels to promote fluid secretion. The coordinated secretion of mucins and fluid acts to flush noxious stimuli off of the airway surface. B, With progressive disease, mucin secretion is enhanced, but increased extracellular metabolism of Ado from neutrophils or other factors limits its ability to stimulate fluid secretion. The resulting imbalance between mucin and fluid secretion leads to mucus accumulation. Ado = adenosine; AdoR = adenosine receptor; ADP = adenosine diphosphate; CFTR = cystic fibrosis transmembrane conductance regulator; Hyp = hypoxanthine; Xan = xanthine.

References

    1. Hastie A.T., Martinez F.J., Curtis J.L., et al. Association of sputum and blood eosinophil concentrations with clinical measures of COPD severity: an analysis of the SPIROMICS cohort. Lancet Respir Med. 2017;5(12):956–967. - PMC - PubMed
    1. Paone G., Leone V., Conti V., et al. Blood and sputum biomarkers in COPD and asthma: a review. Eur Rev Med Pharmacol Sci. 2016;20(4):698–708. - PubMed
    1. Beeh K.M., Beier J., Koppenhoefer N., Buhl R. Increased glutathione disulfide and nitrosothiols in sputum supernatant of patients with stable COPD. Chest. 2004;126(4):1116–1122. - PubMed
    1. Kinnula V.L., Ilumets H., Myllarniemi M., Sovijarvi A., Rytila P. 8-Isoprostane as a marker of oxidative stress in nonsymptomatic cigarette smokers and COPD. Eur Respir J. 2007;29(1):51–55. - PubMed
    1. Esther C.R., Jr., Turkovic L., Rosenow T., et al. Metabolomic biomarkers predictive of early structural lung disease in cystic fibrosis. Eur Respir J. 2016;48(6):1612–1621. - PMC - PubMed

Publication types

MeSH terms

Associated data