Review
. 2022 Jan 10;380(2214):20210127.
doi: 10.1098/rsta.2021.0127. Epub 2021 Nov 22.

Data science approaches to confronting the COVID-19 pandemic: a narrative review

Affiliations
Review

Data science approaches to confronting the COVID-19 pandemic: a narrative review

Qingpeng Zhang et al. Philos Trans A Math Phys Eng Sci. .

Abstract

During the COVID-19 pandemic, more than ever, data science has become a powerful weapon in combating an infectious disease epidemic and arguably any future infectious disease epidemic. Computer scientists, data scientists, physicists and mathematicians have joined public health professionals and virologists to confront the largest pandemic in the century by capitalizing on the large-scale 'big data' generated and harnessed for combating the COVID-19 pandemic. In this paper, we review the newly born data science approaches to confronting COVID-19, including the estimation of epidemiological parameters, digital contact tracing, diagnosis, policy-making, resource allocation, risk assessment, mental health surveillance, social media analytics, drug repurposing and drug development. We compare the new approaches with conventional epidemiological studies, discuss lessons we learned from the COVID-19 pandemic, and highlight opportunities and challenges of data science approaches to confronting future infectious disease epidemics. This article is part of the theme issue 'Data science approaches to infectious disease surveillance'.

Keywords: COVID-19; big data; data science; infectious disease; mathematical modelling.


Figures

Figure 1.
Figure 1.
Geographical distribution of the 7.55 million agents and facilities in Hong Kong. Layer 1 represents the distribution of schools. Layer 2 represents the population distribution. Layer 3 represents the locations of entertainment sites. Credit: Zhou et al. [23]. (Online version in colour.)
Figure 2.
Figure 2.
Three typical digital contact tracing apps: (a) Apple’s Exposure Notification function (Bluetooth-based). (b) TraceTogether system in Singapore (Bluetooth-based). (c) Health Code system in Mainland China (Mandatory manual input), (d) LeaveHomeSafe system in Hong Kong (voluntary manual input). (Online version in colour.)
Figure 3.
Figure 3.
Motifs-of-interest for drug repurposing in a knowledge graph: a knowledge graph is a multi-relational graph composed of entities and relations. Each entity represents a specific protein, gene, drug, virus, disease or symptom and each relation represents a known existing linkage between any two entities. A motif is a connected subgraph representing fundamental building block of the knowledge graphs. Motifs-of-interest are defined based on their importance to the drug repurposing task. Motif-clique discovery algorithms are used to extract these defined motifs-of-interest. Credit: Yan et al./Wiley [62]. (Online version in colour.)
Figure 4.
Figure 4.
An example of the answers and summary provided by CAiRE-COVID. Screenshot taken by searching ‘What do we know about asymptomatic transmission of COVID-19?’ on CAiRE-COVID [72]. (Online version in colour.)
Figure 5.
Figure 5.
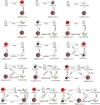
Knowledge transfer from the disciplines of the papers cited by the papers we reviewed (down) to the disciplines of papers citing the papers we reviewed (up). The size of arrows represents the frequency. (Online version in colour.)
Figure 6.
Figure 6.
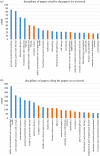
The count of top 20 disciplines (excluding Multidisciplinary Sciences) of (a) the papers cited by the papers we reviewed, and (b) the papers citing the papers we reviewed. The orange bars represent disciplines other than medicine, biology and public health disciplines. (Online version in colour.)

Similar articles

Cited by

References

    1. Topol EJ. 2019. High-performance medicine: the convergence of human and artificial intelligence. Nat. Med. 25, 44-56. (10.1038/s41591-018-0300-7) - DOI - PubMed
    1. Khoury MJ, Ioannidis JPA. 2014. Big data meets public health. Science 346, 1054-1055. (10.1126/science.aaa2709) - DOI - PMC - PubMed
    1. Wong ZS, Zhou J, Zhang Q. 2019. Artificial intelligence for infectious disease big data analytics. Infect., Dis. Health 24, 44-48. (10.1016/j.idh.2018.10.002) - DOI - PubMed
    1. Mooney SJ, Pejaver V. 2018. Big data in public health: terminology, machine learning, and privacy. Annu. Rev. Public Health 39, 95-112. (10.1146/annurev-publhealth-040617-014208) - DOI - PMC - PubMed
    1. Who coronavirus (covid-19) dashboard. https://covid19.who.int/. (accessed 15 May 2021).