. 2021 Nov 12:14:5919-5937.
doi: 10.2147/JIR.S337499. eCollection 2021.

Melatonin Ameliorates Axonal Hypomyelination of Periventricular White Matter by Transforming A1 to A2 Astrocyte via JAK2/STAT3 Pathway in Septic Neonatal Rats

Affiliations

Melatonin Ameliorates Axonal Hypomyelination of Periventricular White Matter by Transforming A1 to A2 Astrocyte via JAK2/STAT3 Pathway in Septic Neonatal Rats

Shuqi Jiang et al. J Inflamm Res. .

Abstract

Background: Astrocyte A1/A2 phenotypes may play differential role in the pathogenesis of periventricular white matter (PWM) damage in septic postnatal rats. This study aimed to determine whether melatonin (MEL) would improve the axonal hypomyelination through shifting A1 astrocytes towards A2.

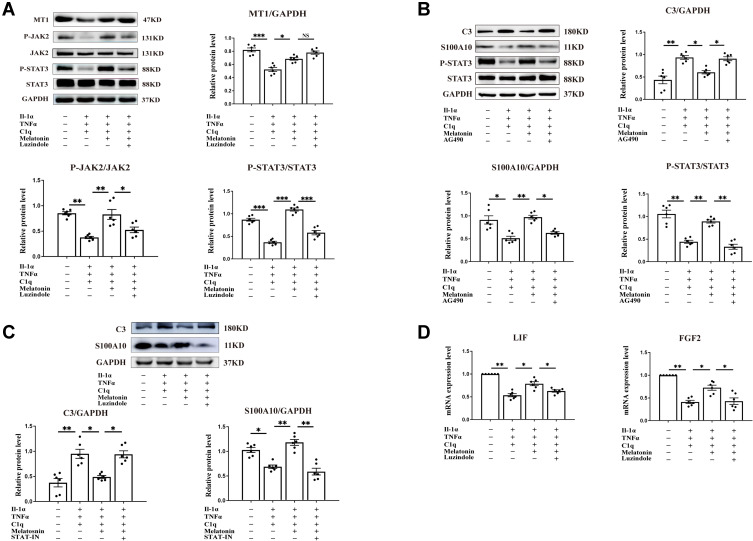
Methods: One-day-old Sprague-Dawley rats were divided into control, LPS, and LPS+MEL groups. Immunofluorescence was performed to detect C1q, IL-1α, TNF-α, IBA1, GFAP, MAG, C3 and S100A10 immunoreactivity in the PWM of neonatal rats. Electron microscopy was conducted to observe alterations of axonal myelin sheath in the PWM; moreover, myelin protein expression was assessed using in situ hybridization. The effects of MEL on neurological function were evaluated by behavioral tests. In vitro, A1 astrocytes were induced by IL-1α, C1q and TNF-α, and following which the effect of MEL on C3 and S100A10 expression was determined by Western blot and immunofluorescence.

Results: At 1 and 3 days after LPS injection, IBA1+ microglia in the PWM were significantly increased in cell numbers which generated excess amounts of IL-1α, TNF-α, and C1q. The number of A1 astrocytes was significantly increased at 7-28d after LPS injection. In rats given MEL treatment, the number of A1 astrocytes was significantly decreased, but that of A2 astrocytes, PLP+, MBP+ and MAG+ cells was increased. By electron microscopy, ultrastructural features of axonal hypomyelination were attenuated by MEL. Furthermore, MEL improved neurological dysfunction as evaluated by different neurological tests. In vitro, MEL decreased the C3 significantly, and upregulated expression of S100A10 in primary astrocytes subjected to IL-1α, TNF-α and C1q treatment. Importantly, JAK2/STAT3 signaling pathway was found to be involved in modulation of A1/A2 phenotype transformation.

Conclusion: MEL effectively alleviates PWMD of septic neonatal rats, which is most likely through modulating astrocyte phenotypic transformation from A1 to A2 via the MT1/JAK2/STAT3 pathway.

Keywords: astrocyte; hypomyelination; melatonin; neuroprotection; sepsis.


Conflict of interest statement

The authors declare no competing interests.

Figures

Figure 1
Figure 1
IL-1α, C1q and TNF-α protein expression in the PWM of postnatal rats at 1d, 3d and 7d after LPS injection and their matching controls. The number of IBA1+ cells was significantly increased at 1 and 3d after LPS injection, but the difference was not significant at 7d between LPS and control groups (A and B) (n=3 for each group). The co-localized expression of IBA1 and C1q in microglia could be seen in A. The number of C1q+ IBA1+ cells was significantly increased at 1 and 3d after LPS injection, but the difference was not significant at 7d between LPS and control groups (A and C), n=3 for each group. Quantification by Elisa shows significant increase in the cytokine secretion of IL-1α (D), C1q (E) and TNF-α (F) at 1, 3 and 7d after LPS exposure when compared with the corresponding control (n=3). Scale bars: 20µm. *P<0.05, **P<0.01, ***P<0.001.
Figure 2
Figure 2
Immunofluorescence images of astrocytes in the PWM at 7 days after LPS injection and their matching controls. The astrocytes were labeled by anti-GFAP (green), and anti-C3 (red), and anti-S100A10 (red) for A1 and A2, respectively. The number of GFAP+ cells was significantly increased at 3 and 7d after LPS injection (A and B), (n=3 for each group). The number of C3+ GFAP+ cells was significantly increased at 7d after LPS injection (C), meanwhile, S100A10 expression in astrocytes at 7d was decreased after LPS injection (E). Bar graph in (D and F) summarizes the frequency of C3+ GFAP+ cells and S100A10+ GFAP+ cells at 7d after LPS injection (n=3 for each group). Scale bars: 20µm. **P<0.01.
Figure 3
Figure 3
Melatonin counteracted LPS-induced A1/A2 astrocyte polarization in the PWM of septic neonatal rats. GFAP-labeled (green) and C3 (red) immunoreactive astrocytes are distributed in the PWM at 14 and 28d after LPS/melatonin injection and their corresponding controls. The number of C3+ GFAP+ cells was significantly increased at 14 and 28d after LPS injection compared with controls; however, it was significantly decreased after melatonin treatment (A and B) (n=3 for each group). GFAP-labeled (green) and S100A10 (red) immunoreactive astrocytes are distributed in the PWM at 14 and 28d after LPS/melatonin injection and their corresponding controls. Note the number of S100A10+ GFAP+ cells was significantly decreased at 14 and 28d after LPS injection compared with controls; however, it was significantly increased after melatonin treatment (C and D) (n=3 for each group). Scale bars: 20µm. **P<0.01, ***P<0.001.
Figure 4
Figure 4
Melatonin attenuated axonal hypomyelination in the PWM in LPS-induced septic neonatal rats. MAG-labeled (red) and DAPI (blue) immunoreactive oligodendrocytes are distributed in the PWM at 14 and 28d after the LPS/melatonin injection and their corresponding controls. The number of MAG+ DAPI+ cells was significantly decreased at 14 and 28d after LPS injection compared with control; however it was significantly increased after melatonin treatment (A and B) (n=3 for each group; scale bars: 50µm). In situ hybridization shows the number of MBP+ and PLP+ oligodendrocytes was significantly decreased at 14 and 28d after LPS injection compared with controls; however, it was significantly increased after melatonin treatment (CE), (n=3 for each group; scale bars: 50µm). Electron microscope images showing sectional profiles of myelinated axon in transverse section at the magnification of × 4000. The configuration of myelinated axons in the PWM of postnatal rats at 28 d after the LPS injection, LPS + MEL injection and their corresponding controls (F), (n=3 for each group; scale bars: 2 µm). Graph (G) showing G-ratio of myelinated axons of different diameters in the PWM at 28d after LPS injection and LPS + MEL injection and corresponding control. (H) is bar graph showing increased g-ratio of myelinated axons of different diameters in the PWN at 28 days after the LPS injection, LPS + MEL injection and corresponding control. *P<0.05, ***P<0.001.
Figure 5
Figure 5
Melatonin improved anxiety behavior and spatial learning of rats given LPS injection. There were no significant differences in the total distance moved as well as the average movement speed of rats in the CON, LPS and LPS + MEL groups in the open field experiment In LPS + MEL group (A and B), the duration of movement in the central area (C) and the ratio between distance in the center area and the total distance (D) was increased compared with the LPS group. Melatonin treatment significantly improved spatial learning in Morris water maze test. Representative swimming paths of rats during the probe trial on day 5 are depicted (EG). Longer escape latencies and decreased number of times crossing the original platform location was observed in rats at 28 days after LPS injection when compared with control group; however, melatonin treatment significantly improved the impairment in cognitive deficits of rats after LPS injection as measured by shorter escape latencies and increased number of times crossing the original platform location (H and I). *P<0.05, **P<0.01. (n=10 for each group in every test).
Figure 6
Figure 6
Melatonin reversed the increased expression of C3, and decreased expression of S100A10 in primary astrocytes stimulated by IL-1α, TNF-α and C1q in vitro. After melatonin treatment and IL-1α, TNF-α and C1q exposure, the astrocytes were processed for immunofluorescence staining using primary antibodies GFAP (green), and anti-C3 (red) for A1 detection. Immunofluorescence images of cultured primary astrocytes showing the expression of GFAP and C3 at 24h after the treatment with IL-1α + C1q + TNF-α, IL-1α + C1q + TNF-α + melatonin and IL-1α + C1q + TNF-α + melatonin + luzindole when compared with the corresponding control (A). (B) Shows the optical density changes of C3 protein relative to GAPDH. A2 astrocytes were examined by immunofluorescence labeling using anti-GFAP (green) and A2 marker anti-S100A10 (red). Immunofluorescence images of cultured primary astrocytes showing expression of GFAP and S100A10 at 24h after treatment of IL-1α + C1q + TNF-α, IL-1α + C1q + TNF-α + melatonin, and IL-1α + C1q + TNF-α + luzindole when compared with the corresponding control (C). (D) Shows the optical density changes of S100A10 protein, relative to GAPDH. Scale bars: 20 μm. *P<0.05, **P<0.01, ***P<0.001 (n=3 for each group).
Figure 7
Figure 7
Melatonin activated MT1/JAK2/STAT3 pathway in primary astrocytes exposed to IL-1α, C1q and TNF-α in vitro. (A) Shows optical density changes of p-JAK2 relative to JAK2, p-STAT3 relative to STAT3 and MT1 relative to GAPDH in each group. IL-1α + C1q + TNF-α treatment for 24h significantly decreased the optical density of MT1, P-JAK2 and P-STAT3 proteins when compared with the corresponding controls. Melatonin reversed the changes, but the effect was prevented by luzindole. Additionally, blockage of JAK2 or STAT3 inhibited the effect of melatonin in modulating the A1/A2 astrocyte polarization. (B) Shows A1-marker C3, A2-marker S100A10, p-STAT3, STAT3 and GAPDH immunoreactive bands after IL-1α + C1q + TNF-α, IL-1α + C1q + TNF-α + melatonin, and IL-1α + C1q + TNF-α + AG490 (an inhibitor of JAK2 activity) treatment when compared with the corresponding control in primary astrocyte. (C) show immunoreactive bands after IL-1α + C1q + TNF-α, IL-1α + C1q + TNF-α + melatonin, IL-1α + C1q + TNF-α + STAT-IN-3 (an inhibitor of STAT3 activity) treatment when compared with the corresponding control in primary astrocyte. Note melatonin treatment activates MT1/JAK2/STAT3 pathway and then promoted A1 to A2 polarization. RT-qPCR shows mRNA expression changes in neurotrophic factors LIF and FGF2. GAPDH was used as the internal control. IL-1α + C1q + TNF-α treatment for 24h significantly decreased the mRNA expression of LIF and FGF2 when compared with the corresponding controls. Melatonin reversed the changes, but the effect of melatonin was prevented by luzindole (D). *P < 0.05, **P < 0.01, ***P<0.001 (n=3 for each group).
Figure 8
Figure 8
Table of Contents Image (TOCI): A schematic diagram depicting the cellular and molecular events associated with melatonin treatment in postnatal rats given LPS injection. Microglia are activated in the PWM after intraperitoneal injection of LPS and release massive amounts of IL-1α, TNF-α and C1q, which then induce A1 astrocyte activation. A1 astrocyte would contribute to axonal hypomyelination in the PWM in the septic neonatal rats. Melatonin binds to its cognate receptor (MT1) expressed on the astrocytes leading to activation of the JAK2/STAT3 pathways. This would decrease A1 astrocyte production of Complement 3, C3, and increase A2 astrocyte production of trophic factor, S100A10. Production of complement and neurotoxin by A1 astrocytes causes hypomyelination in the PWM after LPS injection; on the other hand, production of trophic factors by A2 astrocytes induced by melatonin improves hypomyelination.

Similar articles

Cited by

References

    1. Jung E, Romero R, Yeo L, et al. The fetal inflammatory response syndrome: the origins of a concept, pathophysiology, diagnosis, and obstetrical implications. Semin Fetal Neonatal Med. 2020;25:101146. doi:10.1016/j.siny.2020.101146 - DOI - PMC - PubMed
    1. Ahlin K, Himmelmann K, Hagberg G, et al. Cerebral palsy and perinatal infection in children born at term. Obstet Gynecol. 2013;122(1):41–49. doi:10.1097/AOG.0b013e318297f37f - DOI - PubMed
    1. Ferreira RC, Mello RR, Silva KS. Neonatal sepsis as a risk factor for neurodevelopmental changes in preterm infants with very low birth weight. J Pediatr. 2014;90(3):293–299. doi:10.1016/j.jped.2013.09.006 - DOI - PubMed
    1. Mwaniki MK, Atieno M, Lawn JE, et al. Long-term neurodevelopmental outcomes after intrauterine and neonatal insults: a systematic review. Lancet. 2012;379(9814):445–452. doi:10.1016/s0140-6736(11)61577-8 - DOI - PMC - PubMed
    1. Hofer N, Müller W, Resch B. White matter damage and neonatal sepsis. Acta paediatrica. 2011;100:e1; author reply e1–2. doi:10.1111/j.1651-2227.2011.02217.x - DOI - PubMed