CoronaVac (Sinovac) COVID-19 vaccine-induced molecular changes in healthy human serum by infrared spectroscopy coupled with chemometrics
- PMID: 34803453
- PMCID: PMC8573849
- DOI: 10.3906/biy-2105-65
CoronaVac (Sinovac) COVID-19 vaccine-induced molecular changes in healthy human serum by infrared spectroscopy coupled with chemometrics
Abstract
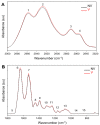
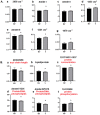
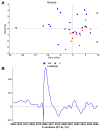
From the beginning of the COVID-19 coronavirus pandemic in December of 2019, the disease has infected millions of people worldwide and caused hundreds of thousands of deaths. Since then, several vaccines have been developed. One of those vaccines is inactivated CoronaVac-Sinovac COVID-19 vaccine. In this proof of concept study, we first aimed to determine CoronaVac-induced biomolecular changes in healthy human serum using infrared spectroscopy. Our second aim was to see whether the vaccinated group can be separated or not from the non-vaccinated group by applying chemometric techniques to spectral data. The results revealed that the vaccine administration induced significant changes in some functional groups belonging to lipids, proteins and nucleic acids. In addition, the non-vaccinated and vaccinated groups were successfully separated from each other by principal component analysis (PCA) and linear discriminant analysis (LDA). This proof-of-concept study will encourage future studies on CoronaVac as well as other vaccines and will lead to make a comparison between different vaccines to establish a better understanding of the vaccination outcomes on serum biomolecules.
Keywords: Attenuated total reflection-Fourier Transform Infrared (ATR-FTIR); COVID-19; Fourier Transform Infrared (FTIR) spectroscopy; multivariate analysis; vaccine; CoronaVac-Sinovac.
Copyright © 2021 The Author(s).
Conflict of interest statement
CONFLICT OF INTEREST: none declared
Figures


Similar articles
-
Investigation of the discrimination and characterization of blood serum structure in patients with opioid use disorder using IR spectroscopy and PCA-LDA analysis.J Pharm Biomed Anal. 2020 Oct 25;190:113553. doi: 10.1016/j.jpba.2020.113553. Epub 2020 Aug 15. J Pharm Biomed Anal. 2020. PMID: 32846399
-
Spectrochemical differentiation of meningioma tumours based on attenuated total reflection Fourier-transform infrared (ATR-FTIR) spectroscopy.Anal Bioanal Chem. 2020 Feb;412(5):1077-1086. doi: 10.1007/s00216-019-02332-w. Epub 2019 Dec 21. Anal Bioanal Chem. 2020. PMID: 31865413 Free PMC article.
-
ATR-FTIR spectrum analysis of plasma samples for rapid identification of recovered COVID-19 individuals.J Biophotonics. 2023 Jul;16(7):e202200166. doi: 10.1002/jbio.202200166. Epub 2023 Mar 27. J Biophotonics. 2023. PMID: 36869427
-
[Progress in study of biomacromolecular damages by infrared spectroscopy].Guang Pu Xue Yu Guang Pu Fen Xi. 2011 Dec;31(12):3194-9. Guang Pu Xue Yu Guang Pu Fen Xi. 2011. PMID: 22295758 Review. Chinese.
-
Novel approaches for COVID-19 diagnosis and treatment: a nonsystematic review.Turk J Biol. 2021 Aug 30;45(4):358-371. doi: 10.3906/biy-2105-45. eCollection 2021. Turk J Biol. 2021. PMID: 34803440 Free PMC article. Review.
Cited by
-
Potential of ATR-FTIR-Chemometrics in Covid-19: Disease Recognition.ACS Omega. 2022 Aug 25;7(35):30756-30767. doi: 10.1021/acsomega.2c01374. eCollection 2022 Sep 6. ACS Omega. 2022. PMID: 36092630 Free PMC article.
-
Supplementing probiotics during intermittent fasting proves more effective in restoring ileum and colon tissues in aged rats.J Cell Mol Med. 2024 Mar;28(6):e18203. doi: 10.1111/jcmm.18203. J Cell Mol Med. 2024. PMID: 38445809 Free PMC article.
-
Micro-Fourier-transform infrared reflectance spectroscopy as tool for probing IgG glycosylation in COVID-19 patients.Sci Rep. 2022 Mar 11;12(1):4269. doi: 10.1038/s41598-022-08156-6. Sci Rep. 2022. PMID: 35277543 Free PMC article.
-
Exploring the therapeutic potential of plasma from intermittent fasting and untreated rats on aging-induced liver damage.J Cell Mol Med. 2024 Jun;28(12):e18456. doi: 10.1111/jcmm.18456. J Cell Mol Med. 2024. PMID: 38923278 Free PMC article.
-
Two-trace two-dimensional correlation spectra (2T2D-COS) analysis using FTIR spectra to monitor the immune response by COVID-19.J Mol Med (Berl). 2024 Jan;102(1):53-67. doi: 10.1007/s00109-023-02390-9. Epub 2023 Nov 10. J Mol Med (Berl). 2024. PMID: 37947852
References
-
- Backhaus J Mueller R Formanski N Szlama N Meerpohl HG Diagnosis of breast cancer with infrared spectroscopy from serum samples. Vibrational Spectroscopy. 2010;52:173–177.
-
- Barauna VG Singh MN Barbosa LL Marcarini WD Vassallo PF Ultrarapid on-site detection of sars-cov‑2 infection using simple atr-ftir spectroscopy and an analysis algorithm: high sensitivity and specificity. Analytical Chemistry. 2021;93:2950–2958. - PubMed
LinkOut - more resources
Full Text Sources
Miscellaneous
