. 2021 Oct 3;17(15):4140-4153.
doi: 10.7150/ijbs.64152. eCollection 2021.

Long term usage of dexamethasone accelerating accelerates the initiation of osteoarthritis via enhancing chondrocyte apoptosis and the extracellular matrix calcification and apoptosis of chondrocytes

Affiliations

Long term usage of dexamethasone accelerating accelerates the initiation of osteoarthritis via enhancing chondrocyte apoptosis and the extracellular matrix calcification and apoptosis of chondrocytes

Liang Chen et al. Int J Biol Sci. .

Abstract

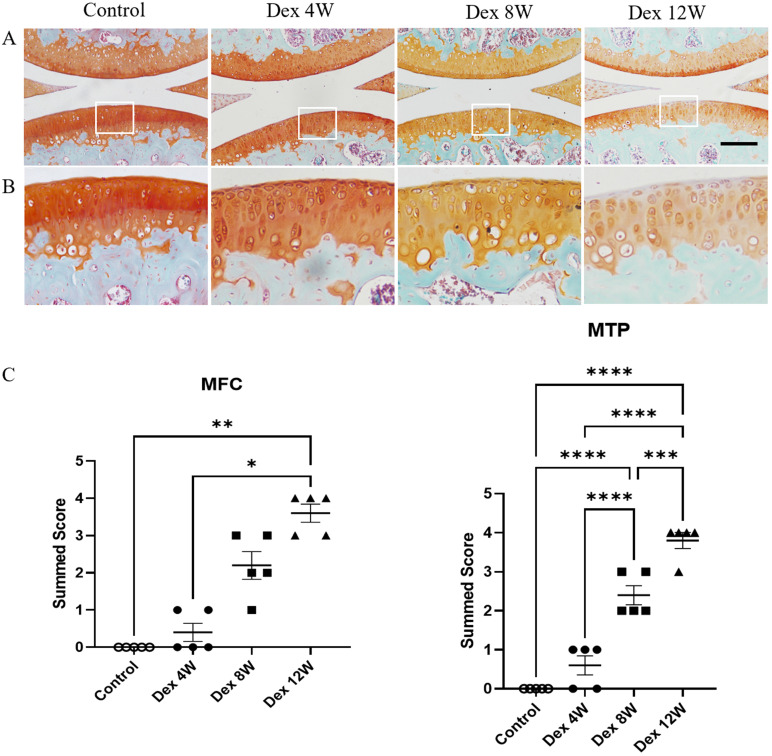
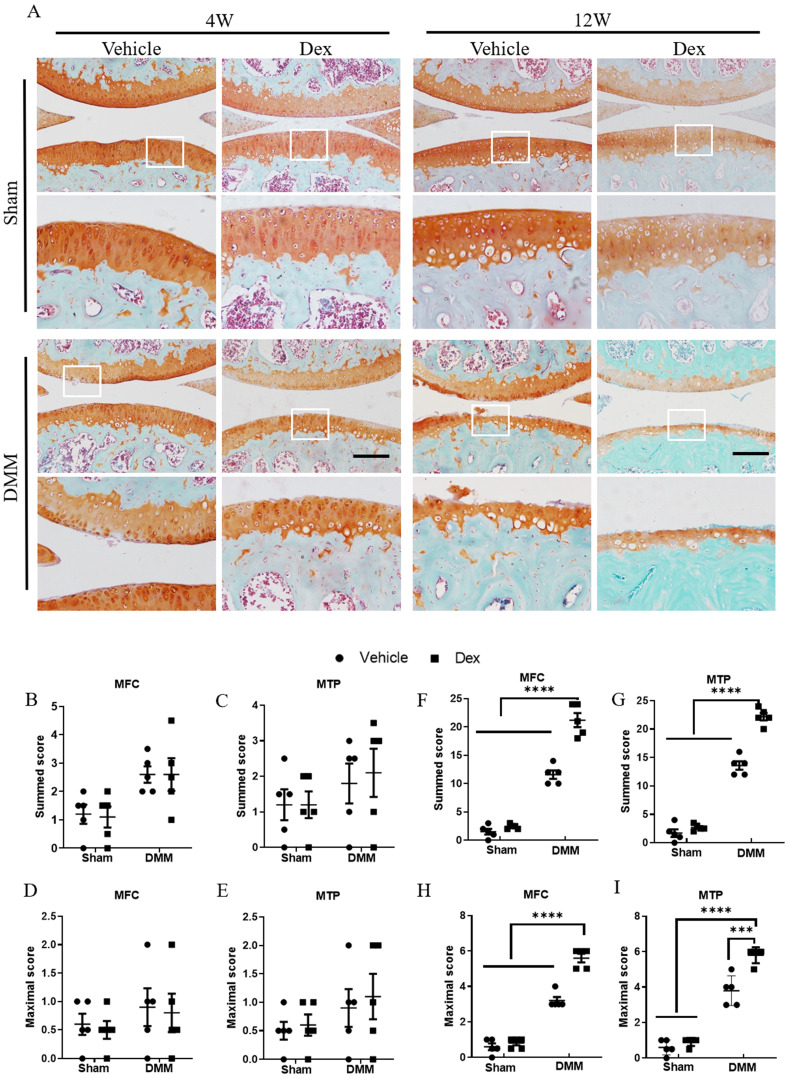
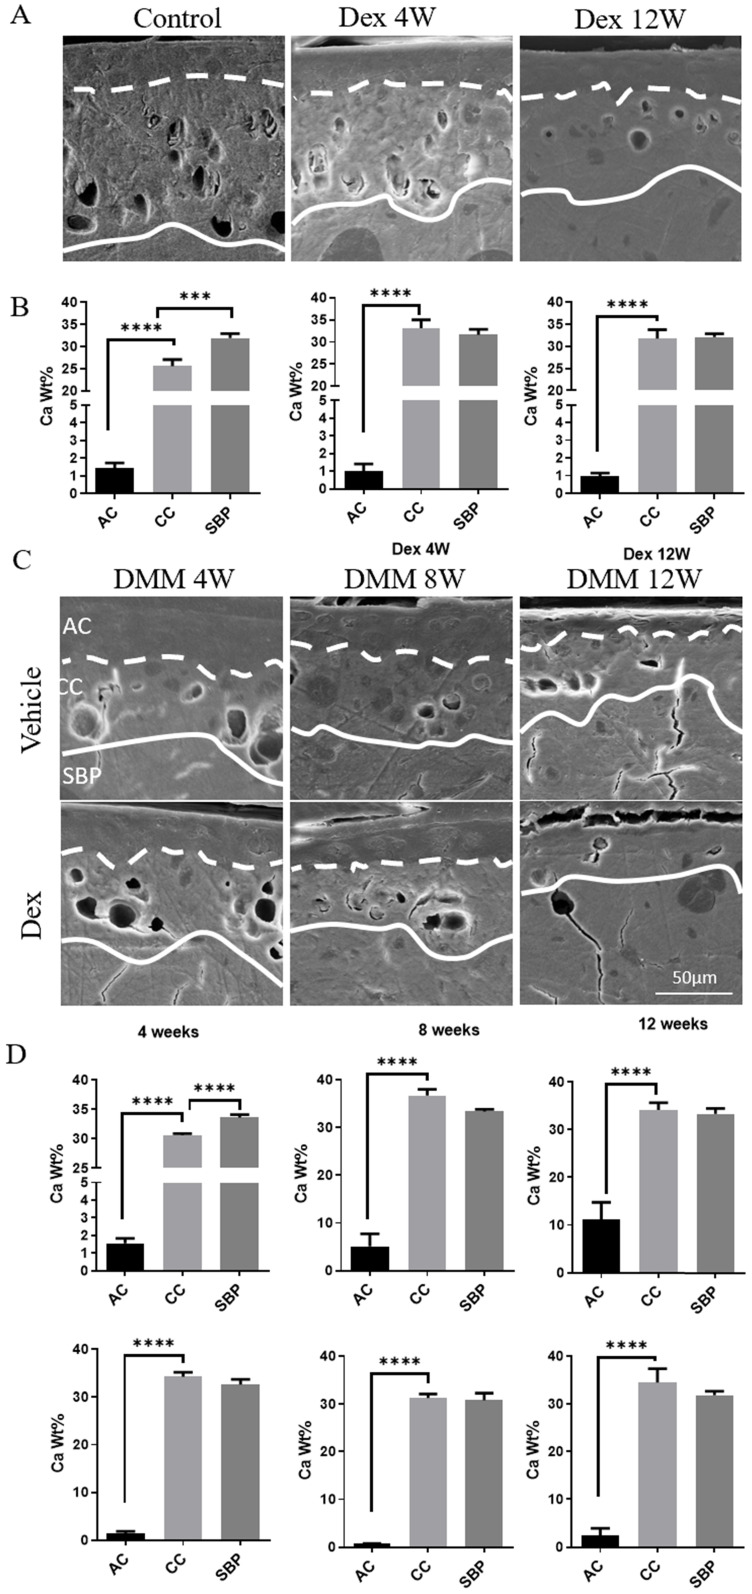
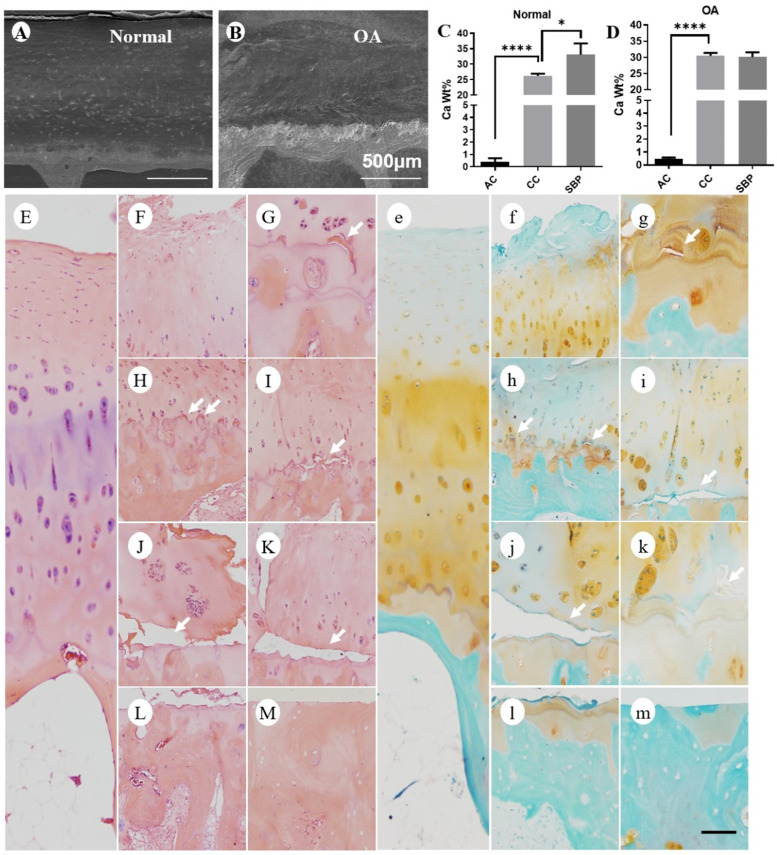
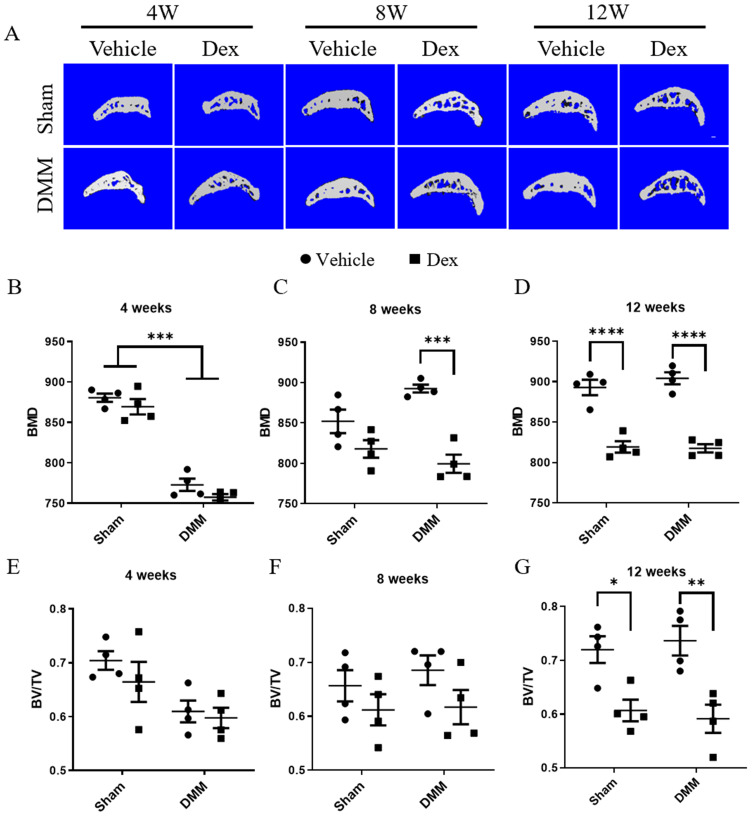
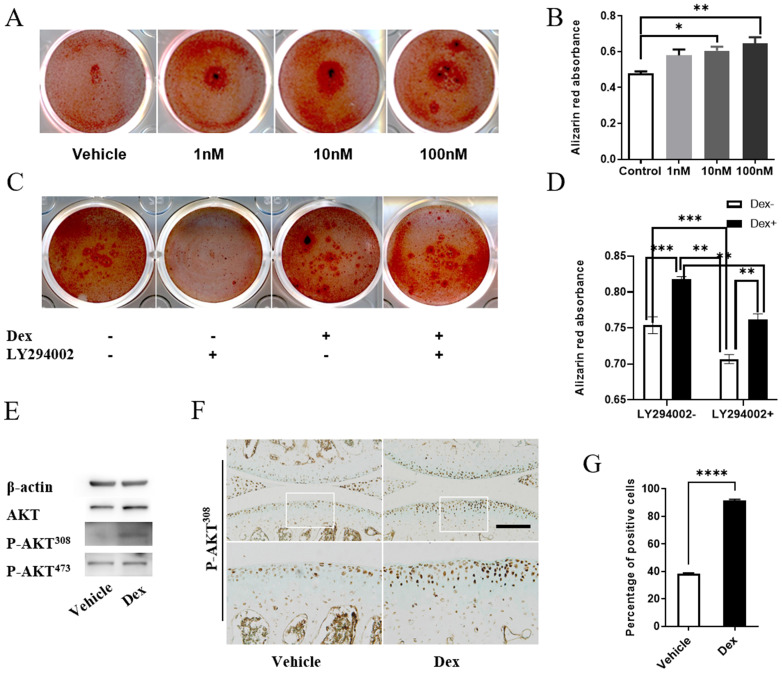
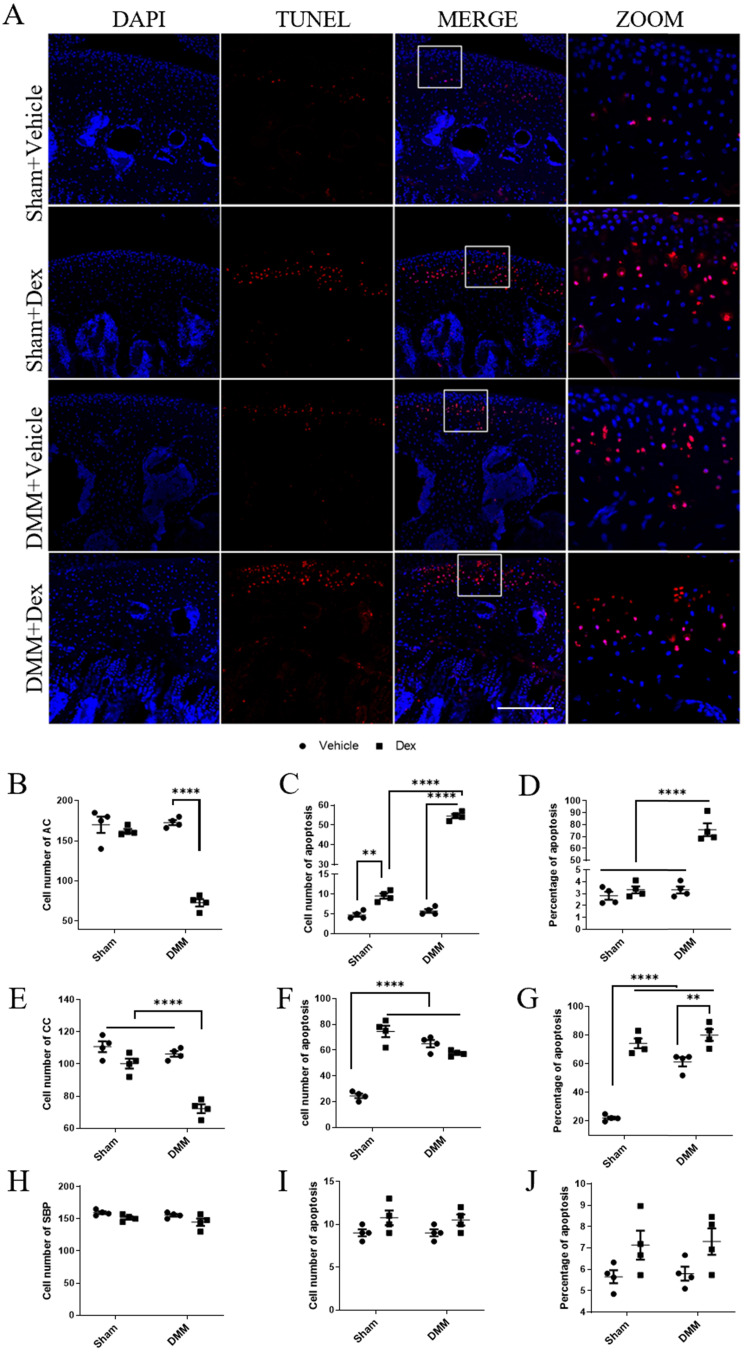
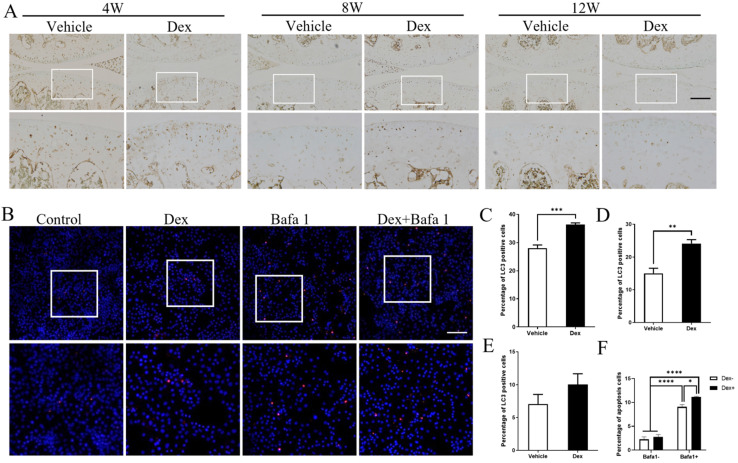
Systemic application of glucocorticoids is an essential anti-inflammatory and immune-modulating therapy for severe inflammatory or autoimmunity conditions. However, its long-term effects on articular cartilage of patients' health need to be further investigated. In this study, we studied the effects of dexamethasone (Dex) on the homeostasis of articular cartilage and the progress of destabilization of medial meniscus (DMM)-induced osteoarthritis (OA) in adult mice. Long-term administration of Dex aggravates the proteoglycan loss of articular cartilage and drastically accelerates cartilage degeneration under surgically induced OA conditions. In addition, Dex increases calcium content in calcified cartilage layer of mice and the samples from OA patients with a history of long-term Dex treatment. Moreover, long term usage of Dex results in decrease subchondral bone mass and bone density. Further studies showed that Dex leads to calcification of extracellular matrix of chondrocytes partially through activation of AKT, as well as promotes apoptosis of chondrocytes in calcified cartilage layer. Besides, Dex weakens the stress-response autophagy with the passage of time. Taken together, our data indicate that long-term application of Dex may predispose patients to OA and or even accelerate the OA disease progression development of OA patients.

Keywords: AKT; apoptosis; articular cartilage; calcification; dexamethasone.


Conflict of interest statement

Competing Interests: The authors have declared that no competing interest exists.

Figures

Figure 1
Figure 1
Histologic features of mouse articular cartilage at 4, 8 and 12 weeks following long term usage of Dex. (A) Representative images of Safranin O-fast green-stained sections of knee joints from intraperitoneal Dex injection mice at 4, 8 and 12 weeks. (B) Expansion of the region occupied by articular cartilage. (C) OARSI scoring system showed more severe proteoglycan depletion in the medial femur and tibia of mice following long term usage of Dex with advancing time (n = 5). MFC: medial femoral condyle; MTP: medial tibial plateau. Scale bar: 100 µm. Comparisons of multiple groups were evaluated using analysis of variance (ANOVA) followed by Tukey's test. Data were expressed as the mean ± SEM. *, P < 0.05; **, P < 0.01; ***, P < 0.001; ****, P < 0.0001.
Figure 2
Figure 2
Histologic analysis of structural damage in the articular cartilage following long term usage of Dex in experimental OA model. (A) The articular cartilage was stained with Safranin O-fast green at 4 and 12 weeks after DMM surgery following long term usage of Dex to assess the extent of articular cartilage degeneration, expansion of the region occupied by articular cartilage. (B-E) OARSI scoring system showed intraperitoneal Dex injection exacerbates the pathological severity of articular cartilage at 4 weeks after DMM surgery (n = 5). (F-I) OARSI scoring system showed intraperitoneal Dex injection exacerbates the pathological severity of articular cartilage at 12 weeks after DMM surgery (n = 5). MFC: medial femoral condyle; MTP: medial tibial plateau. Scale bar: 100 µm. Comparisons of multiple groups were evaluated using analysis of variance (ANOVA) followed by Tukey's test. Data were expressed as the mean ± SEM. *, P < 0.05; **, P < 0.01; ***, P < 0.001; ****, P < 0.0001.
Figure 3
Figure 3
Calcium content analysis of articular cartilage in normal and experimental OA model following long term usage of Dex. (A) Representative images of scanning electron microscopy of articular cartilage with or without Dex. (B) Calcium content in each layer of articular cartilage (non-calcified cartilage layer: AC, calcified cartilage layer: CC, subchondral bone plate: SBP) was determined by energy dispersive spectrometer analysis at 4 and 12 weeks compared with control group with intraperitoneal injection of Dex (n = 3). (C) Representative images of scanning electron microscopy of articular cartilage at 4, 8 and 12 weeks after DMM surgery with or without Dex. (D) Calcium content in each layer of articular cartilage (non-calcified cartilage layer: AC, calcified cartilage layer: CC, subchondral bone plate: SBP) was determined by energy dispersive spectrometer analysis at 4, 8 and 12 weeks after DMM surgery with or without Dex (n = 3). Scale bar: 50 µm. Comparisons of multiple groups were evaluated using analysis of variance (ANOVA) followed by Tukey's test. Data were expressed as the mean ± SD. *, P < 0.05; **, P < 0.01; ***, P < 0.001; ****, P < 0.0001.
Figure 4
Figure 4
Calcium content and histologic analysis of articular cartilage in normal and OA patients with a history of long-term usage of Dex. (A-B) Representative images of scanning electron microscopy of articular cartilage in normal (A) and OA (B) patients. (C-D) Calcium content in each layer of articular cartilage (non-calcified cartilage layer: AC, calcified cartilage layer: CC, subchondral bone plate: SBP) was determined by energy dispersive spectrometer in normal (C) and OA (D) patients (n = 3). Scale bar: 500 µm. Comparisons of multiple groups were evaluated using analysis of variance (ANOVA) followed by Tukey's test. Data were expressed as the mean ± SD. *, P < 0.05; **, P < 0.01; ***, P < 0.001; ****, P < 0. 0001. The articular cartilage was stained with H & E (E-M) and Safranin O-fast green (e-m) in normal (E and e) and OA (F-M and f-m) patients (n = 3). Lots of horizontal clefts (arrowheads) can be found in sections of OA patients' samples. Scale bar: 100 µm.
Figure 5
Figure 5
Micro-CT analysis the effects of long-term usage of Dex on subchondral bone after DMM surgery. (A) Micro-CT 3D images of subchondral bone in tibia at 4, 8 and 12 weeks after DMM surgery with or without Dex. (B-D) Results showing relative bone mass density (BMD), measurement in the total subchondral bone of tibia with vehicle and Dex treatment after DMM or sham operation (n = 4), showing that the BMD was decreased of tibia at 12 weeks with or without DMM surgery. (E-G) Results showing relative bone volume fraction (bone volume/total volume, BV/TV), measurement in the total subchondral bone of tibia with vehicle and Dex treatment after DMM or sham operation, showing that the BV/TV was decreased of tibia at 12 weeks with or without DMM surgery (n = 4). Comparisons of multiple groups were evaluated using analysis of variance (ANOVA) followed by Tukey's test. Data were expressed as the mean ± SEM. *, P < 0.05; **, P < 0.01;***, P < 0.001; ****, P < 0.0001.
Figure 6
Figure 6
Dex induces calcification of ECM partially by activating AKT signaling. (A) Alizarin red staining to assess the extent of extracellular matrix calcification of Dex at different concentration in primary chondrocytes. (B) Alizarin red absorbance was detected by microplate reader at 562 nm (n = 3). (C) Alizarin red staining to assess the extent of extracellular matrix calcification of 10 nM Dex with or without AKT inhibitor LY294002 in primary chondrocytes. (D) Alizarin red absorbance was detected by microplate reader at 562 nm (n = 6). (E) Cell lysates of primary chondrocytes were analyzed by western blotting using antibodies of AKT, P-AKT308, P-AKT473 (n = 3). (F) IHC analysis of P-AKT308 protein expression in articular cartilage of mice at 4 weeks after DMM surgery with or without Dex, expansion of the region occupied by articular cartilage, Scale bar: 100 µm. (G) The percentage of cells that are positive for P-AKT308 in the articular cartilage were calculated (n = 4). Differences between two groups were evaluated using Student's unpaired t-test, and comparisons of multiple groups were evaluated using analysis of variance (ANOVA) followed by Tukey's test. Data were expressed as the mean ± SEM. *, P < 0.05; **, P < 0.01; ***, P < 0.001; ****, P < 0.0001.
Figure 7
Figure 7
Effects of long term usage of Dex on chondrocyte apoptosis in mice at 8 weeks after DMM. (A) TUNEL assay was performed on knee joints to measure chondrocyte apoptosis at 8 weeks either sham operation or after DMM surgery with or without long term usage of Dex. (B-J) The total number of cells (B, E, H), the number of apoptotic cells (C, F, I) and the proportion of apoptotic cells (D, G, J) in non-calcified cartilage layer (B-D), calcified cartilage layer (E-G) and subchondral bone plate (H-J) were calculated (n = 4). Scale bar: 500 µm. Comparisons of multiple groups were evaluated using analysis of variance (ANOVA) followed by Tukey's test. Data were expressed as the mean ± SEM. *, P < 0.05; **, P < 0.01; ****, P < 0.0001.
Figure 8
Figure 8
Effects of repeated Dex on LC3 expression in articular cartilage in DMM mice model. (A) The effect of Dex on LC3 expression in articular cartilage of DMM mice was analyzed by IHC. (B) TUNEL assay was used to analyze the effect of autophagy inhibitor Baf-A1 on the apoptosis of primary chondrocytes with or without Dex, the percentage of apoptosis cells in the articular cartilage were calculated (n = 3). Scale bar: 100 µm. (C-E) Quantification of cells positive for LC3 in articular cartilage of vehicle and Dex group at 4 weeks (B), 8 weeks (C) and 12 weeks (D) after DMM surgery, respectively (n = 4). (F) Quantification of apoptotic cells in cultured primary chondrocytes (n = 3). Differences between two groups were evaluated using Student's unpaired t-test, and comparisons of multiple groups were evaluated using analysis of variance (ANOVA) followed by Tukey's test. Data were expressed as the mean ± SEM. *, P < 0.05; **, P < 0.01; ***, P < 0.001; ****, P < 0.0001.

Similar articles

Cited by

References

    1. Yoon BH, Jones LC, Chen CH, Cheng EY, Cui Q, Drescher W. et al. Etiologic Classification Criteria of ARCO on Femoral Head Osteonecrosis Part 1: Glucocorticoid-Associated Osteonecrosis. The Journal of arthroplasty. 2019;34:163–8.e1. - PubMed
    1. McDonough AK, Curtis JR, Saag KG. The epidemiology of glucocorticoid-associated adverse events. Current opinion in rheumatology. 2008;20:131–7. - PubMed
    1. van Staa TP, Leufkens HG, Abenhaim L, Begaud B, Zhang B, Cooper C. Use of oral corticosteroids in the United Kingdom. QJM: monthly journal of the Association of Physicians. 2000;93:105–11. - PubMed
    1. Whirledge S, DeFranco DB. Glucocorticoid Signaling in Health and Disease: Insights From Tissue-Specific GR Knockout Mice. Endocrinology. 2018;159:46–64. - PMC - PubMed
    1. Cooper C, Steinbuch M, Stevenson R, Miday R, Watts NB. The epidemiology of osteonecrosis: findings from the GPRD and THIN databases in the UK. Osteoporosis international: a journal established as result of cooperation between the European Foundation for Osteoporosis and the National Osteoporosis Foundation of the USA. 2010;21:569–77. - PMC - PubMed

Publication types