

SOCS2 Suppresses Inflammation and Apoptosis during NASH Progression through Limiting NF-κB Activation in Macrophages
- PMID: 34803490
- PMCID: PMC8579457
- DOI: 10.7150/ijbs.63889
SOCS2 Suppresses Inflammation and Apoptosis during NASH Progression through Limiting NF-κB Activation in Macrophages
Abstract
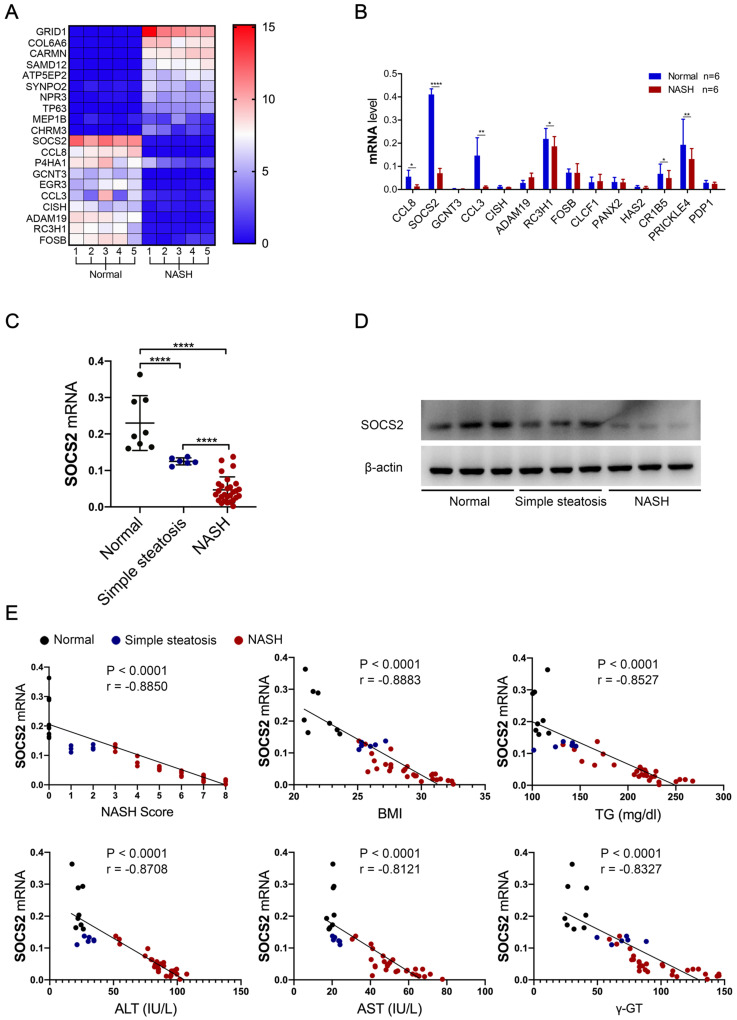
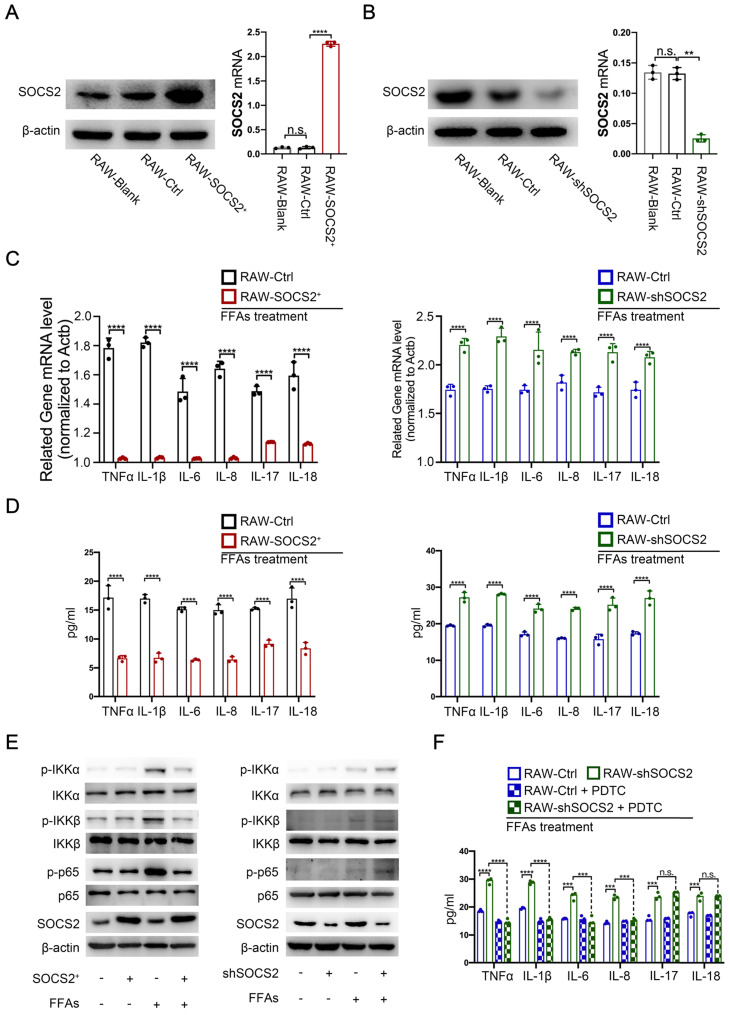
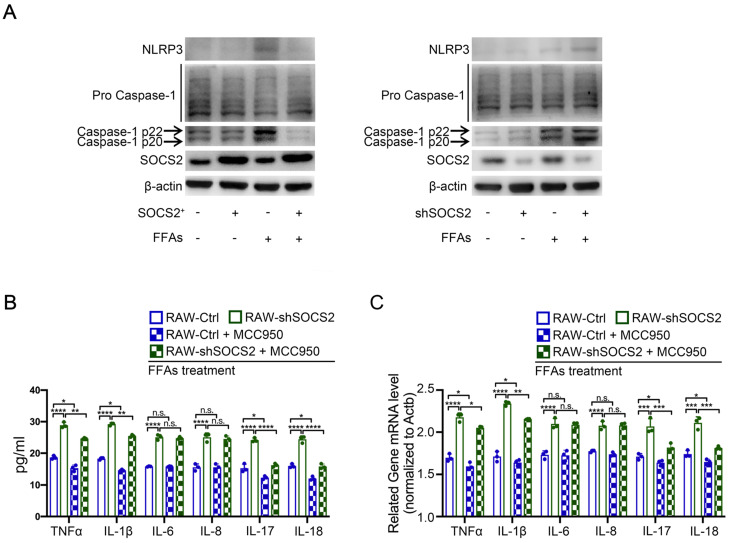
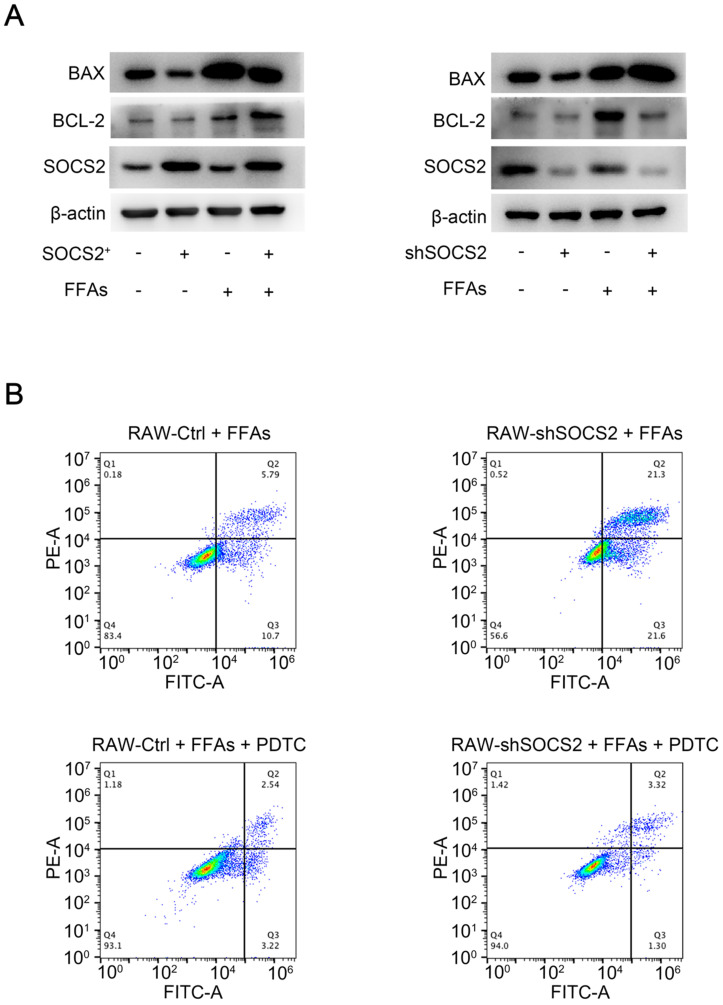
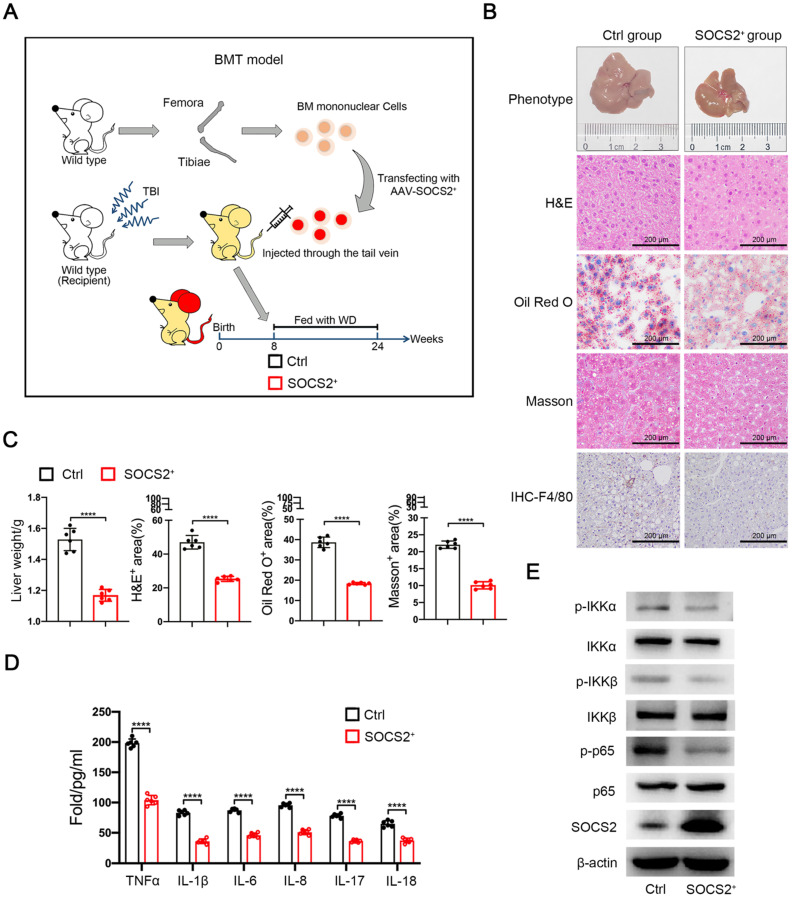
Background: Inflammation and apoptosis play a crucial role in the progression of nonalcoholic steatohepatitis (NASH). Suppressor of cytokine signaling 2 (SOCS2) is one of classic negative regulators of cytokine signaling, which has recently been described as anti-inflammatory mediators. However, the role of SOCS2 in macrophages during NASH progression and the relationship among SOCS2, inflammation, apoptosis and NASH is largely unknown. Herein, we aimed to study the function of SOCS2 in NASH progression. Methods: We detected SOCS2 expression in macrophages in human subjects without steatosis, with simple steatosis and with NASH to confirm the relationship between SOCS2 and NASH. Free fatty acids was used to establish stress environment in RAW 264.7 cell lines stably overexpressing or knockdown SOCS2. In vitro and vivo assays also performed to study the molecular function of SOCS2 in NASH progression. Findings: Our human samples illustrated that SOCS2 was decreased in macrophages during NASH progression and was negatively correlated to NASH level. Meanwhile, In vitro assays showed SOCS2 overexpression in macrophages suppressed inflammation and apoptosis via inhibiting NF-κB signaling pathway, while SOCS2 knock-down in macrophages caused an increased activation of NF-κB, which could be blocked by ammonium 1-pyrrolidinedithiocarbamate (PDTC). In addition, SOCS2 in macrophages also suppressed inflammation via limiting the activation of inflammasomes. Consistent with these, our BMT model also confirmed the SOCS2 function in macrophages during NASH. Interpretation: Our data strongly indicate that SOCS2 plays a role in inhibiting inflammation and apoptosis via NF-κB and inflammasome signaling pathway in macrophages during NASH. Further studies are required to explore the potential preventive and therapeutic strategies of SOCS2 for this common liver disease.
Keywords: NF-κB; Nonalcoholic steatohepatitis; Suppressor of cytokine signaling 2; apoptosis; inflammation.
© The author(s).
Conflict of interest statement
Competing Interests: The authors have declared that no competing interest exists.
Figures
Similar articles
-
PTPROt aggravates inflammation by enhancing NF-κB activation in liver macrophages during nonalcoholic steatohepatitis.Theranostics. 2020 Apr 6;10(12):5290-5304. doi: 10.7150/thno.42658. eCollection 2020. Theranostics. 2020. PMID: 32373213 Free PMC article.
-
Fibrinogen-like protein 2 aggravates nonalcoholic steatohepatitis via interaction with TLR4, eliciting inflammation in macrophages and inducing hepatic lipid metabolism disorder.Theranostics. 2020 Aug 1;10(21):9702-9720. doi: 10.7150/thno.44297. eCollection 2020. Theranostics. 2020. PMID: 32863955 Free PMC article.
-
Cannabidiol protects livers against nonalcoholic steatohepatitis induced by high-fat high cholesterol diet via regulating NF-κB and NLRP3 inflammasome pathway.J Cell Physiol. 2019 Nov;234(11):21224-21234. doi: 10.1002/jcp.28728. Epub 2019 Apr 29. J Cell Physiol. 2019. PMID: 31032942
-
Tumor necrosis factor-α signaling in nonalcoholic steatohepatitis and targeted therapies.J Genet Genomics. 2022 Apr;49(4):269-278. doi: 10.1016/j.jgg.2021.09.009. Epub 2021 Oct 28. J Genet Genomics. 2022. PMID: 34757037 Review.
-
NF-κB and tPA Signaling in Kidney and Other Diseases.Cells. 2020 May 29;9(6):1348. doi: 10.3390/cells9061348. Cells. 2020. PMID: 32485860 Free PMC article. Review.
Cited by
-
Desflurane alleviates LPS-induced acute lung injury by modulating let-7b-5p/HOXA9 axis.Immunol Res. 2024 Aug;72(4):683-696. doi: 10.1007/s12026-024-09474-9. Epub 2024 Apr 27. Immunol Res. 2024. PMID: 38676899
-
Unraveling the Mystery of Insulin Resistance: From Principle Mechanistic Insights and Consequences to Therapeutic Interventions.Int J Mol Sci. 2025 Mar 19;26(6):2770. doi: 10.3390/ijms26062770. Int J Mol Sci. 2025. PMID: 40141412 Free PMC article. Review.
-
Temporal dichotomy of neutrophil function in acute liver injury and repair.JHEP Rep. 2025 Apr 11;7(7):101417. doi: 10.1016/j.jhepr.2025.101417. eCollection 2025 Jul. JHEP Rep. 2025. PMID: 40606123 Free PMC article.
-
Programmed cell death and lipid metabolism of macrophages in NAFLD.Front Immunol. 2023 Jan 18;14:1118449. doi: 10.3389/fimmu.2023.1118449. eCollection 2023. Front Immunol. 2023. PMID: 36742318 Free PMC article. Review.
-
Identification of pyroptosis-related gene signature in nonalcoholic steatohepatitis.Sci Rep. 2024 Feb 7;14(1):3175. doi: 10.1038/s41598-024-53599-8. Sci Rep. 2024. PMID: 38326642 Free PMC article.
References
-
- Eslam M, Valenti L, Romeo S. Genetics and epigenetics of NAFLD and NASH: Clinical impact. Journal of Hepatology. 2018;68:268–79. - PubMed
-
- Byrne CD, Targher G. NAFLD: a multisystem disease. J Hepatol. 2015;62:S47–64. - PubMed
-
- Hernandez-Gea V, Friedman SL. Pathogenesis of Liver Fibrosis. Annual Review of Pathology: Mechanisms of Disease. 2011;6:425–56. - PubMed
Publication types
MeSH terms
Substances
LinkOut - more resources
Full Text Sources
Medical
