. 2021 Oct 11;17(15):4207-4222.
doi: 10.7150/ijbs.64714. eCollection 2021.

Targeted Inhibition of LPL/FABP4/CPT1 fatty acid metabolic axis can effectively prevent the progression of nonalcoholic steatohepatitis to liver cancer

Affiliations

Targeted Inhibition of LPL/FABP4/CPT1 fatty acid metabolic axis can effectively prevent the progression of nonalcoholic steatohepatitis to liver cancer

Haoran Yang et al. Int J Biol Sci. .

Abstract

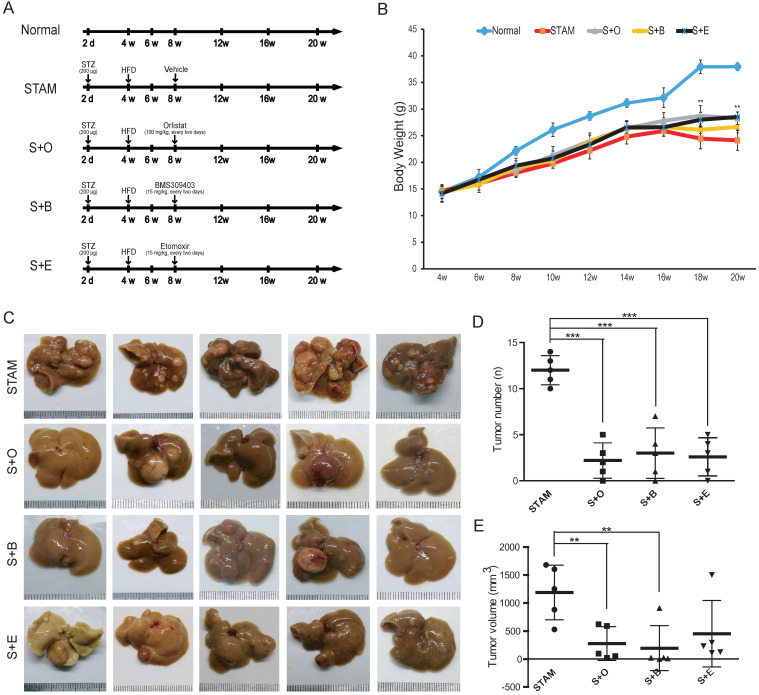
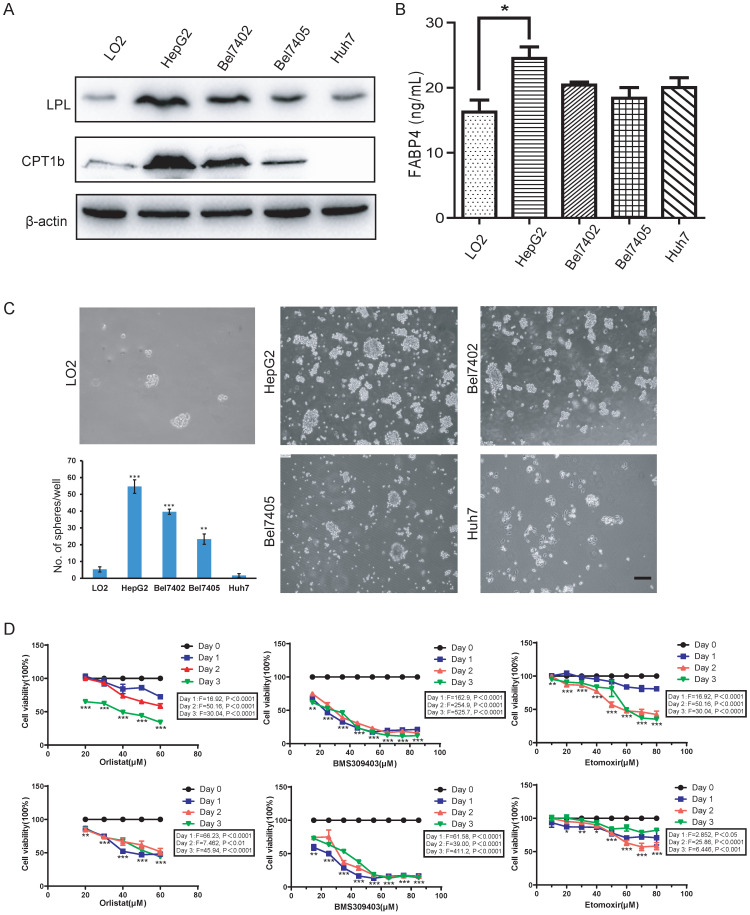
Rationale: Nonalcoholic steatohepatitis (NASH), as one of the key stages in the development of nonalcoholic fatty liver disease (NAFLD), can directly progress to HCC, but the underlying mechanism is not fully understood. Methods: Differentially expressed genes (DEGs) in each stage of disease development were studied through a GEO dataset deriving from a Stelic Animal Model (STAM), which can simulate the evolution of NAFLD/NASH to HCC in humans. GSVA analysis was performed to analyze the differentially expressed oncogenic signatures in each stage. A human NAFLD-related dataset from GEO database was utilized for gene expression verification and further validated in the protein level in STAM mice. Small molecule inhibitors were applied to STAM mice for investigating whether inhibition of the LPL/FABP4/CPT1 axis could prevent the occurrence of NASH-related HCC in vivo. Microsphere formation and clonal formation assays in vitro were applied to study if inhibition of the LPL/FABP4/CPT1 axis can reduce the viability of liver cancer stem cells (LCSCs). Results: We found that upregulation of the LPL/FABP4/CPT1 molecular axis, as a fatty acid metabolic reprogramming process, occurred specifically during the NASH phase. GSVA analysis showed widespread activation of a large number of oncogenic signals, which may contribute to malignant transformation during NASH. Furthermore, inhibition of the LPL/FABP4/CPT1 axis could effectively delay the tumor growth in STAM mice. Cell assays revealed inhibitors targeting this axis can significantly reduce the sphere-forming, proliferation, and clonality of LCSCs. Conclusion: These results suggest that activation of the LPL/FABP4/CPT1 axis is essential for LCSCs maintenance, which acts synergistically with a variety of up-regulated oncogenic signals that drive the hepatocyte-LCSCs transdifferentiation during NASH to HCC progression. Thus, targeting the LPL/FABP4/CPT1 axis may provide a potential direction for NASH-related HCC prevention.

Keywords: Fatty acid metabolism; Gene differential expression; Hepatocellular carcinoma; Metabolic reprogramming; Nonalcoholic steatohepatitis.


Conflict of interest statement

Competing Interests: The authors have declared that no competing interest exists.

Figures

Figure 1
Figure 1
Identification of shared differentially expressed genes (DEGs) in NASH and HCC. A, Venn Diagrams were used to analyze common DEGs, including both upregulated and down-regulated, in liver samples of STAM mice (12W, 20W) and HCC samples from TCGA, but not altered in 6w-STAM mice. The number of common DEGs is shown in the black box. B, Top two functional modules (Module 1 and 2) were displayed after being analyzed by the MCODE plugin in Cytoscape software. C, GO analysis of genes contained in Module 1 and 2. D, KEGG analysis of genes contained in Module 1 and 2. Genes from Module 1 are mainly enriched in the process of “Cell cycle”, whereas genes from Module 2 are enriched in the “PPAR signaling pathway”. E, Expression levels of some common DEGs were verified in human liver samples, including normal (Not NAFLD), NAFLD without NASH, Borderline NASH, Defined NASH specimens (one-way ANOVA was used for statistical analysis).
Figure 2
Figure 2
GSVA analysis indicated a widespread activation of oncogenic signals during the NASH phase. A, The volcanic map showed the changes of oncogenic signatures' expressions at each stage of the NAFLD/NASH-HCC development. B, Heatmap shows oncogenic signatures that changed at week 12. C, Venn diagram shows oncogenic signals that remained active at weeks 12 and 20. D, The hypothetical model: Activation of the LPL/FABP4/CPT1 metabolic axis is essential for NASH progression to HCC. During the NASH phase, multiple oncogenic signals are activated to drive the transdifferentiation of hepatocytes into liver cancer stem cells (LCSCs), while LPL/FABP4/CPT1 metabolic axis provides materials and energy to facilitate the proliferation and self-renewal of LCSCs.
Figure 3
Figure 3
The protein expression of LPL/FABP4/CPT1 during the progression of NAFLD was verified in the STAM mouse model. A, Experimental schematic diagram for STAM mouse model establishment: In the Normal group and STAM group, the dose and time of administration are indicated by (⬇). B, In the STAM mice, the liver/body weight ratios at different stages (4w, 8w, 12w, 16w and 20w) were displayed. (*P < 0.05, **P < 0.01 vs 4w, n = 5 independent experiments). C, In the Normal group and STAM group, compared with 4w, the glycemic index of mice at different stages was analyzed (**P < 0.01, ***P < 0.001, n=5 independent experiments). D, Representative liver images of STAM mice at 4, 8, 12, 16 and 20 weeks. The panel includes gross appearance (scale bars, 1 mm), hematoxylin and eosin (HE) staining (scale bars, 100 μm), and immunohistochemistry (IHC) analysis with anti-LPL, FABP4, and CPT1b antibodies (scale bars, 100 μm). E, Western blot showed that the levels of LPL, FABP4 and CPT1b in the liver tissues of STAM mice increased gradually during NAFLD development, as showed at 4, 8, 12, 16 and 20 weeks. F, The number of liver tumors in the STAM mice during NAFLD development, as shown at 4, 8, 12, 16 and 20 weeks. Comparisons of data were performed with a paired two-tailed Student's t-test. Data are shown as mean ± SD. (*P < 0.05, **P < 0.01, ***P < 0.001 as compared with the value of the preceding point in time, n=3 in each group).
Figure 4
Figure 4
Reduction of tumor burden in the liver of STAM mouse following inhibitors treatment. A, Schematic diagram of the experimental process of normal group (Normal), STAM group (STAM), Orlistat inhibitor group (S+O), BMS4903403 inhibitor group (S+B) and Etomoxir inhibitor group (S+E). The doses and time points of drug administration are indicated by ⬇. B, Changes of body weight of mice in the experimental group (*P < 0.05, **P < 0.01 vs 4w, n=5 independent experiments). C, The gross appearance (Scale bars, 1 mm) of the liver in each group. D & E, The number and volume of liver tumor burdens in each group (a paired two-tailed Student's t-test was used for statistical analysis) (**P < 0.01, ***P < 0.001, n=5 in each group).
Figure 5
Figure 5
The LPL/FABP4/CPT1 molecules regulate the ability of spheroid formation of HCC cell lines. A, Western blot analysis of LPL and CPT1b in human normal hepatocytes LO2, and other different HCC cell lines. β-Actin was used as a loading control. B, By ELISA analysis, FABP4 was found to be highly expressed in the supernatant of HCC cell lines, especially in HepG2 (*P < 0.05 vs Control (LO2), n = 3 independent experiments). C, LO2, HepG2, Bel7402, Bel7405 and Huh7 cells were used for spheroid formation assay. A paired two-tailed Student's t-test was used for statistical analysis. Error bars = mean ± S.D (Scale bars, 100 μm, n=4 independent experiments). D, MTT results showed that the inhibition of LPL/FABP4/CPT1 molecular activity can slow down the proliferation of HepG2 and Bel7402 cells (n = 3 independent experiments). The difference of inhibition levels between different concentrations at the same time point (data in the box) and the difference of inhibition levels between the same concentration at different time points (represented by *, **, ***) were obtained by one-way ANOVA analysis.
Figure 6
Figure 6
LPL/FABP4/CPT1 molecular inhibitors inhibit the self-renewal of LCSCs. Tumor spheres (TS) were collected for the second round of spheroid formation assay. HepG2-TS (A) and Bel7402-TS (B) cells were again subjected to a spheroid formation assay supplied with LPL, FABP4 and CPT1 inhibitors. The size and volume of the spheroids of these cells were significantly decreased after the treatment of inhibitors. C, Under the administrations of LPL, FABP4 and CPT1 molecular inhibitors, HepG2-TS and Bel7402-TS cells were subjected to plate colony formation experiments. Representative pictures for colony growth are shown (10 cm dishes). Quantification of the number of colonies was shown. A paired two-tailed Student's t-test was used for statistical analysis. Data are shown as mean ± S.D. (*P < 0.05, **P < 0.01, ***P < 0.001 vs Control, n = 3 independent experiments).

References

    1. Lafaro KJ, Demirjian AN, Pawlik TM. Epidemiology of Hepatocellular Carcinoma. Surgical Oncology Clinics of North America. 2015;24:1–17. - PubMed
    1. El-Serag HB. Epidemiology of Hepatocellular Carcinoma. Liver. 2020;59:758–72.
    1. Sia D, Villanueva A, Friedman SL, Llovet JM. Liver Cancer Cell of Origin, Molecular Class, and Effects on Patient Prognosis. Gastroenterology. 2017;152:745–61. - PubMed
    1. Sagnelli E, Macera M, Russo A, Coppola N, Sagnelli C. Epidemiological and etiological variations in hepatocellular carcinoma. Infection. 2020;48:7–17. - PubMed
    1. Loftfield E, Rothwell JA, Sinha R, Keskirahkonen P, Robinot N, Albanes D. et al. Prospective Investigation of Serum Metabolites, Coffee Drinking, Liver Cancer Incidence, and Liver Disease Mortality. Journal of the National Cancer Institute. 2020;112:286–94. - PMC - PubMed

Publication types

MeSH terms