. 2021 Oct 17;17(15):4254-4270.
doi: 10.7150/ijbs.60805. eCollection 2021.

MicroRNA-196a promotes renal cancer cell migration and invasion by targeting BRAM1 to regulate SMAD and MAPK signaling pathways

Affiliations

MicroRNA-196a promotes renal cancer cell migration and invasion by targeting BRAM1 to regulate SMAD and MAPK signaling pathways

Jianzhou Cui et al. Int J Biol Sci. .

Abstract

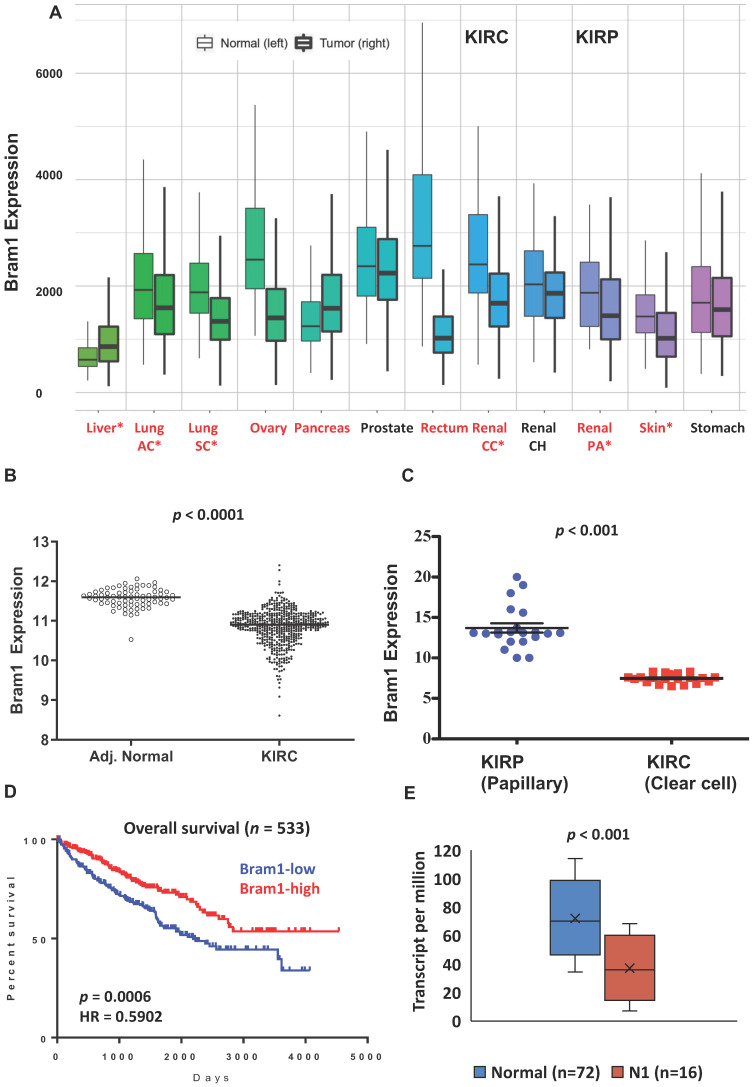
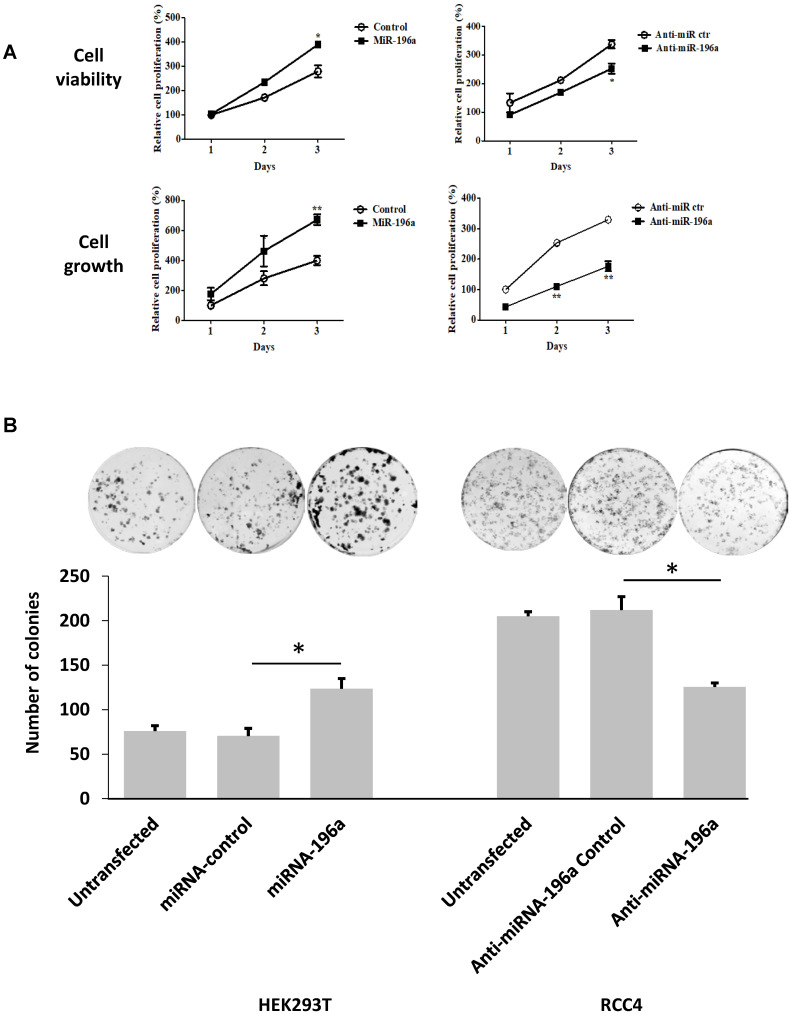
Rationale: MicroRNAs (miRNAs) are endogenous ~22nt RNAs that play critical regulatory roles in various biological and pathological processes, including various cancers. Their function in renal cancer has not been fully elucidated. It has been reported that miR-196a can act as oncogenes or as tumor suppressors depending on their target genes. However, the molecular target for miR-196a and the underlying mechanism in miR-196a promoted cell migration and invasion in renal cancer is still not clear. Methods: The expression, survival and correlation between miR-196a and BRAM1 were investigated using TCGA analysis and validated by RT-PCR and western blot. To visualize the effect of Bram1 on tumor metastasis in vivo, NOD-SCID gamma (NSG) mice were intravenously injected with RCC4 cells (106 cells/mouse) or RCC4 overexpressing Bram1. In addition, cell proliferation assays, migration and invasion assays were performed to examine the role of miR-196a in renal cells in vitro. Furthermore, immunoprecipitation was done to explore the binding targets of Bram1. Results: TCGA gene expression data from renal clear cell carcinoma patients showed a lower level of Bram1 expression in patients' specimens compared to adjacent normal tissues. Moreover, Kaplan‑Meier survival data clearly show that high expression of Bram1correlates to poor prognosis in renal carcinoma patients. Our mouse metastasis model confirmed that Bram1 overexpression resulted in an inhibition in tumor metastasis. Target-prediction analysis and dual-luciferase reporter assay demonstrated that Bram1 is a direct target of miR-196a in renal cells. Further, our in vitro functional assays revealed that miR-196a promotes renal cell proliferation, migration, and invasion. Rescue of Bram1 expression reversed miR-196a-induced cell migration. MiR-196a promotes renal cancer cell migration by directly targeting Bram1 and inhibits Smad1/5/8 phosphorylation and MAPK pathways through BMPR1A and EGFR. Conclusions: Our findings thus provide a new mechanism on the oncogenic role of miR-196a and the tumor-suppressive role of Bram1 in renal cancer cells. Dysregulated miR-196a and Bram1 represent potential prognostic biomarkers and may have therapeutic applications in renal cancer.

Keywords: Bram1; MicroRNA-196a; SMAD and MAPK pathways; migration and invasion; renal cancer.


Conflict of interest statement

Competing Interests: The authors have declared that no competing interest exists.

Figures

Figure 1
Figure 1
Expression pattern of Bram1 in clinical samples. (A) The gene expression pattern analysis of Bram1 in normal tissues and tumors based on TCGA data and (B) for KIRC. (C) Expression of Bram1 in clear cell renal cancer samples compared to papillary clinical samples. p<0.001. (D) Kaplan-Meier survival curves analysis for patients in TCGA renal clear cell carcinoma (KIRC) cohort (Red = high, blue = low; p=0.0006). (E) Expression of Bram1 in KIRC based on nodal metastasis status. Pathologic descriptions of N1: Metastases in 1 to 3 axillary lymph nodes.
Figure 2
Figure 2
Bram1 overexpression inhibits metastasis in mice. (A) BRAM 1 expression in RCC4 cells stably transfected with empty vector or Bram1 overexpressing plasmids. (B) Representative images of metastatic lungs and livers of mice injected with Bram1 overexpression vector or empty vector (EV). (C) Quantification of the metastatic foci of the lung and liver of mice injected with Bram1 overexpression vector or empty vector (EV). (D) Representative images of hematoxylin and eosin staining of metastatic lung and liver samples collected from the control and Bram1 overexpressed groups (N=Normal, T=Tumor).
Figure 3
Figure 3
Negative correlation between the miR-196a and Bram1. (A) MiR-196a overexpression in clear cell renal cancer samples and papillary clinical samples. p= 1.69E-7. (B) The negative correlation between miR-196a and Bram1 expression in clinical samples. (C, D) The expression level of miR-196a and Bram1 was quantified by RT-PCR in renal cells.
Figure 4
Figure 4
MiR-196a plays an oncogenic role in renal cells in vitro. (A) MiR-196a promotes cell proliferation in renal cells. HEK293T and RCC4 cells were transfected with miR-196a plasmids or anti-miR-196a nucleotides or negative control, followed by cell titer and crystal violet assay. Data is representative of three independent experiments. *P<0.05. **P<0.01. (B) The effect of miR-196a on colony forming ability in HEK293T and RCC4 cells. Untransfected cells and cells transfected with miR-196a plasmids or anti-miR-196a nucleotides or negative control were followed by crystal violet staining and imaging capture. Data is representative of three independent experiments. *P<0.05. (C) MiR-196a promotes renal cell migration by wound healing assay. HEK293T and RCC4 cells were transfected with miR-196a plasmids or anti-miR-196a nucleotides or negative control, followed by wound healing assay measured at 0 hr and 24 hr. The width of the wound in each well is quantified and presented as average ±SD. Data is representative for three independent experiments. **P<0.001. (D) HEK293T and RCC4 cells were transfected with miR-196a plasmids or anti-miR-196a nucleotides or negative control and seeded in the upper chamber of transwell plates. The cell number on the outside surface of this chamber was counted after 48 hours. Duplicates were performed in three independent experiments. *P<0.05.
Figure 4
Figure 4
MiR-196a plays an oncogenic role in renal cells in vitro. (A) MiR-196a promotes cell proliferation in renal cells. HEK293T and RCC4 cells were transfected with miR-196a plasmids or anti-miR-196a nucleotides or negative control, followed by cell titer and crystal violet assay. Data is representative of three independent experiments. *P<0.05. **P<0.01. (B) The effect of miR-196a on colony forming ability in HEK293T and RCC4 cells. Untransfected cells and cells transfected with miR-196a plasmids or anti-miR-196a nucleotides or negative control were followed by crystal violet staining and imaging capture. Data is representative of three independent experiments. *P<0.05. (C) MiR-196a promotes renal cell migration by wound healing assay. HEK293T and RCC4 cells were transfected with miR-196a plasmids or anti-miR-196a nucleotides or negative control, followed by wound healing assay measured at 0 hr and 24 hr. The width of the wound in each well is quantified and presented as average ±SD. Data is representative for three independent experiments. **P<0.001. (D) HEK293T and RCC4 cells were transfected with miR-196a plasmids or anti-miR-196a nucleotides or negative control and seeded in the upper chamber of transwell plates. The cell number on the outside surface of this chamber was counted after 48 hours. Duplicates were performed in three independent experiments. *P<0.05.
Figure 5
Figure 5
Bram1 is a direct target of miR-196a. (A) Gene screening for miR-196a candidate targets. HEK293T cells were transfected with miR-196a, and the expression level of indicated genes was quantified by RT-PCR. (B) The luciferase reporter containing wild-type Bram1 3'-UTR or mutant Bram1 3'-UTR was co-transfected into HEK293T cells with miR-196a plasmids and control. Luciferase activity was determined by the dual luciferase assay and normalized to Renilla activity. (C, D) HEK293T cells were transfected with empty vector or miR-196a, mRNA and protein expression were determined using RT-PCR and western blot. ***P<0.001.
Figure 6
Figure 6
Bram1 inhibits renal cell migration and invasion, but not cell growth. (A) RCC4 and HEK293T cells were transfected with Bram1 plasmids or shBram1 plasmids and its relative control (EV or sh-ctr), mRNA level of Bram1 in these cells was detected by RT-PCR. Data is representative of three independent experiments. *P<0.05. (B) RCC4 and HEK293T cells were transfected with Bram1 plasmids or shBram1 plasmids and their relative control (EV or sh-ctr). The protein level of Bram1 in these cells was detected by western blot. (C) RCC4 and HEK293T cells were transfected with Bram1 plasmids or shBram1 plasmids and its relative control (EV or sh-ctr), followed by cell titer assay. (D) RCC4 and HEK293T cells were transfected with Bram1 plasmids or shBram1 plasmids and its relative control (EV or sh-ctr), followed by transwell assay. Duplicates were performed in three independent experiments. *P<0.05. (E) RCC4 and HEK293T cells were transfected with Bram1 plasmids or shBram1 plasmids and its relative control (EV or sh-ctr), followed by wound healing assay. The width of the wound in each well is quantified and presented in average ±SD. Data is representative of three independent experiments. *P<0.05. ***P<0.001.
Figure 7
Figure 7
Bram1 inhibits cell migration and invasion via MAPK and BMP pathways by binding to EGFR and BMPR1A. (A) HEK293T cells were transfected with Bram1 or shBram1 and the expression level of phosphorylated SMAD1/5/8 and tubulin was examined by Western Blot assay. Data is representative of three independent experiments. (B) HEK293T cells were co-transfected with SMAD luciferase plasmids and Bram1 or shBram1 plasmids, and the lysate was used for luciferase assay. *P<0.05. (C, D) cells were transfected with Bram1 or shBram1, and the expression level of indicated proteins was examined by Western Blot assay. (E) Protein level of phosphate p42/44 and total p42/44 in empty vector (-) and Bram1 overexpression (+) RCC4 cells with or without U0126 treatment (10 µM, 4 hours). (F) Wound healing assay analysis the effect of MAPK inhibitor and Bram1 overexpression on cell migration (10 µM U0126 treatment for 4 hours). (G) The physical interaction between Bram1 and BMPR1A or EGFR was investigated by immunoprecipitation experiments. HEK293T cells were transfected with flag-Bram1, and treated with 50 µM BMP4, 48 hr post-transfection the lysates were collected and incubated with normal beads as a negative control or flag-beads. (H) RCC4 cells were co-transfected with miR-196a and Bram1 plasmids, the expression of Bram1 was detected by RT-PCR. *P<0.05. (I) RCC4 cells were co-transfected with miR-196a and Bram1 plasmids and seeded in the upper chamber of transwell plates. Duplicates were performed in three independent experiments. ***P<0.001. (J) RCC4 cells were co-transfected with miR-196a and Bram1 plasmids, followed by wound healing assay measured at 0 hr and 24 hr. Data is representative of three independent experiments.
Figure 7
Figure 7
Bram1 inhibits cell migration and invasion via MAPK and BMP pathways by binding to EGFR and BMPR1A. (A) HEK293T cells were transfected with Bram1 or shBram1 and the expression level of phosphorylated SMAD1/5/8 and tubulin was examined by Western Blot assay. Data is representative of three independent experiments. (B) HEK293T cells were co-transfected with SMAD luciferase plasmids and Bram1 or shBram1 plasmids, and the lysate was used for luciferase assay. *P<0.05. (C, D) cells were transfected with Bram1 or shBram1, and the expression level of indicated proteins was examined by Western Blot assay. (E) Protein level of phosphate p42/44 and total p42/44 in empty vector (-) and Bram1 overexpression (+) RCC4 cells with or without U0126 treatment (10 µM, 4 hours). (F) Wound healing assay analysis the effect of MAPK inhibitor and Bram1 overexpression on cell migration (10 µM U0126 treatment for 4 hours). (G) The physical interaction between Bram1 and BMPR1A or EGFR was investigated by immunoprecipitation experiments. HEK293T cells were transfected with flag-Bram1, and treated with 50 µM BMP4, 48 hr post-transfection the lysates were collected and incubated with normal beads as a negative control or flag-beads. (H) RCC4 cells were co-transfected with miR-196a and Bram1 plasmids, the expression of Bram1 was detected by RT-PCR. *P<0.05. (I) RCC4 cells were co-transfected with miR-196a and Bram1 plasmids and seeded in the upper chamber of transwell plates. Duplicates were performed in three independent experiments. ***P<0.001. (J) RCC4 cells were co-transfected with miR-196a and Bram1 plasmids, followed by wound healing assay measured at 0 hr and 24 hr. Data is representative of three independent experiments.

Similar articles

Cited by

References

    1. Bartel DP. MicroRNAs: genomics, biogenesis, mechanism, and function. Cell. 2004;116:281–97. - PubMed
    1. Lee RC, Feinbaum RL, Ambros V. The C. elegans heterochronic gene lin-4 encodes small RNAs with antisense complementarity to lin-14. Cell. 1993;75:843–54. - PubMed
    1. Croce CM. Causes and consequences of microRNA dysregulation in cancer. Nature reviews Genetics. 2009;10:704–14. - PMC - PubMed
    1. Lopez-Beltran A, Scarpelli M, Montironi R, Kirkali Z. 2004 WHO classification of the renal tumors of the adults. European urology. 2006;49:798–805. - PubMed
    1. Du M, Lu D, Wang Q, Chu H, Tong N, Pan X. et al. Genetic variations in microRNAs and the risk and survival of renal cell cancer. Carcinogenesis. 2014;35:1629–35. - PubMed

Publication types

MeSH terms