

ATIC inhibits autophagy in hepatocellular cancer through the AKT/FOXO3 pathway and serves as a prognostic signature for modeling patient survival
- PMID: 34803509
- PMCID: PMC8579461
- DOI: 10.7150/ijbs.65669
ATIC inhibits autophagy in hepatocellular cancer through the AKT/FOXO3 pathway and serves as a prognostic signature for modeling patient survival
Abstract
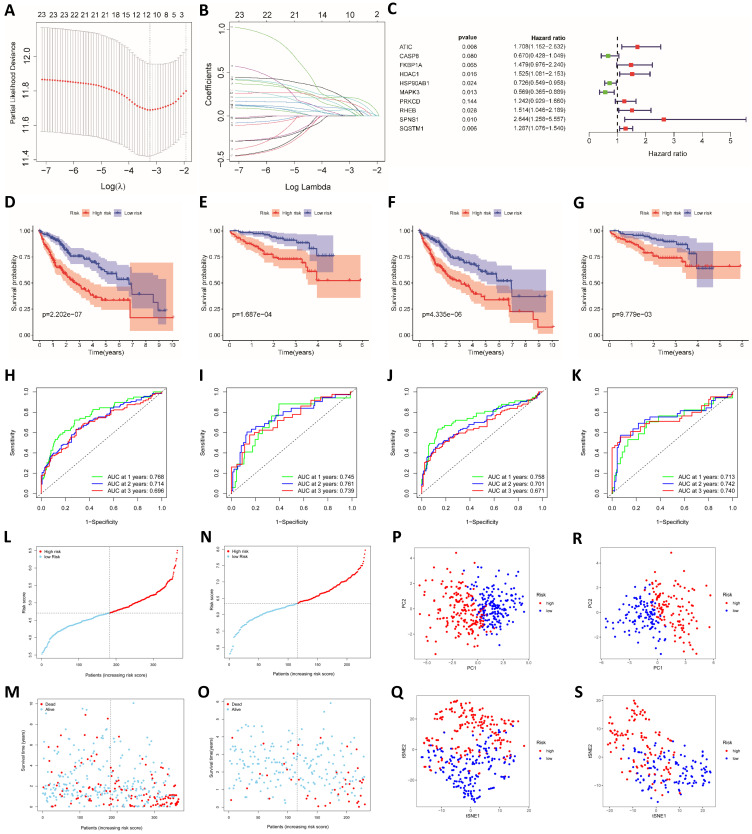
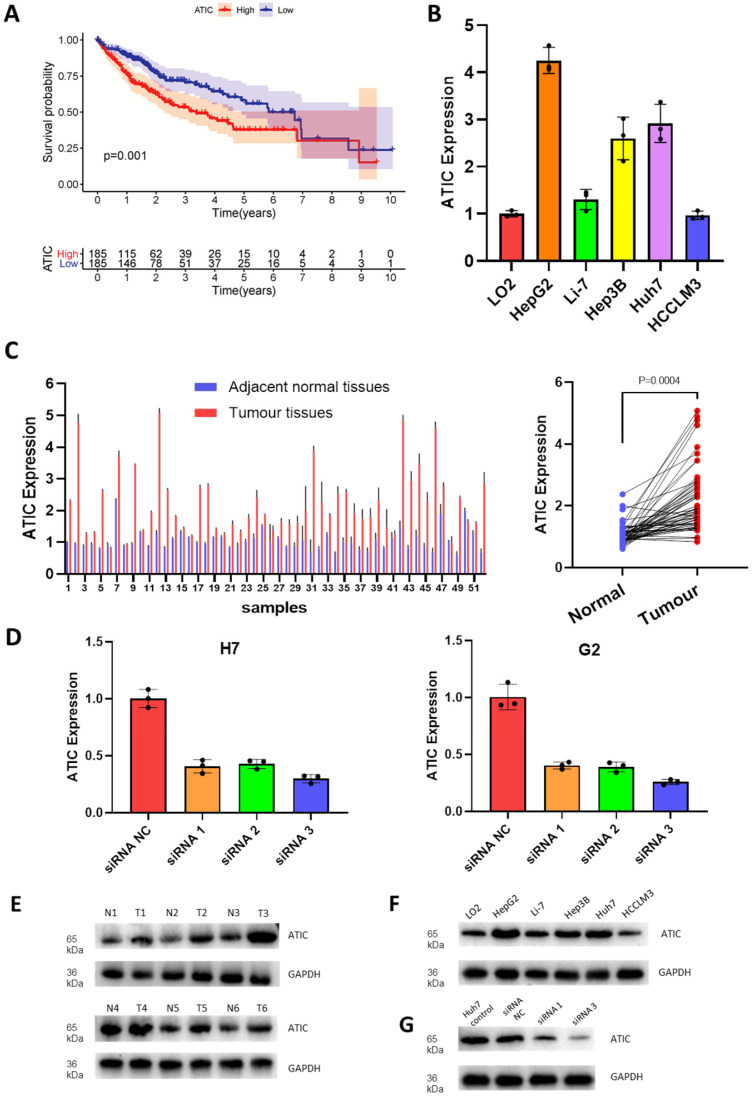
Background: Autophagy regulates many cell functions related to cancer, ranging from cell proliferation and angiogenesis to metabolism. Due to the close relationship between autophagy and tumors, we investigated the predictive value of autophagy-related genes. Methods: Data from patients with hepatocellular carcinoma were obtained from The Cancer Genome Atlas (TCGA) and the International Cancer Genome Consortium (ICGC) databases. A regression analysis of differentially expressed genes was performed. Based on a prognostic model, patients were divided into a high-risk or low-risk group. Kaplan-Meier survival analyses of patients were conducted. The immune landscapes, as determined using single-sample gene set enrichment analysis (ssGSEA), exhibited different patterns in the two groups. The prognostic model was verified using the ICGC database and clinical data from patients collected at Zhongnan Hospital. Based on the results of multivariate Cox regression analysis, 5-aminoimidazole-4-carboxamide ribonucleotide formyltransferase/inosine monophosphate (IMP) cyclohydrolase (ATIC) had the largest hazard ratio, and thus we studied the effect of ATIC on autophagy and tumor progression by performing in vitro and in vivo experiments. Results: Fifty-eight autophagy-related genes were differentially expressed (false discovery rate (FDR)<0.05, log2 fold change (logFC)>1); 23 genes were related to the prognosis of patients. A prognostic model based on 12 genes (ATG10, ATIC, BIRC5, CAPN10, FKBP1A, GAPDH, HDAC1, PRKCD, RHEB, SPNS1, SQSTM1 and TMEM74) was constructed. A significant difference in survival rate was observed between the high-risk group and low-risk group distinguished by the model (P<0.001). The model had good predictive power (area under the curve (AUC)>0.7). Risk-related genes were related to the terms type II IFN response, MHC class I (P<0.001) and HLA (P<0.05). ATIC was confirmed to inhibit autophagy and promote the proliferation, invasion and metastasis of liver cancer cells through the AKT/Forkhead box subgroup O3 (FOXO3) signaling pathway in vitro and in vivo. Conclusions: The prediction model effectively predicts the survival time of patients with liver cancer. The risk score reflects the immune cell features and immune status of patients. ATIC inhibits autophagy and promotes the progression of liver cancer through the AKT/FOXO3 signaling pathway.
Keywords: ATIC; autophagy-related genes; hepatocellular carcinoma; immune cell infiltration; prognosis.
© The author(s).
Conflict of interest statement
Competing Interests: The authors have declared that no competing interest exists.
Figures


Similar articles
-
Bifunctional enzyme ATIC promotes propagation of hepatocellular carcinoma by regulating AMPK-mTOR-S6 K1 signaling.Cell Commun Signal. 2017 Dec 16;15(1):52. doi: 10.1186/s12964-017-0208-8. Cell Commun Signal. 2017. PMID: 29246230 Free PMC article.
-
Identification and Validation of a Prognostic Model Based on Three Autophagy-Related Genes in Hepatocellular Carcinoma.Biomed Res Int. 2021 Mar 12;2021:5564040. doi: 10.1155/2021/5564040. eCollection 2021. Biomed Res Int. 2021. PMID: 33778066 Free PMC article.
-
Upregulation of ATIC in multiple myeloma tissues based on tissue microarray and gene microarrays.Int J Lab Hematol. 2021 Jun;43(3):409-417. doi: 10.1111/ijlh.13397. Epub 2020 Nov 23. Int J Lab Hematol. 2021. PMID: 33226193
-
Association of the ATIC 347 C/G polymorphism with responsiveness to and toxicity of methotrexate in rheumatoid arthritis: a meta-analysis.Rheumatol Int. 2016 Nov;36(11):1591-1599. doi: 10.1007/s00296-016-3523-2. Epub 2016 Jul 5. Rheumatol Int. 2016. PMID: 27379764 Review.
-
The diagnosis and treatment of disorders of nucleic acid/nucleotide metabolism associated with epilepsy.Acta Epileptol. 2025 Apr 1;7(1):23. doi: 10.1186/s42494-025-00201-x. Acta Epileptol. 2025. PMID: 40217360 Free PMC article. Review.
Cited by
-
Identification of DAPK1 as an autophagy-related biomarker for myotonic dystrophy type 1.Front Genet. 2022 Oct 20;13:1022640. doi: 10.3389/fgene.2022.1022640. eCollection 2022. Front Genet. 2022. PMID: 36338967 Free PMC article.
-
LncRNA LBX2-AS1 promotes proliferation and migratory capacity of clear cell renal cell carcinoma through mitophagy.Eur J Med Res. 2024 Feb 7;29(1):103. doi: 10.1186/s40001-024-01690-1. Eur J Med Res. 2024. PMID: 38326905 Free PMC article.
-
PESSA: A web tool for pathway enrichment score-based survival analysis in cancer.PLoS Comput Biol. 2024 May 8;20(5):e1012024. doi: 10.1371/journal.pcbi.1012024. eCollection 2024 May. PLoS Comput Biol. 2024. PMID: 38717988 Free PMC article.
-
Lnc-TPT1-AS1/CBP/ATIC Axis Mediated Purine Metabolism Activation Promotes Breast Cancer Progression.Cancer Sci. 2025 Jun;116(6):1565-1578. doi: 10.1111/cas.70045. Epub 2025 Mar 17. Cancer Sci. 2025. PMID: 40091780 Free PMC article.
-
miR-944 inhibits malignant progression of bladder cancer through ATIC/AKT/FOXO3 A axis mediated by SHMT1.In Vitro Cell Dev Biol Anim. 2025 Jun;61(6):656-668. doi: 10.1007/s11626-025-01050-1. Epub 2025 May 29. In Vitro Cell Dev Biol Anim. 2025. PMID: 40442541 Free PMC article.
References
-
- Villanueva A. Hepatocellular Carcinoma. N Engl J Med. 2019;380:1450–62. - PubMed
Publication types
MeSH terms
Substances
LinkOut - more resources
Full Text Sources
Medical
Research Materials
Miscellaneous
