Clinical Trial
. 2021 Nov 10:2021:3924393.
doi: 10.1155/2021/3924393. eCollection 2021.

Effects of a Cloth Panel Containing a Specific Ore Powder on Patients with Chamaecyparis obtusa (Cypress) Pollen Allergy

Affiliations
Clinical Trial

Effects of a Cloth Panel Containing a Specific Ore Powder on Patients with Chamaecyparis obtusa (Cypress) Pollen Allergy

Suni Lee et al. ScientificWorldJournal. .

Abstract

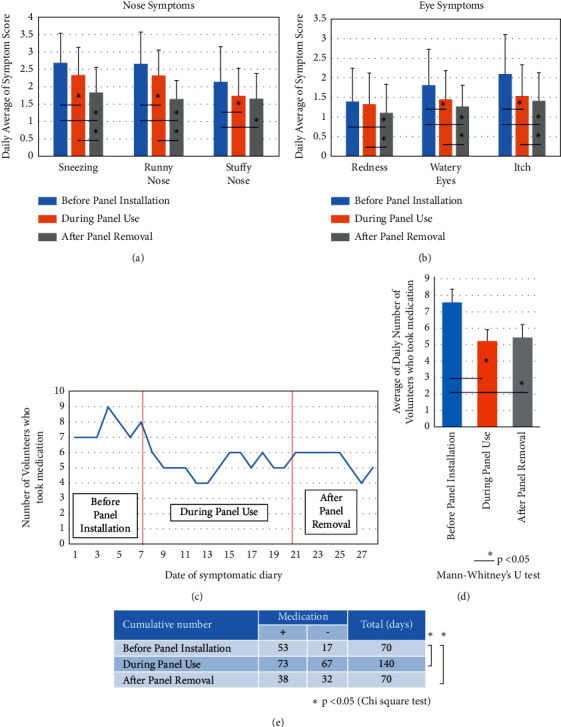
Pollen allergy to Japanese cedar and cypress is a serious illness that impairs daily life and sleep, especially during pollen season. We have reported that placing a cloth panel containing a specific natural ore powder (CCSNOP) in a room may alleviate the symptoms of hay fever and may also benefit the immune system. This ore is from the Aso mountain range, a volcano on Kyushu Island in the southwestern part of Japan. The purpose of this study was to verify the effect of CCSNOP on cypress pollen. Thirty-one double-blind tests, which investigated cedar pollen allergies, were conducted from February to March 2018 and have already been reported. After this, in early April, 10 of these cases were recruited and all had CCSNOP installed in their bedrooms. Before that, various symptoms and changes in medication were recorded in a "Symptom Diary" and included a mood survey by a questionnaire, stress test using saliva amylase, changes in cypress-specific immunoglobulins IgE and IgG4 by blood sampling, and eosinophil changes. In addition, changes in 29 types of cytokines were investigated. Exposure to CCSNOP relieved symptoms and subjects decreased their intake of medication. There was no change in mood or stress, but eosinophil levels tended to decrease. Although there were no statistical changes in cypress-specific IgE or IgG4, an increase in the former and a decrease in the latter were observed in some individuals during the period of pollen dispersal. Furthermore, levels of GM-CSF and IL8 decreased significantly after use of CCSNOP. The CCSNOP was shown to be effective against cypress pollen allergy, and future investigations will be necessary to observe the long-term effects of CCSNOP.


Conflict of interest statement

The authors declare that there are no conflicts of interest regarding the publication.

Figures

Figure 1
Figure 1
Areas where volunteers resided, measuring spots of cypress pollen (according to the literature shown in Figure 2), and experimental schedule. (a) All subjects were residing in the southern part of Okayama Prefecture, Japan. Okayama Prefecture is located in the western part of Japan. A determination of the amount of cypress pollen at the dates when subjects were exposed to CCSNOP was obtained by inspecting the literature referred to in Figure 3. From this literature, A to F spots represent areas where cypress pollen volume was measured. The location (addresses) of the spots is shown. All spots except A overlapped with areas where subjects were residing. (b) The experimental schedule is shown. This study was based on a previous investigation that examined the effects of CCSNOP on 31 patients with Japanese cedar pollen allergies (“Cedar Project”). The results have been previously published. Ten subjects were then selected from the aforementioned 31 patients, all of whom were residing in the southern part of Okayama Prefecture, as shown in panel (a). For the “Cedar Project,” all subjects were exposed to CCSNOP in their bedrooms from February 24 to March 10, 2018. Each subject recorded a “Symptom Diary” from one week before CCSNOP was installed to one week after panel removal. Since the “Cedar Project” was performed as a double-blind study, subjects did not know whether they were exposed to CCSNOP or the control panel. However, in this “Cypress Project,” all subjects were exposed to CCSNOP, since the number of subjects was limited. For the “Cedar Project,” subjects were examined for mood (using POMS2), stress (measured by salivary amylase), blood collections for blood counts, and general screening such as liver and kidney function, lipids, minerals, and immunoglobulins G, A, and M condition on January 13, February 24, March 11, and June 9, 2018. Additionally, 29 specific cytokines were measured using serum derived from the blood collections. For the “Cypress Project,” CCSNOP exposure was from April 1 to 15, 2018. Subjects recorded a “Symptom Diary” for 4 weeks as with the “Cedar Project.” Additionally, the same examinations were performed before and after CCSNOP exposure.
Figure 2
Figure 2
The amount of cypress pollen dispersed from the end of March to the end of April, 2018, in Okayama Prefecture, as obtained from a report by Kimura H (2018). The report is entitled “Cupressaceae (Cryptomeria/Chamaecyparis) pollen dispersal status in Okayama Prefecture.” Ann Rep Chugoku-Shikoku Airborne Pollen Soc. Vol. 29, p2-7, 2018, and is written in Japanese. Panels (a) and (b) show cedar and cypress pollen numbers, respectively, reprinted with permission by the author, Kimura, as well as the Editor-in-Chief, Dr. Fujiki. As shown in panel (a), cedar pollen dispersal ended at the end of March, 2018. On the other hand, as shown in panel (b), cypress pollen dispersal began in the middle of March and continued for more than one month. The lower part of panel (b) shows the periods encompassing CCSNOP panel exposure (2 weeks) and the keeping of a “Symptom Diary” (4 weeks). Although days with lower levels of pollen were observed (due to rain) during the 2-week period of CCSNOP exposure, the approximate average pollen dispersal seemed to be sufficient to evaluate the effects of CCSNOP. One week before panel installation also had sufficient pollen dispersal. However, one week after panel removal, pollen dispersal was relatively low. Only location E showed sufficient pollen dispersal during this period, although the majority of volunteers were not residing close to this location.
Figure 3
Figure 3
Analyses of symptoms from the “Symptom Diary.” (a) Comparison of nose symptoms such as sneezing, runny nose, and stuffy nose for the periods “before panel installation,” “during panel use,” and “after panel removal.” Scores were extracted from each “Symptom Diary” and the daily score average of the 10 subjects was plotted. (b) Comparison of eye symptoms such as redness, watery eyes, and itch during the periods “before panel installation,” “during panel use,” and “after panel removal.” Scores were extracted from each “Symptom Diary” and the daily score average of the 10 subjects was plotted. (c) Data pertaining to the use of medication as recorded in the “Symptom Diary” for each subject were plotted. (d) The average (with SD) daily number of volunteers who took medication in three periods “before panel installation,” “during panel use,” and “after panel removal” were plotted. In panels (a), (b), and (d), differences were initially examined by one-way ANOVA analysis, and then after confirmation of significance, a Mann–Whitney U test was performed to analyze the differences between the two groups. The indicates statistical significance, P < 0.05. (e) During the three periods “before panel installation,” “during panel use,” and “after panel removal,” the number of volunteers who took medication and the number of days were multiplied (medication + row), and the days and number of volunteers who did not take medication were also multiplied (medication–row). Differences between individual periods were then examined by a chi-squared test. The indicates significance, P < 0.05.
Figure 4
Figure 4
Comparison of the average change in the number (% multiplied by total WBC number/μL) (a) or percentage of white blood cells (b) encompassing the period before installation of CCSNOP until removal of the CCSNOP panel for the 10 volunteers. The 5 left-most columns in (a) and 4 left-most columns in (b) increased and the total increase in number or percentage was added and indicated. 5 right-most columns in (a) and 6 right-most columns in (b) decreased. The total absolute number or percentage of increases or decreases is shown.
Figure 5
Figure 5
Changes in immunoglobulins. (a) Actual changes in cypress-specific IgE in 10 volunteers. The X-axis shows the six blood collection times described in Figure 2(b) and the lower right part of this figure. The Y-axis is represented logarithmically. As shown in the lower right part, the yellow box shows the period when the “Symptom Diary” was kept for cypress pollen allergy, while the blue box indicates the 2 weeks of exposure to CCSNOP. (b) The data in panel A are shown as box plots of cypress-specific IgE of 10 volunteers with average ± standard deviations. The Y-axis is shown as Log IgE IUA/ml. There were no significant differences identified among these data by one-way ANOVA analysis. The blue and yellow boxes are the same as in panel (a). Sampling dates # 1 to 6 are the same as in Figure 2(b) and are shown in the lower right part of this figure. (c) Changes in cypress-specific IgG4 (IUA/ML) in individual volunteers, except volunteers # 1, 7, 8, and 10 whose numbers are written in gray. These four volunteers showed less than the measurement lower limit (200 IUA/ml) for all six sampling times. There were no statistical differences between sampling times as determined by one-way ANOVA analysis. The blue and yellow boxes are the same as in panel (a). Sampling dates # 1 to 6 are the same as in Figure 2(b) and are shown in the lower right part of this figure.
Figure 6
Figure 6
Examination of 29 cytokines from blood collections just before CCSNOP exposure and immediately before removal of CCSNOP panel (blood collections # 4 and 5, in Figure 2). GM-CSF (panel (a)) and IL8 (panel (b)) showed significant differences as determined by the Mann–Whitney U test (P < 0.05). Values for both cytokines were higher just before CCSNOP installation compared to those immediately prior to CCSNOP removal.

Similar articles

References

    1. Köberlein J., Kothe A. C., Schaffert C. Determinants of patient compliance in allergic rhinoconjunctivitis. Current Opinion in Allergy and Clinical Immunology . 2011;11(3):192–199. doi: 10.1097/ACI.0b013e3283466fcb. - DOI - PubMed
    1. Rosario N., Bielory L. Epidemiology of allergic conjunctivitis. Current Opinion in Allergy and Clinical Immunology . 2011;11(5):471–476. doi: 10.1097/ACI.0b013e32834a9676. - DOI - PubMed
    1. Jalbert I., Golebiowski B. Environmental aeroallergens and allergic rhino-conjunctivitis. Current Opinion in Allergy and Clinical Immunology . 2015;15(5):476–481. doi: 10.1097/ACI.0000000000000205. - DOI - PubMed
    1. Saito Y. Japanese cedar pollinosis: discovery, nomenclature, and epidemiological trends. Proceedings of the Japan Academy, Series B . 2014;90(6):203–210. doi: 10.2183/pjab.90.203. - DOI - PMC - PubMed
    1. Yamada T., Saito H., Fujieda S. Present state of Japanese cedar pollinosis: the national affliction. The Journal of Allergy and Clinical Immunology . 2014;133(3):632–639. doi: 10.1016/j.jaci.2013.11.002. - DOI - PubMed

Publication types