. 2021 Nov 4:15:643740.
doi: 10.3389/fnins.2021.643740. eCollection 2021.

Early Stopping in Experimentation With Real-Time Functional Magnetic Resonance Imaging Using a Modified Sequential Probability Ratio Test

Affiliations

Early Stopping in Experimentation With Real-Time Functional Magnetic Resonance Imaging Using a Modified Sequential Probability Ratio Test

Sarah J A Carr et al. Front Neurosci. .

Abstract

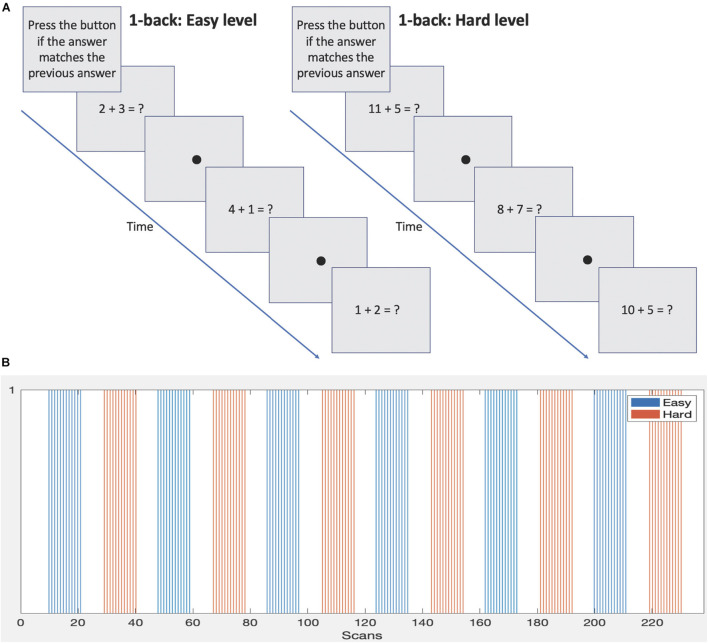
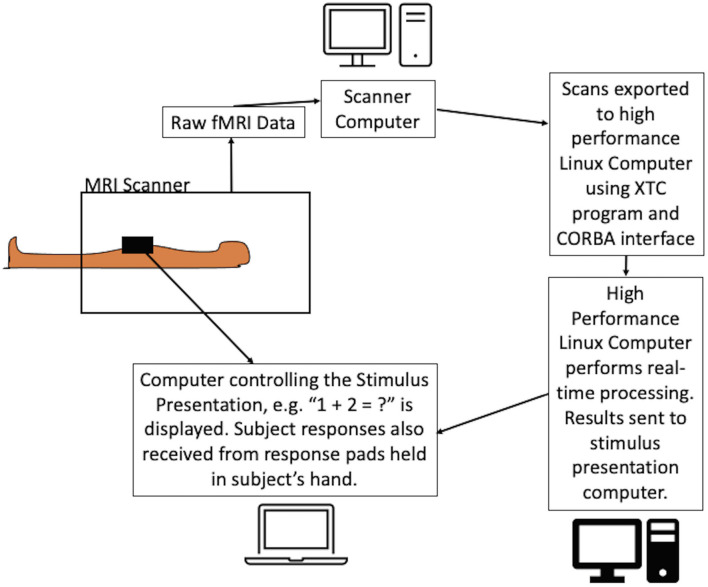
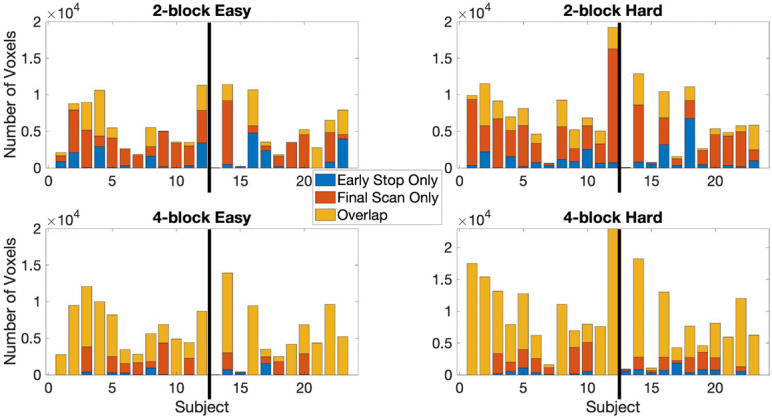
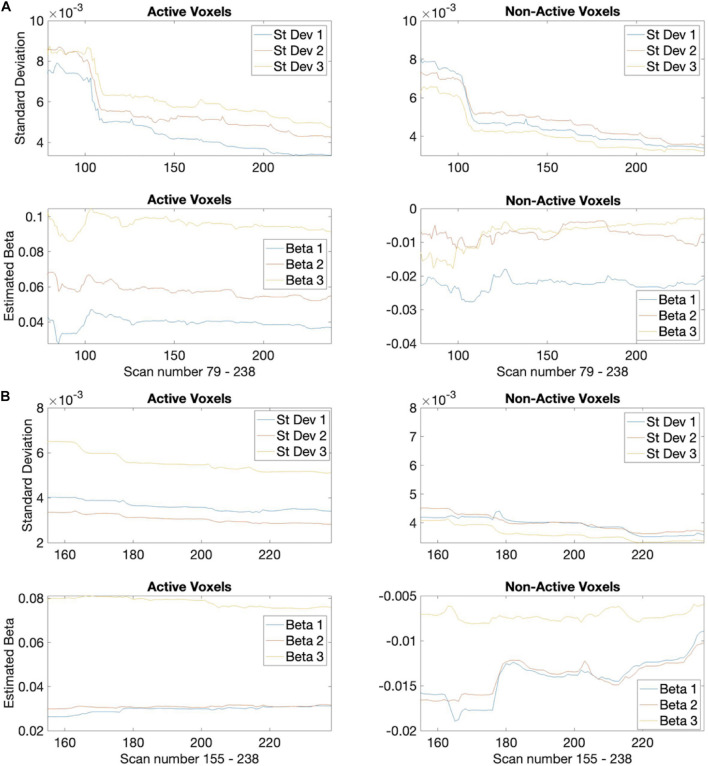
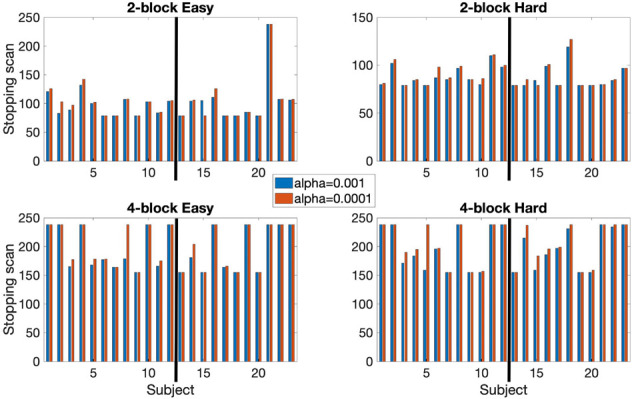
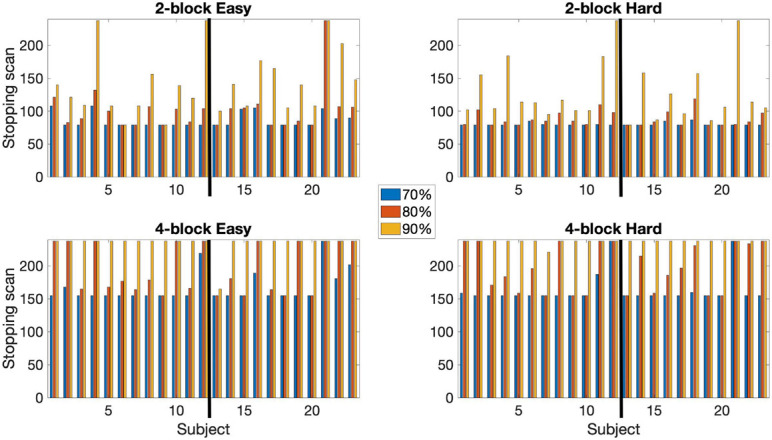
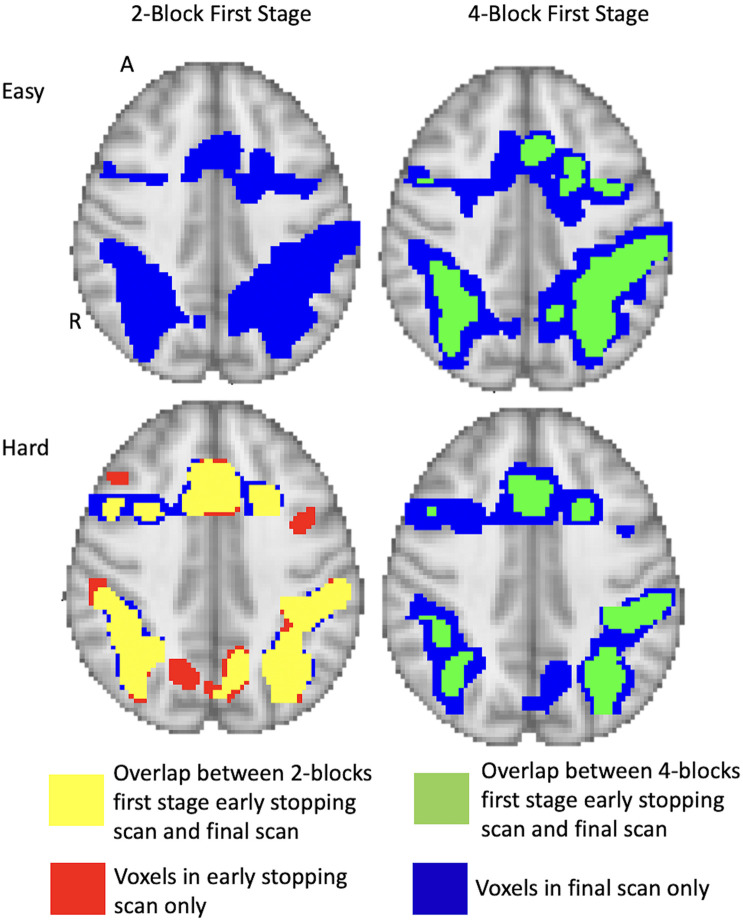
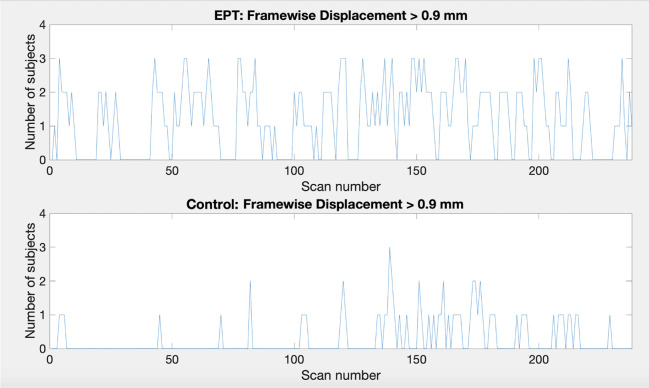
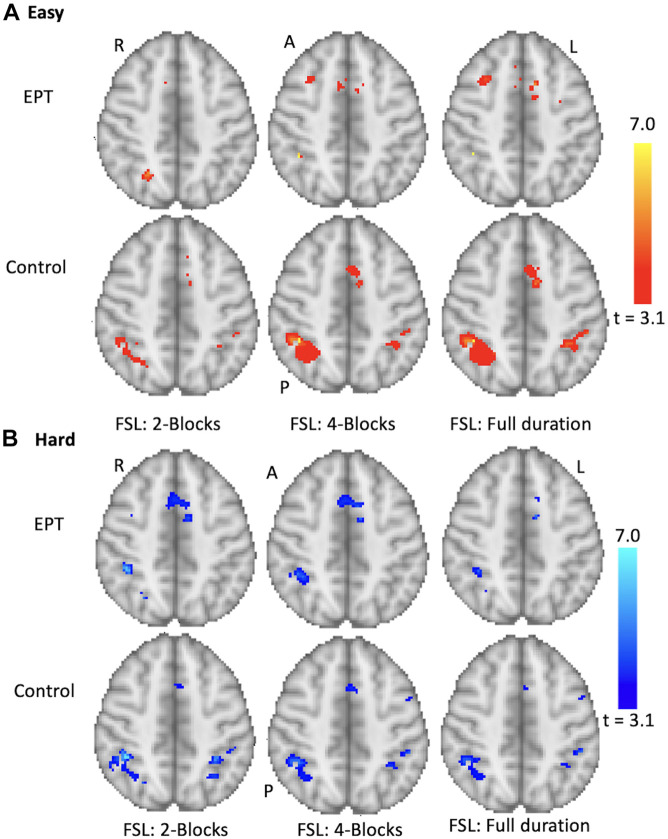
Introduction: Functional magnetic resonance imaging (fMRI) often involves long scanning durations to ensure the associated brain activity can be detected. However, excessive experimentation can lead to many undesirable effects, such as from learning and/or fatigue effects, discomfort for the subject, excessive motion artifacts and loss of sustained attention on task. Overly long experimentation can thus have a detrimental effect on signal quality and accurate voxel activation detection. Here, we propose dynamic experimentation with real-time fMRI using a novel statistically driven approach that invokes early stopping when sufficient statistical evidence for assessing the task-related activation is observed. Methods: Voxel-level sequential probability ratio test (SPRT) statistics based on general linear models (GLMs) were implemented on fMRI scans of a mathematical 1-back task from 12 healthy teenage subjects and 11 teenage subjects born extremely preterm (EPT). This approach is based on likelihood ratios and allows for systematic early stopping based on target statistical error thresholds. We adopt a two-stage estimation approach that allows for accurate estimates of GLM parameters before stopping is considered. Early stopping performance is reported for different first stage lengths, and activation results are compared with full durations. Finally, group comparisons are conducted with both early stopped and full duration scan data. Numerical parallelization was employed to facilitate completion of computations involving a new scan within every repetition time (TR). Results: Use of SPRT demonstrates the feasibility and efficiency gains of automated early stopping, with comparable activation detection as with full protocols. Dynamic stopping of stimulus administration was achieved in around half of subjects, with typical time savings of up to 33% (4 min on a 12 min scan). A group analysis produced similar patterns of activity for control subjects between early stopping and full duration scans. The EPT group, individually, demonstrated more variability in location and extent of the activations compared to the normal term control group. This was apparent in the EPT group results, reflected by fewer and smaller clusters. Conclusion: A systematic statistical approach for early stopping with real-time fMRI experimentation has been implemented. This dynamic approach has promise for reducing subject burden and fatigue effects.

Keywords: SPRT (sequential probability ratio test); adaptive fMRI; dynamic experimentation; early stopping fMRI; real-time fMRI.


Conflict of interest statement

HF was employed by the company Philips Healthcare, USA. JS-G was employed by the company Philips Healthcare, Spain. The remaining authors declare that the research was conducted in the absence of any commercial or financial relationships that could be construed as a potential conflict of interest. The authors declare that this study received funding from Philips Healthcare. The funder had the following involvement in the study: technical support and software development for the real-time output of fMRI files and revision of the manuscript.

Figures

FIGURE 1
FIGURE 1
(A) Sample 1-back protocols demonstrating the two difficulty levels. (B) Block design and timings of each difficulty level.
FIGURE 2
FIGURE 2
Schematic of the experimental setup of the dynamic real-time fMRI process. The equations were presented to the subject while the scans were acquired using a dedicated computer. FMRI scans were exported in real-time from the scanner computer to the Linux workstation using the Philips XTC program and CORBA interface. Scans were preprocessed on the Linux workstation and SPRT statistics were calculated. The results were relayed back to the stimulus presentation program with an instruction to either continue or terminate the stimulus. The program allowed the flexibility to automatically terminate the presentation of the difficulty level or it could be overridden by the experimenter to continue presenting the stimulus. Note: where hospital firewalls are not an issue, the setup can be simplified.
FIGURE 3
FIGURE 3
The active voxel counts shown are for the voxels-in-common between the full duration scan and early stop scan and counts are for active voxels unique to either the final scan or early stop scan. Top row: 2-block easy and hard levels, bottom row: 4-block easy and hard levels. Maximum number of possible scans is 238, minimum is 78 scans for 2 blocks first stage of easy and hard stimulus administration or 154 scans for 4 blocks first stage of easy and hard. Information given for the point where 80% of voxels have been classified as either active or non-active. Results reported uses αE = 0.001, βE = 0.1, and z = 3.10 (p < 0.001) at first scan after the first stage. The thick black line in each chart indicates the subject groups. Left of the black line (1–12) = control subjects, right of the black line (13–23) = EPT subjects.
FIGURE 4
FIGURE 4
Estimated standard deviations for the easy task parameter. Plots for 3 example active (left) and non-active (right) voxels from a control subject (subject 3) showing how the estimates decrease over time (scan number). (A) Based on 2-block first stage estimation, (B) 4-block first stage estimation.
FIGURE 5
FIGURE 5
Comparison of early stopping times using αE = 0.001 and αE = 0.0001. Based on 80% of voxels being classified. Both 2-block (top row) and 4-block (bottom row) first stage conditions are presented. βE = 0.1 throughout. The thick black line in each chart indicates the subject groups. Left of the black line (1–12) = control subjects, right of the black line (13–23) = EPT subjects.
FIGURE 6
FIGURE 6
A comparison of the early stopping scans at 70, 80, and 90% of voxels classified as either active or non-active. Conducted using αE = 0.001, βE = 0.1. Both 2-block (top row) and 4-block (bottom row) first stage conditions are presented. The thick black line in each chart indicates the subject groups. Left of the black line (1–12) = control subjects, right of the black line (13–23) = EPT subjects.
FIGURE 7
FIGURE 7
Full brain activation maps showing the overlapping voxels between the different stopping points (using 2-blocks first stage, 4-blocks first stage and final scan). Top row shows the easy level and bottom row shows the hard level for 1 subject (number 9). The voxels that are active only at full duration are shown in blue. Those only active after 2-blocks or 4-blocks of stimulus administration are in red. Yellow shows the overlap between full duration and 2-block first stage early stopping scans. Green shows the overlap between full duration and 4-block first stage stopping scans. Thresholded at z = 3.10 at first scan after the first stage. Results overlaid on MNI template, slice z = 56 shown. R = right, A = anterior.
FIGURE 8
FIGURE 8
Plots showing the number of subjects that pass the framewise displacement threshold of 0.9 mm for each scan. Top: EPT subjects, bottom: control subjects.
FIGURE 9
FIGURE 9
Group results for the 1-back task. Analysis performed for control and EPT subjects using FSL. Early stopping with 2- and 4-blocks being initially administered is compared to full duration. Activations are overlaid on the MNI template brain. Red (A) = easy level results, Blue (B) hard level results. Group results thresholded at z = 3.10 (p < 0.001). Slice z = 59 is shown. R = right, L = left, A = anterior, P = posterior.

Similar articles

References

    1. Alegria A. A., Wulff M., Brinson H., Barker G. J., Norman L. J., Brandeis D., et al. (2017). Real-time fMRI neurofeedback in adolescents with attention deficit hyperactivity disorder. Hum. Brain Mapp. 38 3190–3209. 10.1002/hbm.23584 - DOI - PMC - PubMed
    1. Banerjee A., Chitnis U. B., Jadhav S. L., Bhawalkar J. S., Chaudhury S. (2009). Hypothesis testing, type I and type II errors. Indust. Psychiatry J. 18 127–131. - PMC - PubMed
    1. Berl M. M., Vaidya C. J., Gaillard W. D. (2006). Functional imaging of developmental and adaptive changes in neurocognition. Neuroimage 30 679–691. 10.1016/j.neuroimage.2005.10.007 - DOI - PubMed
    1. Carroll R. J., Wang S., Simpson D. G., Stromberg A. J., Ruppert D. (1998). The Sandwich (Robust Covariance Matrix) Estimator. Texas: Texas A&M University.
    1. Cavanna A. E., Trimble M. R. (2006). The precuneus: a review of its functional anatomy and behavioural correlates. Brain 129 564–583. 10.1093/brain/awl004 - DOI - PubMed

LinkOut - more resources