

Transcriptome of the Krushinsky-Molodkina Audiogenic Rat Strain and Identification of Possible Audiogenic Epilepsy-Associated Genes
- PMID: 34803604
- PMCID: PMC8600260
- DOI: 10.3389/fnmol.2021.738930
Transcriptome of the Krushinsky-Molodkina Audiogenic Rat Strain and Identification of Possible Audiogenic Epilepsy-Associated Genes
Abstract
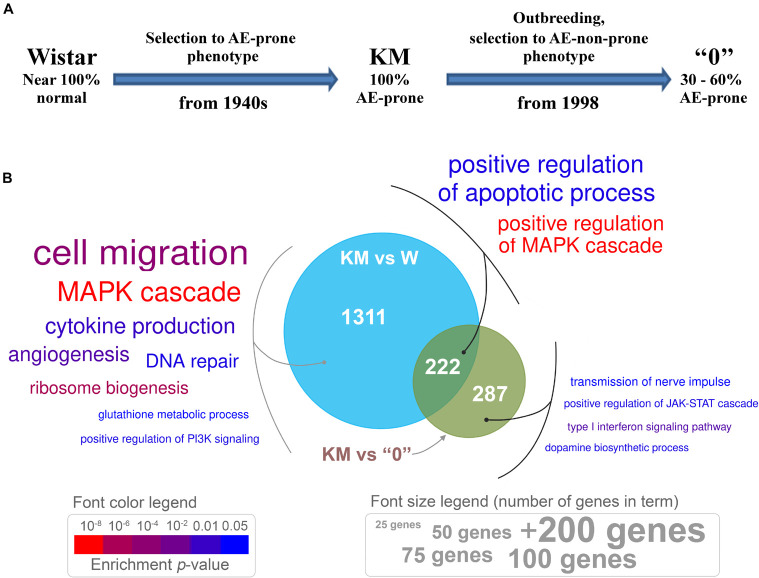
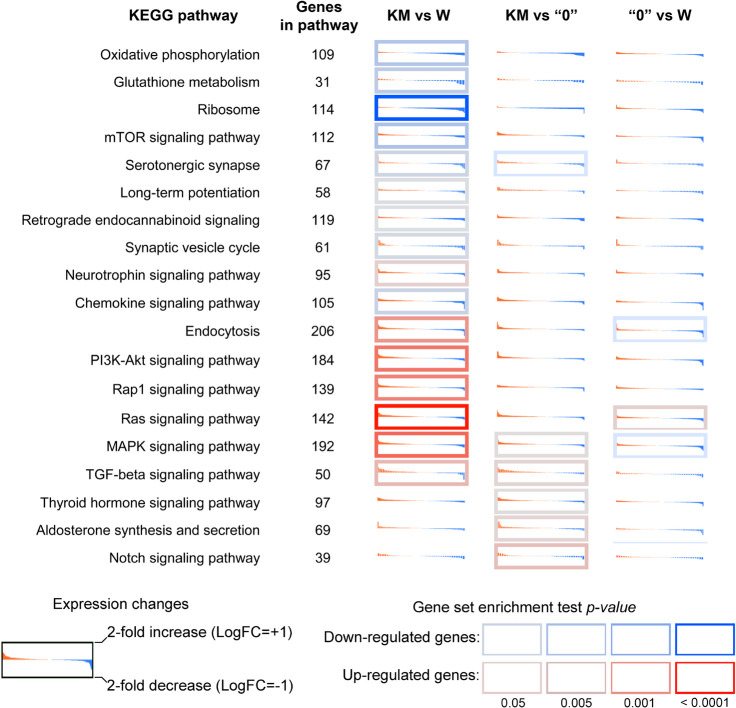
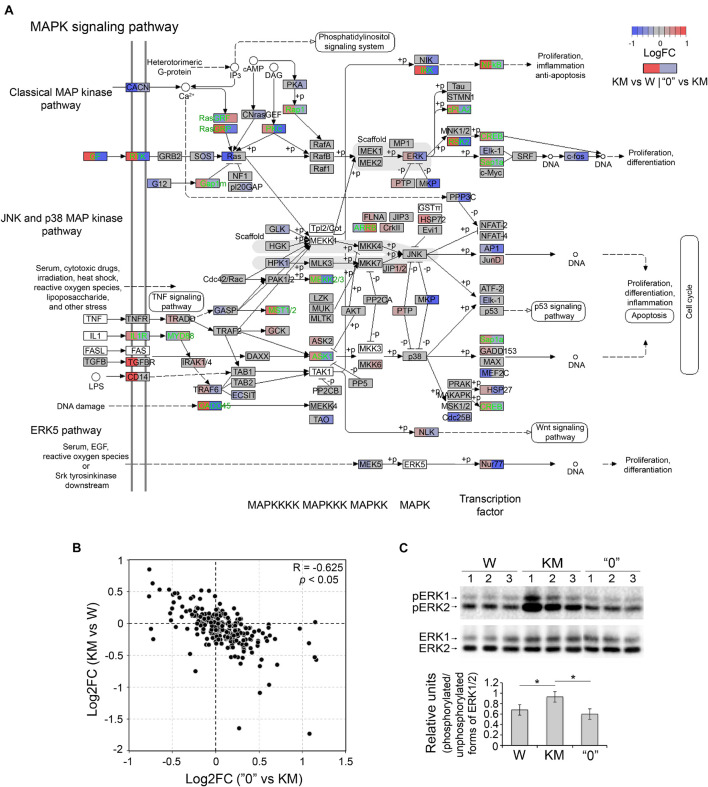
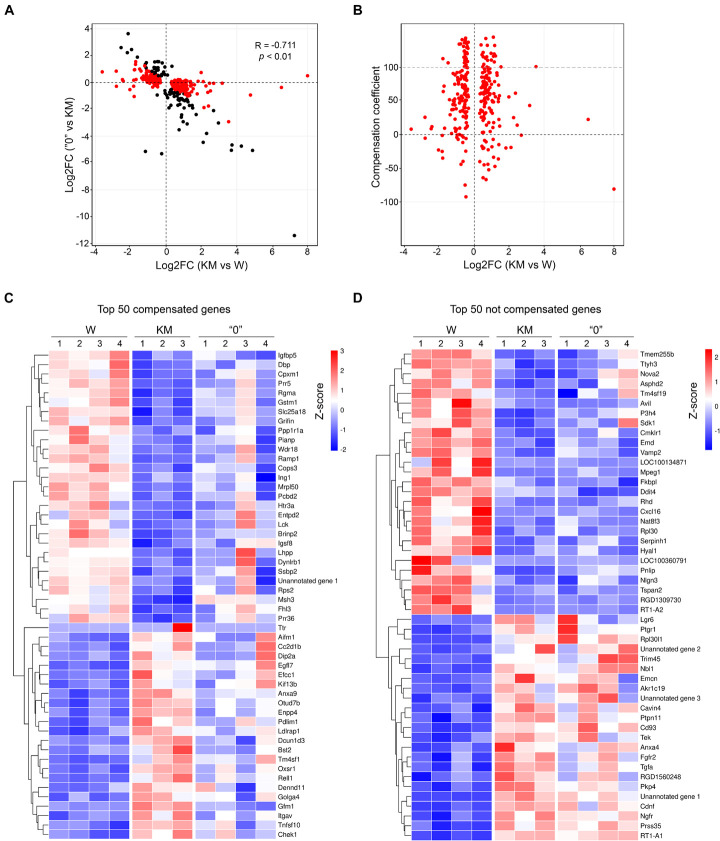
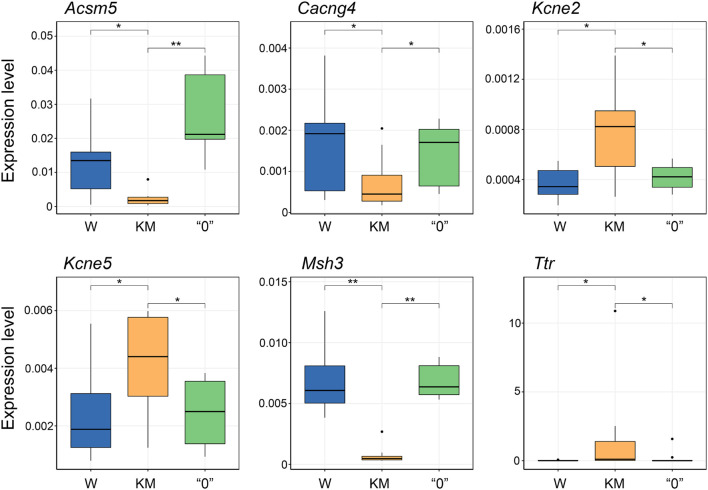
Audiogenic epilepsy (AE), inherent to several rodent strains is widely studied as a model of generalized convulsive epilepsy. The molecular mechanisms that determine the manifestation of AE are not well understood. In the present work, we compared transcriptomes from the corpora quadrigemina in the midbrain zone, which are crucial for AE development, to identify genes associated with the AE phenotype. Three rat strains without sound exposure were compared: Krushinsky-Molodkina (KM) strain (100% AE-prone); Wistar outbred rat strain (non-AE prone) and "0" strain (partially AE-prone), selected from F2 KM × Wistar hybrids for their lack of AE. The findings showed that the KM strain gene expression profile exhibited a number of characteristics that differed from those of the Wistar and "0" strain profiles. In particular, the KM rats showed increased expression of a number of genes involved in the positive regulation of the MAPK signaling cascade and genes involved in the positive regulation of apoptotic processes. Another characteristic of the KM strain which differed from that of the Wistar and "0" rats was a multi-fold increase in the expression level of the Ttr gene and a significant decrease in the expression of the Msh3 gene. Decreased expression of a number of oxidative phosphorylation-related genes and a few other genes was also identified in the KM strain. Our data confirm the complex multigenic nature of AE inheritance in rodents. A comparison with data obtained from other independently selected AE-prone rodent strains suggests some common causes for the formation of the audiogenic phenotype.
Keywords: KM rat strain; MAPK signaling cascade; Msh3; Ttr; Wistar rats; audiogenic epilepsy; transcriptomic analysis (RNA-seq).
Copyright © 2021 Chuvakova, Funikov, Rezvykh, Davletshin, Evgen’ev, Litvinova, Fedotova, Poletaeva and Garbuz.
Conflict of interest statement
The authors declare that the research was conducted in the absence of any commercial or financial relationships that could be construed as a potential conflict of interest.
Figures
Similar articles
-
Neuroinflammation in Pathogenesis of Audiogenic Epilepsy: Altered Proinflammatory Cytokine Levels in the Rats of Krushinsky-Molodkina Seizure-Prone Strain.Biochemistry (Mosc). 2023 Apr;88(4):481-490. doi: 10.1134/S0006297923040041. Biochemistry (Mosc). 2023. PMID: 37080934
-
The Krushinsky-Molodkina rat strain: The study of audiogenic epilepsy for 65years.Epilepsy Behav. 2017 Jun;71(Pt B):130-141. doi: 10.1016/j.yebeh.2015.04.072. Epub 2015 Jul 28. Epilepsy Behav. 2017. PMID: 26228091 Review.
-
[Laboratory rat selection for the trait "the absence of audiogenic seizure proneness"].Genetika. 2012 Jun;48(6):685-91. Genetika. 2012. PMID: 22946325 Russian.
-
Ontogeny of the Epileptic System in the Krushinsky-Molodkina Rat Strain with Genetically Determined Audiogenic Epilepsy.Dokl Biol Sci. 2025 Apr;521(1):95-101. doi: 10.1134/S0012496624600489. Epub 2025 Apr 11. Dokl Biol Sci. 2025. PMID: 40216676
-
[Rats of Krushinsky-Molodkina strain: studies of audiogenic epilepsy, vascular pathology, and behavior].Zh Vyssh Nerv Deiat Im I P Pavlova. 2006 May-Jun;56(3):298-316. Zh Vyssh Nerv Deiat Im I P Pavlova. 2006. PMID: 16869263 Review. Russian.
Cited by
-
Transcriptomic analyses of human brains with Alzheimer's disease identified dysregulated epilepsy-causing genes.Epilepsy Behav. 2025 Jul;168:110421. doi: 10.1016/j.yebeh.2025.110421. Epub 2025 Apr 17. Epilepsy Behav. 2025. PMID: 40250147
-
Insulin signaling disruption exacerbates memory impairment and seizure susceptibility in an epilepsy model with Alzheimer's disease-like pathology.J Neural Transm (Vienna). 2025 Feb 22. doi: 10.1007/s00702-025-02896-1. Online ahead of print. J Neural Transm (Vienna). 2025. PMID: 39987343
-
Wireless EEG Recording of Audiogenic Seizure Activity in Freely Moving Krushinsky-Molodkina Rats.Biomedicines. 2024 Apr 24;12(5):946. doi: 10.3390/biomedicines12050946. Biomedicines. 2024. PMID: 38790907 Free PMC article.
-
Novel automated method to assess group dynamics reveals deficits in behavioral contagion in rats with social deficits.Front Behav Neurosci. 2024 Dec 18;18:1519486. doi: 10.3389/fnbeh.2024.1519486. eCollection 2024. Front Behav Neurosci. 2024. PMID: 39744143 Free PMC article.
-
Arc protein, a remnant of ancient retrovirus, forms virus-like particles, which are abundantly generated by neurons during epileptic seizures, and affects epileptic susceptibility in rodent models.Front Neurol. 2023 Jul 7;14:1201104. doi: 10.3389/fneur.2023.1201104. eCollection 2023. Front Neurol. 2023. PMID: 37483450 Free PMC article. Review.
References
LinkOut - more resources
Full Text Sources
Molecular Biology Databases
Research Materials
Miscellaneous