Review
. 2021 Nov 2:12:670335.
doi: 10.3389/fphar.2021.670335. eCollection 2021.

Systematic Survey of the Alteration of the Faecal Microbiota in Rats With Gastrointestinal Disorder and Modulation by Multicomponent Drugs

Affiliations
Review

Systematic Survey of the Alteration of the Faecal Microbiota in Rats With Gastrointestinal Disorder and Modulation by Multicomponent Drugs

Yue Wu et al. Front Pharmacol. .

Abstract

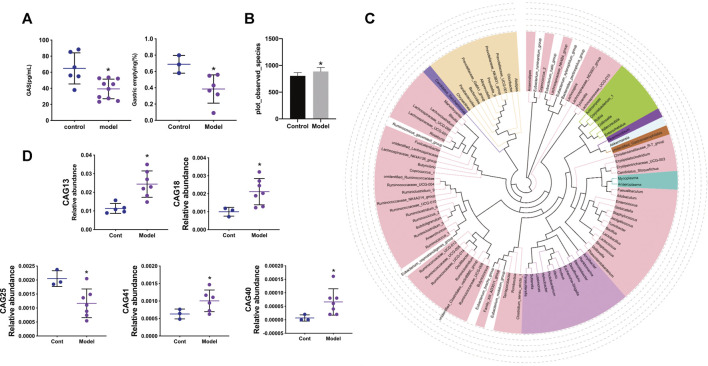
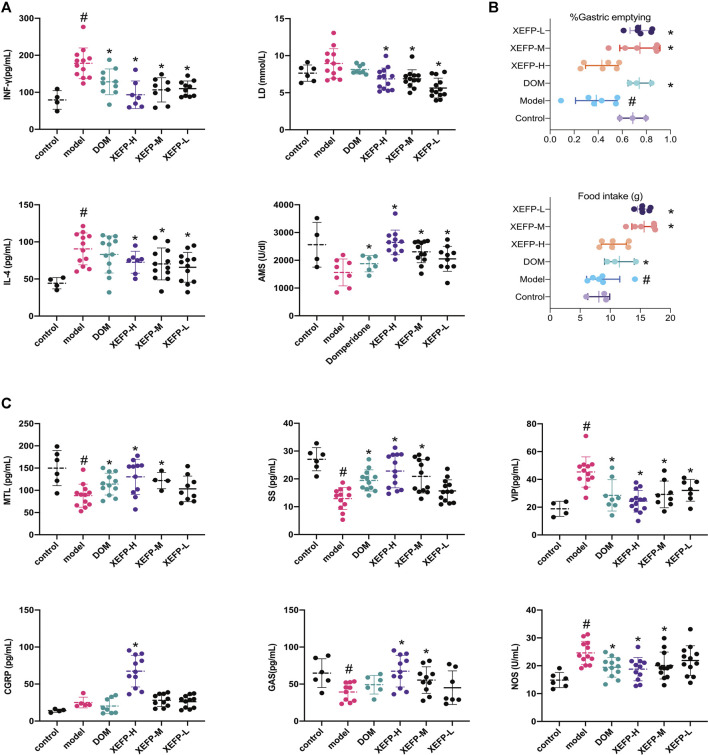
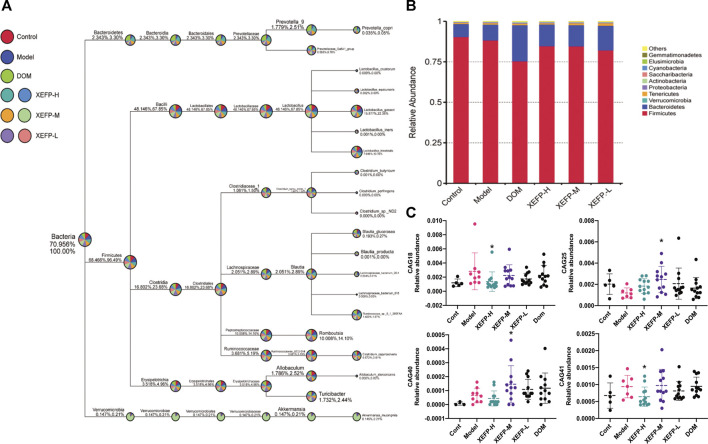
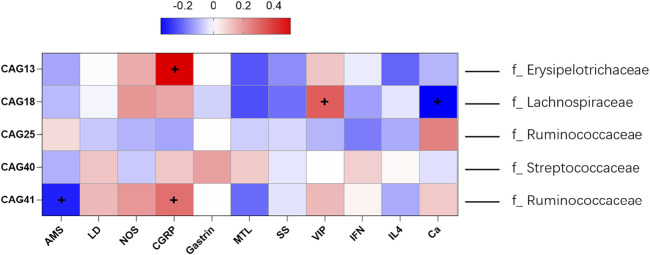
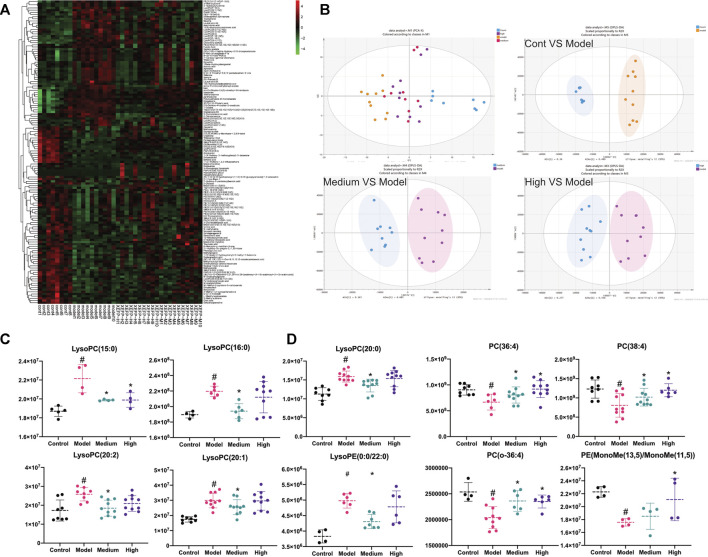
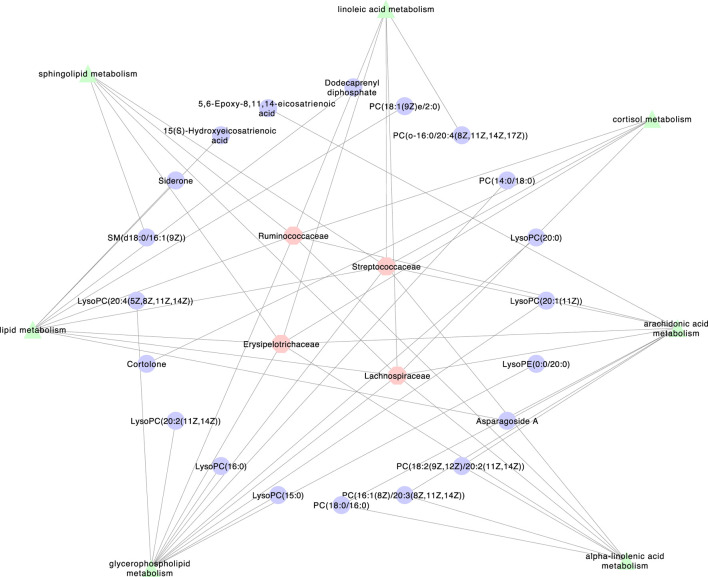
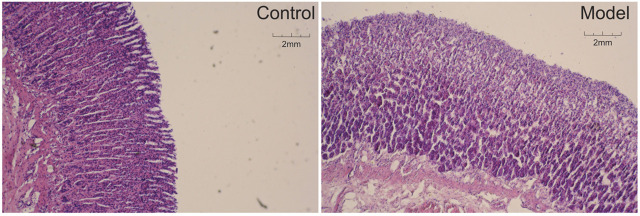
Gastrointestinal disorder (GID) is a global health disease which leads to heavy public medical burden. Disorders in the intestinal flora have been found in gastrointestinal disorder patients. However, the interaction between GID and the intestinal flora in faecal has not been studied comprehensively. In addition, multicomponent drugs represented by traditional Chinese medicine (TCM) are widely used for treating GID, but their modulation of the intestinal flora has not been investigated. Therefore, in this study, a high-throughput sequencing strategy was used to investigate alterations in the intestinal flora in a rat GID model, followed by an investigation of the modulation by a representative TCM, Xiaoerfupi (XEFP) granule. The results showed that in rats with GID, the relative abundances of Erysipelotrichaceae, Lachnospiraceae, Streptococcaceae increased and that of Ruminococcaceae decreased. At the macro level, the levels of LysoPC(16:0), LysoPC(20:2), LysoPC(15:0), LysoPC(20:2 (11Z, 14Z)), LysoPC(20:1), LysoPC(15:0), LysoPC(20:0) and LysoPE (0:0/20:0) in serum increased and levels of PC(36:4), PC(38:4), PC(o-36;4), PE (MonoMe(13,5)/MonoMe(11,5)) decreased. The imbalance of metabolites was restored by XEFP through ether lipid metabolism pathway. Increase in the phyla Firmicutes/Bacteroidetes (F/B) ratio of the GID rats was restored by XEFP as well. Moreover, XEFP can relief the symptoms of GID rats by increasing bacteria Ruminococcaceae and decreasing Streptococcaceae, Erysipelotrichaceae and Lachnospiraceae in faecal microbiota level. This study represents a comprehensive survey of the interaction between GID and the intestinal flora and a systematic evaluation of modulation by a multicomponent drug.

Keywords: XEFP; functional dyspepsia; intestinal flora; metabonomics; network pharmacology.


Conflict of interest statement

The authors declare that the research was conducted in the absence of any commercial or financial relationships that could be construed as a potential conflict of interest.

Figures

FIGURE 1
FIGURE 1
(A) The gastric emptying rate between control and model groups and the levels of gastrin in serum between control and model groups (B) Species accumulation boxplot and observed species diversity index in control and model groups (C)The Phylogenetic tree of the top 100 genus through sequence alignment, different color represents different Phylum (D) The relative abundance of CAG13, CAG18, CAG25, CAG40, CAG41 between control and model group. Data are mean ± SD, *p < 0.05 VS the model group.
FIGURE 2
FIGURE 2
(A) XEFP attenuates inflammatory responses of GID rats. The levels of IL-4; The levels of IFN-γ in serum; The levels of AMS in serum; The levels of LD in serum (B) XEFP improves the gastric emptying; and the basic data on the food intake of each group (C) XEFP modulates the secretion of BGPs of GID rats. The levels of GAS, The levels of MTL, The levels of SS, The levels of CGRP, The levels of NOS, and VIP in serum. The data are presented as the means ± SD. One-way ANOVA followed by LSD post hoc test for multiple comparisons of IL-4, LD and AMS. #p < 0.05 VS the control group, *p < 0.05 VS the model group.
FIGURE 3
FIGURE 3
XEFP modulates intestinal flora of GID rats (A) The taxonomic tree of all groups (B) The bar plot of relative abundance on a phylum level. The size of the sector represents the proportion of the relative abundance of each group; the first number beside the circle represents the percentage of all species and the second represents the percentage of selected species (C) The relative abundance of CAG18, CAG25, CAG40, CAG41. The data are presented as the means ± SD. One-way ANOVA followed by LSD post hoc test for multiple comparisons. *p < 0.05 versus the model group.
FIGURE 4
FIGURE 4
Spearman correlations of five differential CAG and the microbes of highest relative abundance in each CAG with BGPs, inflammatory factors and others. The ‘+’ represent the correlation was statistically significant. The information provided right side represent the dominant family (family with the highest relative abundance).
FIGURE 5
FIGURE 5
(A) Cluster heatmap of all microbiota detected in positive ion mode; (B) The PCA-X analysis of control, model, high and medium groups in positive ion mode; OPLS-DA analysis of control VS model in positive ion mode; OPLS-DA analysis of medium VS model in positive ion mode; OPLS-DA analysis of high VS model in positive ion mode. The high group represents XEFP-H group while the medium group means XEFP-M group (C) Serum level of LysoPC(15:0), LysoPC(16:0), LysoPC(20:0) LysoPC(20:2 (11Z, 14Z)), LysoPC(20:1 (11Z)), LysoPE (0:0/20:0) changed in model and treated group. Medium group means XEFP-M while High means XEFP-H (D) Serum level of PC(16:1 (9Z)/20:3 (8Z,11Z, 14Z), PC(18:2 (9Z, 12Z)/20:2 (11Z, 14Z)), PC(o-16:0/20:4 (8Z,11Z,14Z, 17Z)), PE (MonoMe(13,5)/MonoMe(11,5)) changed in model and treated group. Medium group means XEFP-M while High means XEFP-H. The data are presented as the means ± SD. One-way ANOVA followed by LSD post hoc test for multiple comparisons. *p < 0.05 versus the model group. #p < 0.05 versus the control group.
FIGURE 6
FIGURE 6
The network among Intestinal flora, pathways and metabolite.
FIGURE A1
FIGURE A1
Hematoxylin and eosin (HE) staining for gastric morphology (photomicrography, × 4).

Similar articles

Cited by

References

    1. Abdulamir A. S., Hafidh R. R., Abu Bakar F. (2011). The Association of Streptococcus Bovis/gallolyticus with Colorectal Tumors: the Nature and the Underlying Mechanisms of its Etiological Role. J. Exp. Clin. Cancer Res. 30, 11. 10.1186/1756-9966-30-11 - DOI - PMC - PubMed
    1. Böhn L., Störsrud S., Törnblom H., Bengtsson U., Simrén M. (2013). Self-reported Food-Related Gastrointestinal Symptoms in IBS Are Common and Associated with More Severe Symptoms and Reduced Quality of Life. Am. J. Gastroenterol. 108, 634–641. 10.1038/ajg.2013.105 - DOI - PubMed
    1. Caenepeel C., Sadat Seyed Tabib N., Vieira-Silva S., Vermeire S. (2020). Review Article: How the Intestinal Microbiota May Reflect Disease Activity and Influence Therapeutic Outcome in Inflammatory Bowel Disease. Aliment. Pharmacol. Ther. 52, 1453–1468. 10.1111/apt.16096 - DOI - PubMed
    1. Chen G., Feng P., Wang S., Ding X., Xiong J., Wu J., et al. (2020). An Herbal Formulation of Jiawei Xiaoyao for the Treatment of Functional Dyspepsia: A Multicenter, Randomized, Placebo-Controlled, Clinical Trial. Clin. Transl. Gastroenterol. 11, e00241. 10.14309/ctg.0000000000000241 - DOI - PMC - PubMed
    1. De Vadder F., Kovatcheva-Datchary P., Goncalves D., Vinera J., Zitoun C., Duchampt A., et al. (2014). Microbiota-generated Metabolites Promote Metabolic Benefits via Gut-Brain Neural Circuits. Cell 156, 84–96. 10.1016/j.cell.2013.12.016 - DOI - PubMed

LinkOut - more resources