

Identification of Hypoxia Induced Metabolism Associated Genes in Pulmonary Hypertension
- PMID: 34803695
- PMCID: PMC8602807
- DOI: 10.3389/fphar.2021.753727
Identification of Hypoxia Induced Metabolism Associated Genes in Pulmonary Hypertension
Erratum in
-
Corrigendum: Identification of Hypoxia Induced Metabolism Associated Genes in Pulmonary Hypertension.Front Pharmacol. 2021 Dec 15;12:810178. doi: 10.3389/fphar.2021.810178. eCollection 2021. Front Pharmacol. 2021. PMID: 34975506 Free PMC article.
Abstract
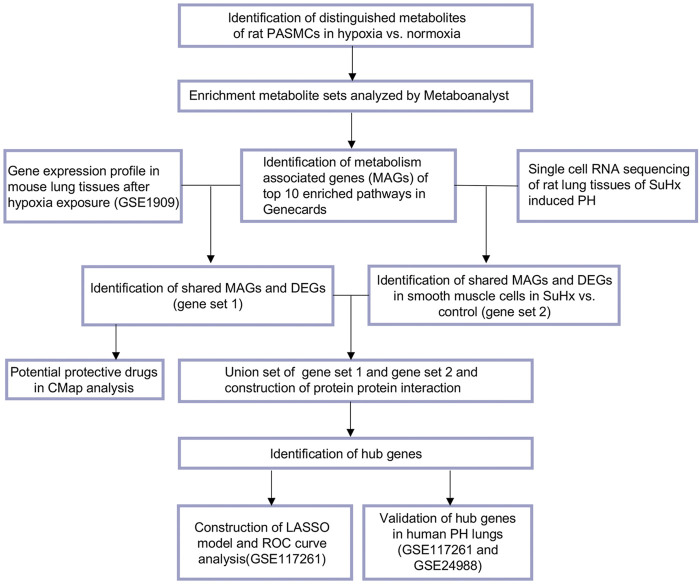
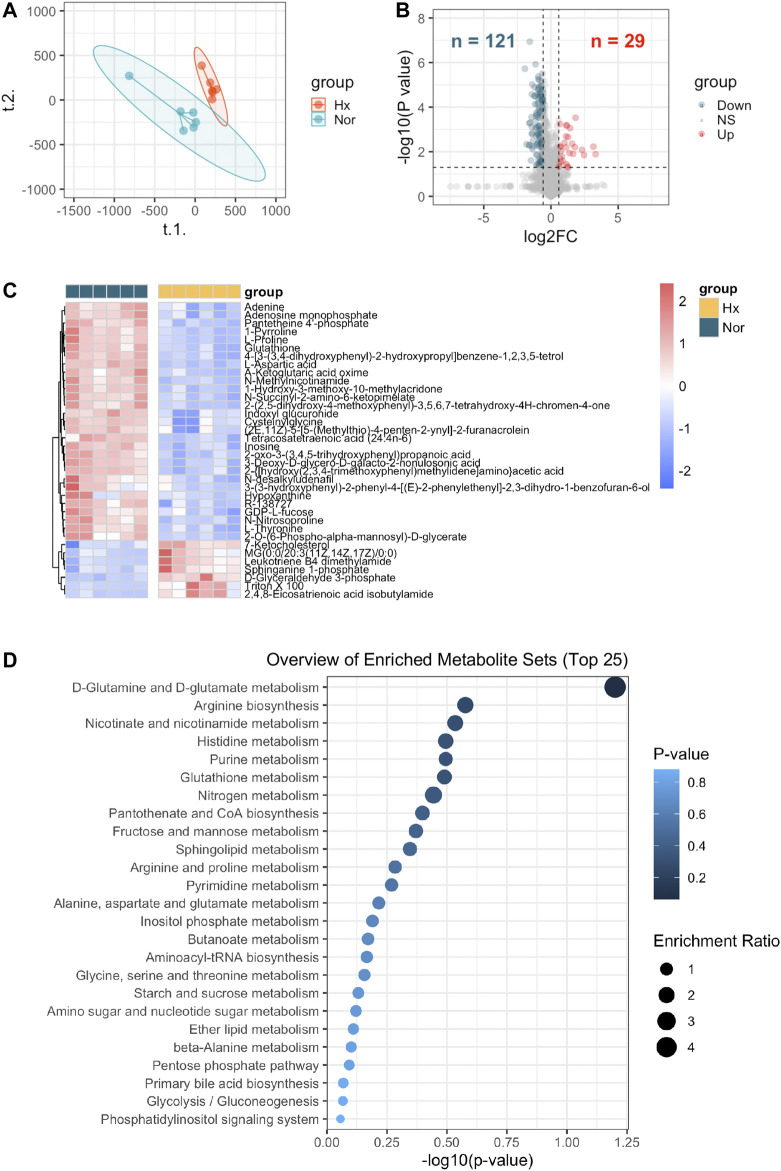
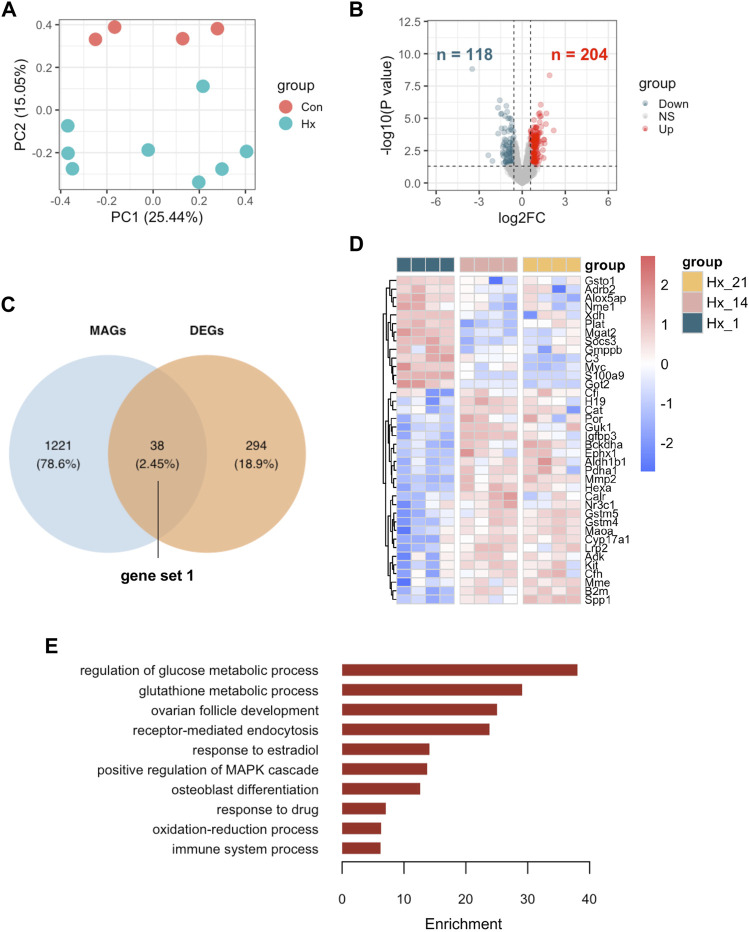
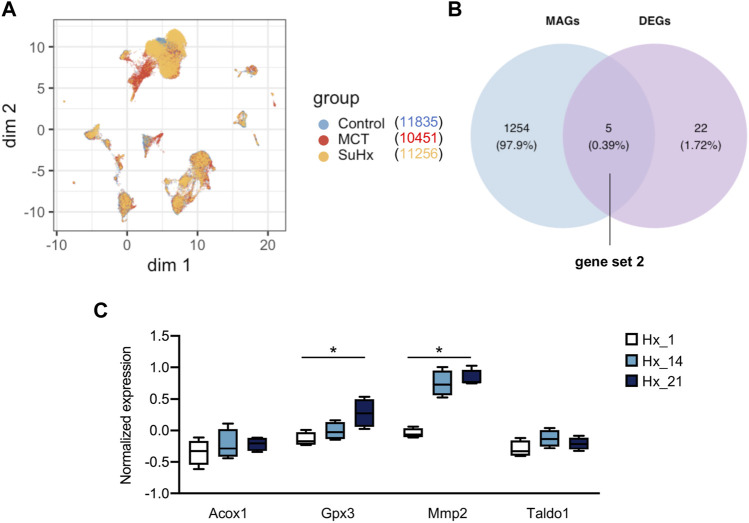
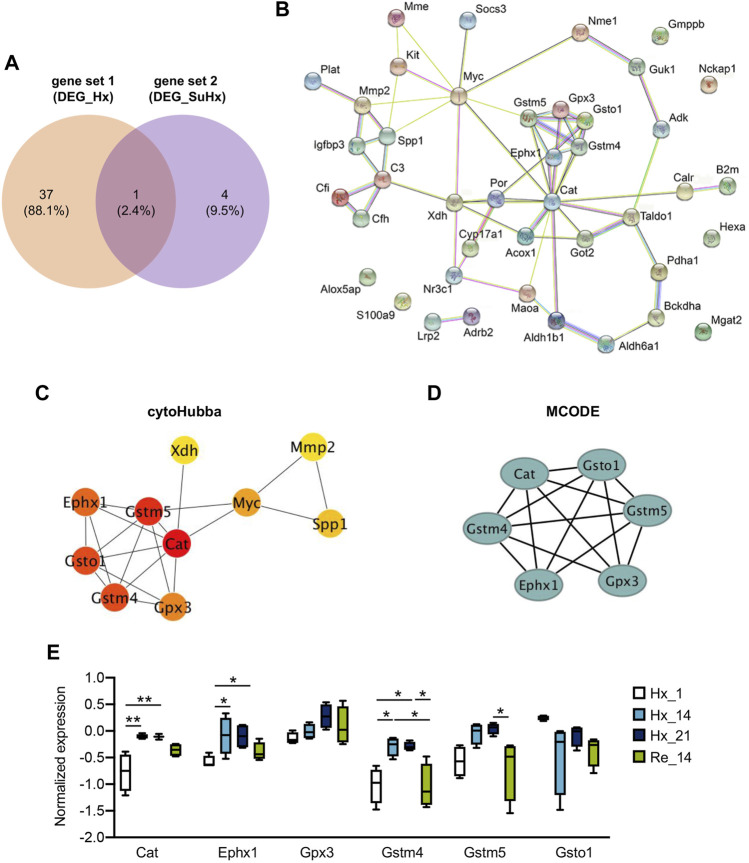
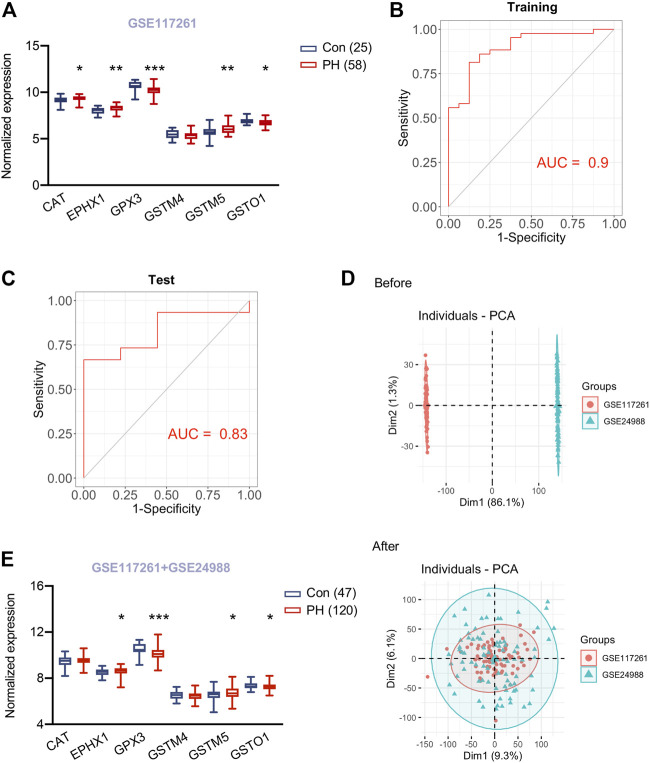
Objective: Pulmonary hypertension (PH) associated with hypoxia and lung disease (Group 3) is the second most common form of PH and associated with increased morbidity and mortality. This study was aimed to identify hypoxia induced metabolism associated genes (MAGs) for better understanding of hypoxic PH. Methods: Rat pulmonary arterial smooth muscle cells (PASMCs) were isolated and cultured in normoxic or hypoxic condition for 24 h. Cells were harvested for liquid chromatography-mass spectrometry analysis. Functional annotation of distinguishing metabolites was performed using Metaboanalyst. Top 10 enriched metabolite sets were selected for the identification of metabolism associated genes (MAGs) with a relevance score >8 in Genecards. Transcriptomic data from lungs of hypoxic PH in mice/rats or of PH patients were accessed from Gene Expression Omnibus (GEO) database or open-access online platform. Connectivity Map analysis was performed to identify potential compounds to reverse the metabolism associated gene profile under hypoxia stress. The construction and module analysis of the protein-protein interaction (PPI) network was performed. Hub genes were then identified and used to generate LASSO model to determine its accuracy to predict occurrence of PH. Results: A total of 36 altered metabolites and 1,259 unique MAGs were identified in rat PASMCs under hypoxia. 38 differentially expressed MAGs in mouse lungs of hypoxic PH were revealed, with enrichment in multi-pathways including regulation of glucose metabolic process, which might be reversed by drugs such as blebbistatin. 5 differentially expressed MAGs were displayed in SMCs of Sugen 5416/hypoxia induced PH rats at the single cell resolution. Furthermore, 6 hub genes (Cat, Ephx1, Gpx3, Gstm4, Gstm5, and Gsto1) out of 42 unique hypoxia induced MAGs were identified. Higher Cat, Ephx1 and lower Gsto1 were displayed in mouse lungs under hypoxia (all p < 0.05), in consistent with the alteration in lungs of PH patients. The hub gene-based LASSO model can predict the occurrence of PH (AUC = 0.90). Conclusion: Our findings revealed six hypoxia-induced metabolism associated hub genes, and shed some light on the molecular mechanism and therapeutic targets in hypoxic PH.
Keywords: hypoxia; metabolism associated genes; metabolomics; pulmonary hypertension; transcriptomics.
Copyright © 2021 He, Xie, Zhang, Ye, Gencer, van der Vorst, Döring, Weber, Pang, Jing, Yan and Han.
Conflict of interest statement
The authors declare that the research was conducted in the absence of any commercial or financial relationships that could be construed as a potential conflict of interest.
Figures
Similar articles
-
Regulatory T Cell-Related Gene Indicators in Pulmonary Hypertension.Front Pharmacol. 2022 May 31;13:908783. doi: 10.3389/fphar.2022.908783. eCollection 2022. Front Pharmacol. 2022. PMID: 35712711 Free PMC article.
-
Implication of proliferation gene biomarkers in pulmonary hypertension.Animal Model Exp Med. 2021 Nov 22;4(4):369-380. doi: 10.1002/ame2.12191. eCollection 2021 Dec. Animal Model Exp Med. 2021. PMID: 34977488 Free PMC article.
-
Selenoprotein P Promotes the Development of Pulmonary Arterial Hypertension: Possible Novel Therapeutic Target.Circulation. 2018 Aug 7;138(6):600-623. doi: 10.1161/CIRCULATIONAHA.117.033113. Circulation. 2018. PMID: 29636330
-
Identification of Zip8-correlated hub genes in pulmonary hypertension by informatic analysis.PeerJ. 2023 Aug 28;11:e15939. doi: 10.7717/peerj.15939. eCollection 2023. PeerJ. 2023. PMID: 37663293 Free PMC article.
-
Adaptive evolution of antioxidase-related genes in hypoxia-tolerant mammals.Front Genet. 2024 Apr 25;15:1315677. doi: 10.3389/fgene.2024.1315677. eCollection 2024. Front Genet. 2024. PMID: 38725483 Free PMC article. Review.
Cited by
-
Regulatory T Cell-Related Gene Indicators in Pulmonary Hypertension.Front Pharmacol. 2022 May 31;13:908783. doi: 10.3389/fphar.2022.908783. eCollection 2022. Front Pharmacol. 2022. PMID: 35712711 Free PMC article.
-
Comprehensive network pharmacology and experimental study to investigate the effect and mechanism of solasonine on breast carcinoma treatment.Cancer Cell Int. 2025 Feb 17;25(1):49. doi: 10.1186/s12935-025-03665-6. Cancer Cell Int. 2025. PMID: 39962568 Free PMC article.
-
Animal models of pulmonary hypertension due to left heart disease.Animal Model Exp Med. 2022 Sep;5(3):197-206. doi: 10.1002/ame2.12214. Epub 2022 Feb 9. Animal Model Exp Med. 2022. PMID: 35234367 Free PMC article. Review.
-
Insights into the Role of Glutathione Peroxidase 3 in Non-Neoplastic Diseases.Biomolecules. 2024 Jun 13;14(6):689. doi: 10.3390/biom14060689. Biomolecules. 2024. PMID: 38927092 Free PMC article. Review.
-
L-Carnitine Alleviates the Myocardial Infarction and Left Ventricular Remodeling through Bax/Bcl-2 Signal Pathway.Cardiovasc Ther. 2022 May 23;2022:9615674. doi: 10.1155/2022/9615674. eCollection 2022. Cardiovasc Ther. 2022. PMID: 35692375 Free PMC article.
References
LinkOut - more resources
Full Text Sources
Miscellaneous