. 2021 Nov 4:12:755124.
doi: 10.3389/fphys.2021.755124. eCollection 2021.

Differential Effects of 'Vaping' on Lipid and Glucose Profiles and Liver Metabolic Markers in Obese Versus Non-obese Mice

Affiliations

Differential Effects of 'Vaping' on Lipid and Glucose Profiles and Liver Metabolic Markers in Obese Versus Non-obese Mice

Hui Chen et al. Front Physiol. .

Abstract

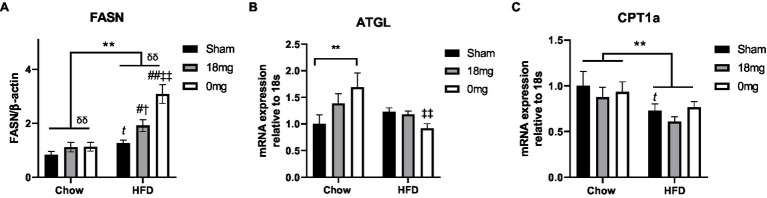
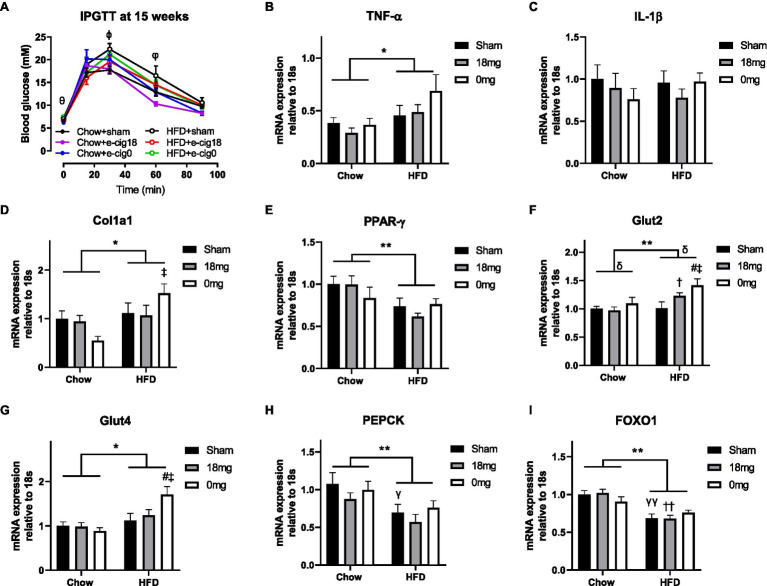
Tobacco smoking increases the risk of metabolic disorders due to the combination of harmful chemicals, whereas pure nicotine can improve glucose tolerance. E-cigarette vapour contains nicotine and some of the harmful chemicals found in cigarette smoke at lower levels. To investigate how e-vapour affects metabolic profiles, male Balb/c mice were exposed to a high-fat diet (HFD, 43% fat, 20kJ/g) for 16weeks, and e-vapour in the last 6weeks. HFD alone doubled fat mass and caused dyslipidaemia and glucose intolerance. E-vapour reduced fat mass in HFD-fed mice; only nicotine-containing e-vapour improved glucose tolerance. In chow-fed mice, e-vapour increased lipid content in both blood and liver. Changes in liver metabolic markers may be adaptive responses rather than causal. Future studies can investigate how e-vapour differentially affects metabolic profiles with different diets.

Keywords: abdominal obesity; free fatty acid; glucose tolerance; liver; triglycerides.


Conflict of interest statement

The authors declare that the research was conducted in the absence of any commercial or financial relationships that could be construed as a potential conflict of interest.

Figures

Figure 1
Figure 1
Lipid metabolic markers in the liver. Protein level of FASN (A), mRNA expression of ATGL (B) and CPT1a (C) in mice fed a HFD with or without the exposure to e-vapour. The results are expressed as mean±SEM, n=5–8. Data were analysed by two-way ANOVA followed by Fisher’s least significant difference (LSD) post-hoc tests. A conditional t-test for non-overlap of value distributions was performed between the control (Chow+sham or HFD+sham) and interventional groups. **p<0.01 diet effect, δδp<0.01 e-vapour exposure effect; tp<0.05 vs. Chow+Sham by conditional t-test, #p<0.05, ##p<0.01 vs. HFD+Sham, p<0.05 vs. Chow+e-cig18mg and ‡‡p<0.01 vs. Chow+e-cig0. ATGL, adipose triglyceride lipase; CPT, carnitine palmitoyltransferase; and FASN, fatty acid synthase.
Figure 2
Figure 2
Glucose level during intraperitoneal glucose tolerance test (IPGTT, A) and mRNA expression of markers of inflammation [TNF-α (B), IL-1β (C)], fibrosis (Col1a1, D), insulin sensing (PPARγ, E), glucose transporter [Glut2 (F), Glut4 (G)] and gluconeogenesis [PEPCK (H), FOXO1 (I)] in the liver. The results are expressed as mean±SEM, n=5–8. Data were analysed by two-way ANOVA followed by Fisher’s least significant difference (LSD) post-hoc tests. θp<0.05 Chow+e-cig0 vs. HFD+e-cig0; ϕp<0.01 Chow+sham vs. HFD+sham; φp<0.05 Chow+sham vs. HFD+sham; Chow+e-cig18 vs. HFD+e-cig18; *p<0.05, **p<0.01 diet effect, δp<0.05 e-vapour exposure effect; γp<0.05, γγp<0.01 vs. Chow+sham; and #p<0.05 vs. HFD+Sham, p<0.05; ††p<0.01 vs. Chow+e-cig18 and p<0.05 vs. Chow+e-cig0. Col1a1, collagen 1a1; FOXO1, Forkhead box protein O1; Glut, glucose transporter; PEPCK, phosphoenolpyruvate carboxykinase; and PPAR, Peroxisome proliferator-activated receptors.

References

    1. Alpert H. R., Agaku I. T., Connolly G. N. (2015). A study of pyrazines in cigarettes and how additives might be used to enhance tobacco addiction. Tob. Control. 25, 444–450. doi: 10.1136/tobaccocontrol-2014-051943, PMID: - DOI - PMC - PubMed
    1. Bustin S. A., Benes V., Garson J. A., Hellemans J., Huggett J., Kubista M., et al. . (2009). The MIQE guidelines: minimum information for publication of quantitative real-time PCR experiments. Clin. Chem. 55, 611–622. doi: 10.1373/clinchem.2008.112797, PMID: - DOI - PubMed
    1. Chen H., Hansen M. J., Jones J. E., Vlahos R., Anderson G., Morris M. J. (2007). Detrimental metabolic effects of combining long term cigarette smoke exposure and high-fat diet in mice. Am. J. Physiol. Endocrinol. Metab. 293, E1564–E1571. doi: 10.1152/ajpendo.00442.2007, PMID: - DOI - PubMed
    1. Chen H., Li G., Chan Y. L., Chapman D. G., Sukjamnong S., Nguyen T., et al. . (2018a). Maternal e-cigarette exposure in mice alters DNA methylation and lung cytokine expression in offspring. Am. J. Respir. Cell Mol. Biol. 58, 366–377. doi: 10.1165/rcmb.2017-0206RC, PMID: - DOI - PubMed
    1. Chen H., Ng J. P. M., Bishop D. P., Milthorpe B. K., Valenzuela S. M. (2018b). Gold nanoparticles as cell regulators: beneficial effects of gold nanoparticles on the metabolic profile of mice with pre-existing obesity. J. Nanobiotechnol. 16:88. doi: 10.1186/s12951-018-0414-6, PMID: - DOI - PMC - PubMed

LinkOut - more resources