

What You Eat Matters: Nutrient Inputs Alter the Metabolism and Neuropeptide Expression in Egyptian Cotton Leaf Worm, Spodoptera littoralis (Lepidoptera: Noctuidae)
- PMID: 34803746
- PMCID: PMC8600137
- DOI: 10.3389/fphys.2021.773688
What You Eat Matters: Nutrient Inputs Alter the Metabolism and Neuropeptide Expression in Egyptian Cotton Leaf Worm, Spodoptera littoralis (Lepidoptera: Noctuidae)
Abstract
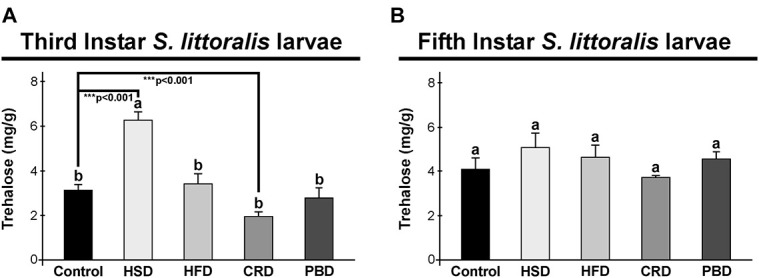
Lipids and carbohydrates are the two primary energy sources for both animals and insects. Energy homeostasis is under strict control by the neuroendocrine system, and disruption of energy homeostasis leads to the development of various disorders, such as obesity, diabetes, fatty liver syndrome, and cardiac dysfunction. One critical factor in this respect is feeding habits and diet composition. Insects are good models to study the physiological and biochemical background of the effect of diet on energy homeostasis and related disorders; however, most studies are based on a single model species, Drosophila melanogaster. In the current study, we examined the effects of four different diets, high fat (HFD), high sugar (HSD), calcium-rich (CRD), and a plant-based (PBD) on energy homeostasis in younger (third instar) and older (fifth instar) larvae of the Egyptian cotton leafworm, Spodoptera littoralis (Lepidoptera: Noctuidae) in comparison to a regular artificial bean diet. Both HSD and HFD led to weight gain, while CRD had the opposite effect and PBD had no effect in fifth instar larvae and pupae. The pattern was the same for HSD and CRD in third instar larvae while a reduction in weight was detected with HFD and PBD. Larval development was shortest with the HSD, while HFD, CRD, and PBD led to retardation compared to the control. Triglyceride (TG) levels were higher with HFD, HSD, and PBD, with larger lipid droplet sizes, while CRD led to a reduction of TG levels and lipid droplet size. Trehalose levels were highest with HSD, while CRD led to a reduction at third instar larvae, and HFD and PBD had no effect. Fifth instar larvae had similar levels of trehalose with all diets. There was no difference in the expression of the genes encoding neuropeptides SpoliAKH and SpoliILP1-2 with different diets in third instar larvae, while all three genes were expressed primarily with HSD, and SpolisNPF was primarily expressed with HFD in fifth instar larvae. In summary, different diet treatments alter the development of insects, and energy and metabolic pathways through the regulation of peptide hormones.
Keywords: AKH; calcium; high-fat; high-sugar; insulin; lipid; sNPF; trehalose.
Copyright © 2021 Doğan, Güney, Güzel, Can, Hegedus and Toprak.
Conflict of interest statement
The authors declare that the research was conducted in the absence of any commercial or financial relationships that could be construed as a potential conflict of interest.
Figures


Similar articles
-
Efficacy of some plant oils alone and/or combined with different insecticides on the cotton leaf-worm Spodoptera littoralis (Boisd.) (Lepidoptera: Noctuidae) in Egypt.Commun Agric Appl Biol Sci. 2006;71(2 Pt B):305-28. Commun Agric Appl Biol Sci. 2006. PMID: 17385497
-
Influence of the nonsteroidal ecdysone agonist, tebufenozide, on certain biological and physiological parameters of the cotton leaf-worm, Spodoptera littoralis (Boisd.) (Noctuidae: Lepidoptera) in Egypt.Commun Agric Appl Biol Sci. 2004;69(3):119-39. Commun Agric Appl Biol Sci. 2004. PMID: 15759403
-
Biological performance of quercetin on the cotton leaf-worm larvae, Spodoptera littoralis Boisd. (Lep., Noctuidae) and prevailing natural enemies in the Egyptian cotton fields.Commun Agric Appl Biol Sci. 2007;72(3):611-22. Commun Agric Appl Biol Sci. 2007. PMID: 18399494
-
A protein restricted diet induces a stable increased fat storage phenotype in flies.Toxicol Rep. 2023 Jun 7;10:706-713. doi: 10.1016/j.toxrep.2023.06.003. eCollection 2023. Toxicol Rep. 2023. PMID: 37396850 Free PMC article.
-
Effects of dietary sodium on performance, flight and compensation strategies in the cotton bollworm, Helicoverpa armigera (Hübner) (Lepidoptera: Noctuidae).Front Zool. 2010 Apr 13;7:11. doi: 10.1186/1742-9994-7-11. Front Zool. 2010. PMID: 20385025 Free PMC article.
Cited by
-
Endocrine Regulation of Lifespan in Insect Diapause.Front Physiol. 2022 Feb 15;13:825057. doi: 10.3389/fphys.2022.825057. eCollection 2022. Front Physiol. 2022. PMID: 35242054 Free PMC article. Review.
-
Physiological Response of Tribolium castaneum to CO2 Controlled Atmosphere Stress Under Trehalose Feeding.Insects. 2025 Jul 26;16(8):768. doi: 10.3390/insects16080768. Insects. 2025. PMID: 40870569 Free PMC article.
-
Carbon Quantum Dot Nanoparticles Enhance the Efficacy of Spodoptera littoralis Nucleopolyhedrovirus Suspoemulsion.Arch Insect Biochem Physiol. 2025 Feb;118(2):e70027. doi: 10.1002/arch.70027. Arch Insect Biochem Physiol. 2025. PMID: 39898834 Free PMC article.
References
LinkOut - more resources
Full Text Sources
Miscellaneous