. 2021 Nov 5:12:747580.
doi: 10.3389/fneur.2021.747580. eCollection 2021.

Prospective Quantitative Neuroimaging Analysis of Putative Temporal Lobe Epilepsy

Affiliations

Prospective Quantitative Neuroimaging Analysis of Putative Temporal Lobe Epilepsy

Kost Elisevich et al. Front Neurol. .

Abstract

Purpose: A prospective study of individual and combined quantitative imaging applications for lateralizing epileptogenicity was performed in a cohort of consecutive patients with a putative diagnosis of mesial temporal lobe epilepsy (mTLE). Methods: Quantitative metrics were applied to MRI and nuclear medicine imaging studies as part of a comprehensive presurgical investigation. The neuroimaging analytics were conducted remotely to remove bias. All quantitative lateralizing tools were trained using a separate dataset. Outcomes were determined after 2 years. Of those treated, some underwent resection, and others were implanted with a responsive neurostimulation (RNS) device. Results: Forty-eight consecutive cases underwent evaluation using nine attributes of individual or combinations of neuroimaging modalities: 1) hippocampal volume, 2) FLAIR signal, 3) PET profile, 4) multistructural analysis (MSA), 5) multimodal model analysis (MMM), 6) DTI uncertainty analysis, 7) DTI connectivity, and 9) fMRI connectivity. Of the 24 patients undergoing resection, MSA, MMM, and PET proved most effective in predicting an Engel class 1 outcome (>80% accuracy). Both hippocampal volume and FLAIR signal analysis showed 76% and 69% concordance with an Engel class 1 outcome, respectively. Conclusion: Quantitative multimodal neuroimaging in the context of a putative mTLE aids in declaring laterality. The degree to which there is disagreement among the various quantitative neuroimaging metrics will judge whether epileptogenicity can be confined sufficiently to a particular temporal lobe to warrant further study and choice of therapy. Prediction models will improve with continued exploration of combined optimal neuroimaging metrics.

Keywords: MRI; lateralization; multimodal analysis; neuroimaging; temporal lobe epilepsy.


Conflict of interest statement

The authors declare that the research was conducted in the absence of any commercial or financial relationships that could be construed as a potential conflict of interest.

Figures

Figure 1
Figure 1
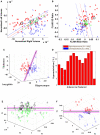
Case P15. Quantitative neuroimaging analysis in a patient who underwent Phase I study followed by a left temporal resection and achieved an Engel class I outcome. The epileptogenic site was predicted accurately by models for this case. The prospective case is shown (O). (A) Scatter plot of normalized hippocampal volumes showing distribution of control subjects (C) and study cases by their laterality for epileptogenicity (i.e., left vs. right). The volumes of control subjects are clustered and define the boundary domain (blue lines) within which the separation of a right- or left-sided mesial temporal lobe epilepsy (mTLE), to either side of the decision line (red line), may not be possible. (B) Scatter plot of mean and standard deviation ratios (right/left) of fluid-attenuated inversion recovery (FLAIR) MR signal intensity with control subjects (C) clustered in the boundary domain and study cases distinguished by their laterality for epileptogenicity (i.e., left vs. right). (C) The logistic decision plane of the multistructural analysis (MSA) model uses the normalized bilateral volume change [i.e., 100(vL – vR)/(Vl + vR)] of thalamic, amygdalar and hippocampal volumes to lateralize the prospective (O) case. Note that the decision plane is parallel to the angle of view; hence, it is seen as a line in two dimensions.
Figure 2
Figure 2
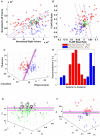
Case P03. Quantitative neuroimaging analysis in a patient who underwent Phase I study followed by a right temporal resection achieving an Engel class 2B outcome. The models did not adequately lateralize the epileptogenic side. Hippocampal volumetry (A) and FLAIR intensity (B) scatter plots lateralized this case as right-sided (O). However, the MSA model (C) was poorly lateralizing with the prospective case immediately to the left of the decision plane (i.e., UL; Table 1). (D) The cross-sectional position emission tomography (PET) profile of hippocampal hypometabolism strongly showed right-sided hypointensity for this case. Diffusion tensor image (DTI) connectivity analysis was indeterminate (i.e., U; Table 1). The support vector machine (SVM)-based classifiers developed for (E) categorizing whether the epileptogenic area resided in the temporal lobe, T, or not, T, and (F) lateralizing the epileptogenic area, showed the prospective case to reside within the boundary domain and on the borderline, respectively. Note that the decision plane is parallel to the angle of view; hence, it is seen as a black line in two dimensions. The uncertainty boundaries are demonstrated as pink lines which are defined here to be half the maximum margin of the support vectors (64). The features for categorization (F1–F3) and for lateralization (F4–F6) are defined in Methods section Diffusion Tensor Image Connectivity Analysis.
Figure 3
Figure 3
Case P20. Quantitative neuroimaging study of a patient who underwent both Phase I and II study followed by a right temporal resection and achieved an Engel class 1 outcome. Hippocampal volumetry (A) and FLAIR intensity (B) scatter plots showed poor lateralization (O) although MSA (C) identified a right laterality. PET (D) was indeterminate for the most part with variable slice-by-slice distribution favoring either right or left sides although predominating toward the right in the hippocampal body. DTI connectivity (E, F) favored the left minimally (i.e., UL; Table 1).

Similar articles

Cited by

References

    1. Cendes F, Leproux F, Melanson D, Ethier R, Evans A, Peters T, et al. . of amygdala and hippocampus in temporal lobe epilepsy. J Comput Assist Tomogr. (1993) 17:206–10. 10.1097/00004728-199303000-00008 - DOI - PubMed
    1. Hammers A, Heckemann R, Koepp MJ, Duncan JS, Hajnal JV, Rueckert D, et al. . Automatic detection and quantification of hippocampal atrophy on MRI in temporal lobe epilepsy: a proof-of-principle study. Neuroimage. (2007) 36:38–47. 10.1016/j.neuroimage.2007.02.031 - DOI - PubMed
    1. Jack CR, Sharbrough FW, Twomey CK, Cascino GD, Hirschorn KA, Marsh WR, et al. . Temporal lobe seizures: lateralization with MR volume measurements of the hippocampal formation. Radiology. (1990) 175:423–9. 10.1148/radiology.175.2.2183282 - DOI - PubMed
    1. Van Paesschen W, Sisodiya S, Connelly A, Duncan JS, Free SL, Raymond AA, et al. . Quantitative hippocampal MRI and intractable temporal lobe epilepsy. Neurology. (1995) 45:2233–40. 10.1212/WNL.45.12.2233 - DOI - PubMed
    1. Woermann FG, Barker GJ, Birnie KD, Meencke HJ, Duncan JS. Regional changes in hippocampal T2 relaxation and volume: a quantitative magnetic resonance imaging study of hippocampal sclerosis. J Neurol Neurosurg Psychiatry. (1998) 65:656–64. 10.1136/jnnp.65.5.656 - DOI - PMC - PubMed

LinkOut - more resources