. 2021 Nov 3:12:697725.
doi: 10.3389/fimmu.2021.697725. eCollection 2021.

Intestinal CD11b+ B Cells Ameliorate Colitis by Secreting Immunoglobulin A

Affiliations

Intestinal CD11b+ B Cells Ameliorate Colitis by Secreting Immunoglobulin A

Ying Fu et al. Front Immunol. .

Abstract

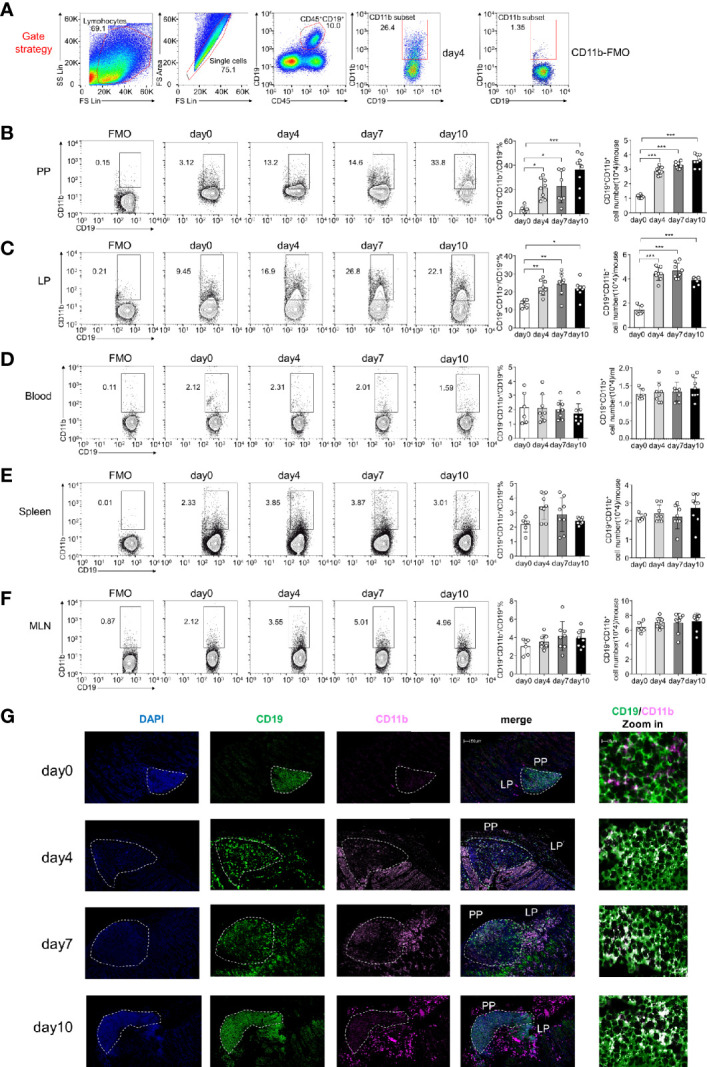
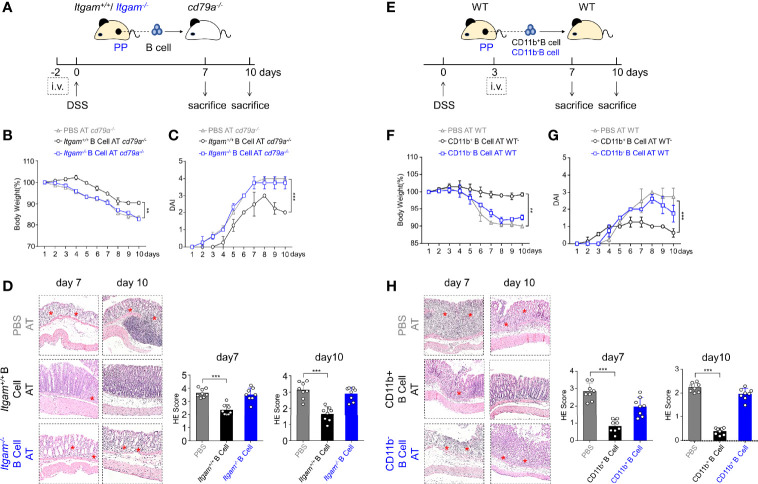
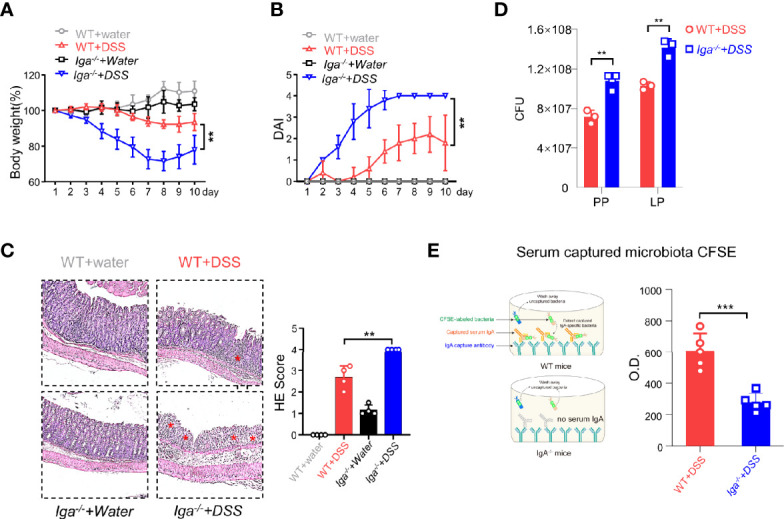
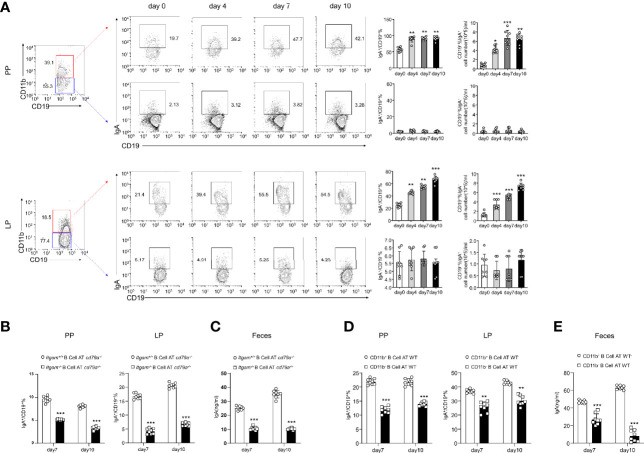
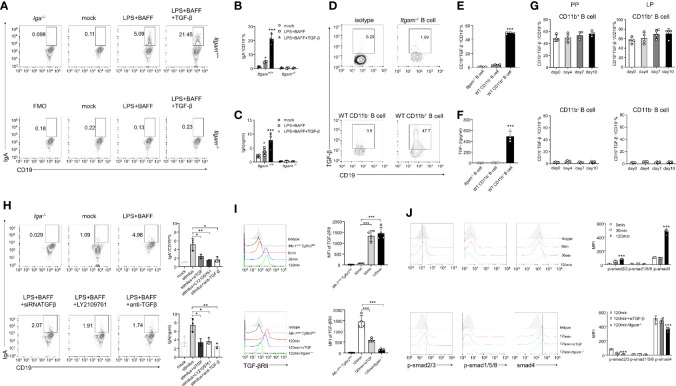
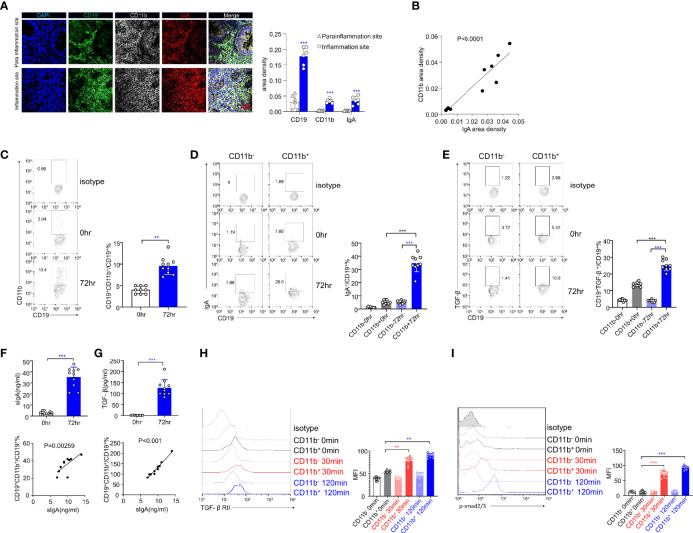
The intestinal mucosal immune environment requires multiple immune cells to maintain homeostasis. Although intestinal B cells are among the most important immune cells, little is known about the mechanism that they employ to regulate immune homeostasis. In this study, we found that CD11b+ B cells significantly accumulated in the gut lamina propria and Peyer's patches in dextran sulfate sodium-induced colitis mouse models and patients with ulcerative colitis. Adoptive transfer of CD11b+ B cells, but not CD11b-/- B cells, effectively ameliorated colitis and exhibited therapeutic effects. Furthermore, CD11b+ B cells were found to produce higher levels of IgA than CD11b- B cells. CD11b deficiency in B cells dampened IgA production, resulting in the loss of their ability to ameliorate colitis. Mechanistically, CD11b+ B cells expressed abundant TGF-β and TGF-β receptor II, as well as highly activate phosphorylated Smad2/3 signaling pathway, consequently promoting the class switch to IgA. Collectively, our findings demonstrate that CD11b+ B cells are essential intestinal suppressive immune cells and the primary source of intestinal IgA, which plays an indispensable role in maintaining intestinal homeostasis.

Keywords: CD11b+ B cells; DSS-induced colitis; IgA; Smad; TGF-β.


Conflict of interest statement

The authors declare that the research was conducted in the absence of any commercial or financial relationships that could be construed as a potential conflict of interest.

Figures

Figure 1
Figure 1
CD11b is induced in Peyer’s patches (PPs) and colorectal lamina propria (LP) B cells during dextran sulfate sodium (DSS)-induced colitis. Flow cytometry was used to analyze the frequency and absolute number of CD11b+ B cells. (A) Gating strategy for the identification of CD19+CD11b+ cells in gut-associated lymphoid tissue (GALT). Representative data from the LP of colitis mice on day 4 after DSS induction. Different fluorochrome-labeled isotype control antibodies or anti-CD45, -CD19, and -CD11b antibodies were used for staining. Numbers indicate the percentage of positive cells. The right panel represents CD11b fluorescence minus one (FMO) staining. Cells were isolated from the PPs (B), colorectal LP (C), total blood cell (D), spleen (E), and MLN (F) of DSS-induced WT mice on days 0, 4, 7, and 10. The absolute numbers were counting as follow: for PPs, colorectal LP, spleen, and MLN, the number of cells in that organ per mouse times the ratio of CD11b+B cells to obtain absolute count/mouse; for blood cell, 200ul blood cells were counted after red blood cell lysis, the number of 200ul blood cells times five and times the ratio of CD11b+B cells to obtain absolute count/ml. (G) Immunofluorescence of CD11b+CD19+ B cells in PPs and LPs. *P < 0.05, **P < 0.01, ***P < 0.001. Data are expressed as the mean ± SEM of one experiment with six to eight mice, performed in triplicate with similar results.
Figure 2
Figure 2
CD11b-deficient B cells exhibit impaired ability to resolve colitis. (A) Each Cd79a−/− mouse intravenously received 1 × 10⁷ PP-derived B cells from WT mice (Itgam+/+ ) or Itgam−/− mice 2 days before the induction of colitis. Mice were evaluated daily, and weight loss (B) and disease activity index (DAI) scores (C) were recorded. (D) Representative distal colon histological sections of Cd79a−/− mice were stained with hematoxylin and eosin (H&E), and the histological score was calculated. Images are displayed at the original magnification of ×100. Red stars indicate the position of the inflammatory cell infiltration and/or epithelial damage. (E) PP-derived B cells of WT mice were sorted and stimulated with lipopolysaccharide (LPS) for 48 h in vitro. CD11b+ and CD11b B cells were subsequently purified and intravenously injected (5 × 10⁶ cells per mice) into WT mice treated with DSS for 3 days. Weight loss (F) and the DAI scores (G) of recipient mice were measured and evaluated from day 0 to day 7. (H) H&E-stained histological sections of distal colon tissue are presented. Images are displayed at the original magnification of ×100. Red stars indicate the position of the histological injury. **P < 0.01, ***P < 0.001. Data are expressed as mean ± SEM of eight mice.
Figure 3
Figure 3
IgA in DSS-induced colitis. (A) Iga−/− mice and WT mice were administered DSS or regular water (water). Mice were evaluated daily, and weight loss and disease activity index (DAI) scores (B) were recorded. (C) Representative distal colon histological sections of Iga−/− mice were stained with hematoxylin and eosin (H&E), and the histological score was calculated. Images are presented at the original magnification of ×100. Red stars indicate the position of the inflammatory cell infiltration and/or epithelial damage. (D) The colony-forming units (CFU) counts of the bacteria in the feces of WT mice or Iga-/- mice on day 7 of colitis. (E) The O.D. values which indicated bacteria captured by the serum antibodies of WT mice or the Iga-/- mice on day 7 after DSS intervention were measured. **P < 0.01, ***P < 0.001. Data are expressed as mean ± SEM of three mice.
Figure 4
Figure 4
B cells expressing CD11b contribute to the differentiation of IgA in mice with colitis. (A) Expression levels of IgA in CD11b+ B cells and CD11b B cells in the PPs and colorectal LP at days 0, 4, 7, and 10 after treatment with DSS were detected using flow cytometry. The frequency and absolute number of IgA-expressing cells are presented. (B) The adoptively transferred Itgam+/+ or Itgam−/− mice into Cd79a−/− mice were as described in Figure 1 . The percentage and absolute number of IgA+ B cells in the LP and PPs from DSS-treated Cd79a−/− mice were analyzed using flow cytometry. (C) The supernatant of the mucus-containing fluid was harvested and transferred into 10 mL phosphate-buffered saline (PBS), and the production of sIgA in the colon was determined using enzyme-linked immunosorbent assay (ELISA). (D) The adoptively transferred CD11b+ and CD11b B cells into WT mice were as described in Figure 1 . (E) The supernatant of the mucus-containing fluid was harvested and transferred into 10 mL PBS, and the production of sIgA in the colon was determined using ELISA. **P < 0.01; ***P < 0.001. Data are expressed as mean ± SEM of six mice.
Figure 5
Figure 5
CD11b-deficient altering of Smad signaling in B cells resulted in reduced TGF-β production and IgA isotype switching. (A) Purified PP-derived Itgam+/+ and Itgam−/− B cells of WT mice or Iga-/- mice were stimulated with LPS, BAFF, and TGF-β for 72 h Subsequently, IgA+ B cells were analyzed using flow cytometry (The Iga-/- group was shown as a negative control). (B) The frequency of IgA-expressing cells is displayed. (C) The culture supernatant was harvested to determine the production of IgA via ELISA. (D) The population of TGF-β+ B cells in the PPs from DSS-treated mice was analyzed using flow cytometry. (E) The frequency of TGF-β-expressing cells is displayed. (F) Expression of TGF-β in mouse serum was measured using ELISA. (G) Expression of TGF-β in CD11b+ B cells and CD11b B cells in the PPs and colorectal LP at days 0, 4, 7, and 10 after treatment with DSS was detected using flow cytometry. The frequency and absolute number of IgA+ cells are presented. (H) The splenic B cells of mice were purified and transfected with small interfering RNA targeted for TGF-β (siTGF, other groups were transfected with the negative control siRNA for contrast). All groups were subsequently stimulated by LPS, BAFF, and TGF-β for 72 h in vitro. LY2109761 (5 µM) and anti-TGF-β (4 µg/mL) were used to inhibit TGF-β or TGF-β receptor, and the percentage of IgA+ B cells was measured using flow cytometry, and the IgA level in culture supernatant was measured using ELISA. The splenic B cells from the PP of WT mice, Mb-1cre/-Tgfbr2fl/fl , and Itgam−/− mice were purified and subsequently stimulated by LPS, TGF-β, or anti-TGF-β (αTGF, 4 µg/mL) for 0, 30, and 120 min. Expression of TGF-βRII (I) and the phosphorylation levels of Smad1/5/8 and Smad2/3 (J) were analyzed using flow cytometry. *P < 0.05; **P < 0.01; ***P < 0.001. Data are expressed as the mean of three independent experiments.
Figure 6
Figure 6
The expression levels of IgA and TGF-β/Smad pathway are upregulated in human CD11b+ B cells in vitro. (A) Representative staining of CD19 (green), CD11b (white), IgA (red), and 4′, 6-diamidino-2-phenylindole (DAPI) (blue) in the colon tissue of ulcerative colitis (UC) patients. The area density of each marker was calculated. Average data were collected from 20 random fields per patient, n = 6. (B) The relative area density of CD11b and IgA was identified. (C) Total PBMCs were purified and stimulated with CpG-ODN (2 μg/mL) and recombinant human IL-10 for 72 h in vitro. Cells were stained for CD11b detection and analyzed using flow cytometry. (D) The percentage of IgA+ B cells in CD11b+ and CD11b B cells was analyzed using flow cytometry. (E) The percentage of TGF-β+ B cells in CD11b+ and CD11b B cells was analyzed using flow cytometry. (F) The culture supernatant was harvested to determine the production of IgA (upper panel) via ELISA. The relative frequencies of CD19+CD11b+ cells and sIgA level were measured (lower panel). (G) The culture supernatant was harvested to determine the production of TGF-β (upper panel) via ELISA. The relative frequencies of CD19+CD11b+ cells and TGF-β level were measured (lower panel). The PBMCs from healthy donors were purified and subsequently stimulated by CpG and TGF-β for 0, 30, and 120 min. Expression of TGF-βRII (H) and the phosphorylation level of Smad2/3 (I) were analyzed using flow cytometry. **P < 0.01; ***P < 0.001. Data represent the mean of more than three independent experiments.

Similar articles

Cited by

References

    1. Kurashima Y, Kiyono H. Mucosal Ecological Network of Epithelium and Immune Cells for Gut Homeostasis and Tissue Healing. Annu Rev Immunol (2017) 35:119–47. doi: 10.1146/annurev-immunol-051116-052424 - DOI - PubMed
    1. Shulzhenko N, Morgun A, Hsiao W, Battle M, Yao M, Gavrilova O, et al. . Crosstalk Between B Lymphocytes, Microbiota and the Intestinal Epithelium Governs Immunity Versus Metabolism in the Gut. Nat Med (2011) 17(12):1585–93. doi: 10.1038/nm.2505 - DOI - PMC - PubMed
    1. Tanoue T, Atarashi K, Honda K. Development and Maintenance of Intestinal Regulatory T Cells. Nat Rev Immunol (2016) 16(5):295–309. doi: 10.1038/nri.2016.36 - DOI - PubMed
    1. Jorgensen PB, Fenton TM, Morbe UM, Riis LB, Jakobsen HL, Nielsen OH, et al. . Identification, Isolation and Analysis of Human Gut-Associated Lymphoid Tissues. Nat Protoc (2021) 16(4):2051–67. doi: 10.1038/s41596-020-00482-1 - DOI - PubMed
    1. Tseng J. Transfer of Lymphocytes of Peyer's Patches Between Immunoglobulin Allotype Congenic Mice: Repopulation of the IgA Plasma Cells in the Gut Lamina Propria. J Immunol (1981) 127(5):2039–43. - PubMed

Publication types

MeSH terms