

Serum Alpha-1-Acid Glycoprotein-1 and Urinary Extracellular Vesicle miR-21-5p as Potential Biomarkers of Primary Aldosteronism
- PMID: 34804057
- PMCID: PMC8603108
- DOI: 10.3389/fimmu.2021.768734
Serum Alpha-1-Acid Glycoprotein-1 and Urinary Extracellular Vesicle miR-21-5p as Potential Biomarkers of Primary Aldosteronism
Abstract
Primary aldosteronism (PA) is the most common cause of secondary hypertension and reaches a prevalence of 6-10%. PA is an endocrine disorder, currently identified as a broad-spectrum phenotype, spanning from normotension to hypertension. In this regard, several studies have made advances in the identification of mediators and novel biomarkers of PA as specific proteins, miRNAs, and lately, extracellular vesicles (EVs) and their cargo.
Aim: To evaluate lipocalins LCN2 and AGP1, and specific urinary EV miR-21-5p and Let-7i-5p as novel biomarkers for PA.
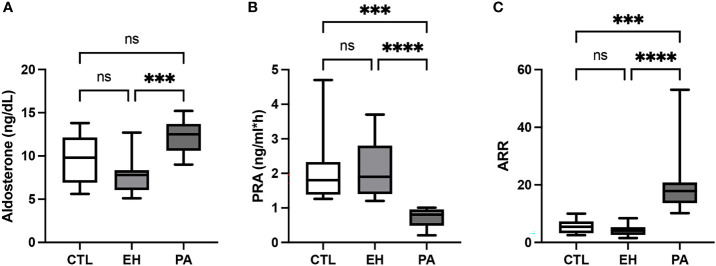
Subjects and methods: A cross-sectional study was performed in 41 adult subjects classified as normotensive controls (CTL), essential hypertensives (EH), and primary aldosteronism (PA) subjects, who were similar in gender, age, and BMI. Systolic (SBP) and diastolic (DBP) blood pressure, aldosterone, plasma renin activity (PRA), and aldosterone to renin ratio (ARR) were determined. Inflammatory parameters were defined as hs-C-reactive protein (hs-CRP), PAI-1, MMP9, IL6, LCN2, LCN2-MMP9, and AGP1. We isolated urinary EVs (uEVs) and measured two miRNA cargo miR-21-5p and Let-7i-5p by Taqman-qPCR. Statistical analyses as group comparisons were performed by Kruskall-Wallis, and discriminatory analyses by ROC curves were performed with SPSS v21 and Graphpad-Prism v9.
Results: PA and EH subjects have significantly higher SBP and DBP (p <0.05) than the control group. PA subjects have similar hs-CRP, PAI-1, IL-6, MMP9, LCN2, and LCN2-MMP9 but have higher levels of AGP1 (p <0.05) than the CTL&EH group. The concentration and size of uEVs and miRNA Let-7i-5p did not show any difference between groups. In PA, we found significantly lower levels of miR-21-5p than controls (p <0.05). AGP1 was associated with aldosterone, PRA, and ARR. ROC curves detected AUC for AGP1 of 0.90 (IC 95 [0.79 - 1.00], p <0.001), and combination of AGP1 and EV-miR-21-5p showed an AUC of 0.94 (IC 95 [0.85 - 1.00], p<0.001) to discriminate the PA condition from EH and controls.
Conclusion: Serum AGP1 protein was found to be increased, and miR-21-5p in uEVs was decreased in subjects classified as PA. Association of AGP1 with aldosterone, renin activity, and ARR, besides the high discriminatory capacity of AGP1 and uEV-miR-21-5p to identify the PA condition, place both as potential biomarkers of PA.
Keywords: AGP1; Alpha-1-acid glycoprotein-1; biomarker; extracellular vesicles; lipocalin; miR-21-5p; primary aldosteronism (PA).
Copyright © 2021 Carvajal, Tapia-Castillo, Pérez and Fardella.
Conflict of interest statement
The authors declare that the research was conducted in the absence of any commercial or financial relationships that could be construed as a potential conflict of interest.
Figures


Similar articles
-
Proteomic analysis of urinary extracellular vesicles highlights specific signatures for patients with primary aldosteronism.Front Endocrinol (Lausanne). 2023 May 8;14:1096441. doi: 10.3389/fendo.2023.1096441. eCollection 2023. Front Endocrinol (Lausanne). 2023. PMID: 37223008 Free PMC article.
-
Clinical, biochemical, and miRNA profile of subjects with positive screening of primary aldosteronism and nonclassic apparent mineralocorticoid excess.Endocrine. 2022 Aug;77(2):380-391. doi: 10.1007/s12020-022-03103-x. Epub 2022 Jun 8. Endocrine. 2022. PMID: 35676467
-
Proteomic Profile of Urinary Extracellular Vesicles Identifies AGP1 as a Potential Biomarker of Primary Aldosteronism.Endocrinology. 2021 Apr 1;162(4):bqab032. doi: 10.1210/endocr/bqab032. Endocrinology. 2021. PMID: 33580265
-
Primary Aldosteronism, Aldosterone, and Extracellular Vesicles.Endocrinology. 2022 Jan 1;163(1):bqab240. doi: 10.1210/endocr/bqab240. Endocrinology. 2022. PMID: 34918071 Review.
-
Neutrophil gelatinase-associated lipocalin as an immunomodulator in endocrine hypertension.Front Endocrinol (Lausanne). 2022 Oct 25;13:1006790. doi: 10.3389/fendo.2022.1006790. eCollection 2022. Front Endocrinol (Lausanne). 2022. PMID: 36387895 Free PMC article. Review.
Cited by
-
Determination of Serum Alpha-1-Acid Glycoprotein Concentration and the Influence of Physiological and Gynecological Factors in Women Attending in Tertiary-Care Center in Mexico: A Pilot Study.Mediators Inflamm. 2025 Jul 28;2025:9998286. doi: 10.1155/mi/9998286. eCollection 2025. Mediators Inflamm. 2025. PMID: 40761660 Free PMC article.
-
Advances in the biochemical diagnostics of primary aldosteronism: from immunoassays to steroidomics and proteomics.Front Endocrinol (Lausanne). 2025 Apr 16;16:1548344. doi: 10.3389/fendo.2025.1548344. eCollection 2025. Front Endocrinol (Lausanne). 2025. PMID: 40309437 Free PMC article. Review.
-
Proteomic analysis of urinary extracellular vesicles highlights specific signatures for patients with primary aldosteronism.Front Endocrinol (Lausanne). 2023 May 8;14:1096441. doi: 10.3389/fendo.2023.1096441. eCollection 2023. Front Endocrinol (Lausanne). 2023. PMID: 37223008 Free PMC article.
-
Clinical, biochemical, and miRNA profile of subjects with positive screening of primary aldosteronism and nonclassic apparent mineralocorticoid excess.Endocrine. 2022 Aug;77(2):380-391. doi: 10.1007/s12020-022-03103-x. Epub 2022 Jun 8. Endocrine. 2022. PMID: 35676467
-
Analysis of the miRNA expression from the adipose tissue surrounding the adrenal neoplasia.Front Cardiovasc Med. 2022 Jul 28;9:930959. doi: 10.3389/fcvm.2022.930959. eCollection 2022. Front Cardiovasc Med. 2022. PMID: 35966515 Free PMC article.
References
-
- Mosso L, Fardella C, Montero J, Rojas P, Sanchez O, Rojas V, et al. . High Prevalence of Undiagnosed Primary Hyperaldosteronism Among Patients With Essential Hypertension. Rev Med Chil (1999) 127(7):800–6. - PubMed
-
- Cortes P, Fardella C, Oestreicher E, Gac H, Mosso L, Soto J, et al. . Evidences for Mineralocorticoid Excess in Essential Hypertension. Rev Med Chile (2000) 128(9):955–61. - PubMed
Publication types
MeSH terms
Substances
LinkOut - more resources
Full Text Sources
Research Materials
Miscellaneous