. 2021 Nov 5:12:753847.
doi: 10.3389/fpls.2021.753847. eCollection 2021.

Fertilization Following Pollination Predominantly Decreases Phytocannabinoids Accumulation and Alters the Accumulation of Terpenoids in Cannabis Inflorescences

Affiliations

Fertilization Following Pollination Predominantly Decreases Phytocannabinoids Accumulation and Alters the Accumulation of Terpenoids in Cannabis Inflorescences

Carni Lipson Feder et al. Front Plant Sci. .

Abstract

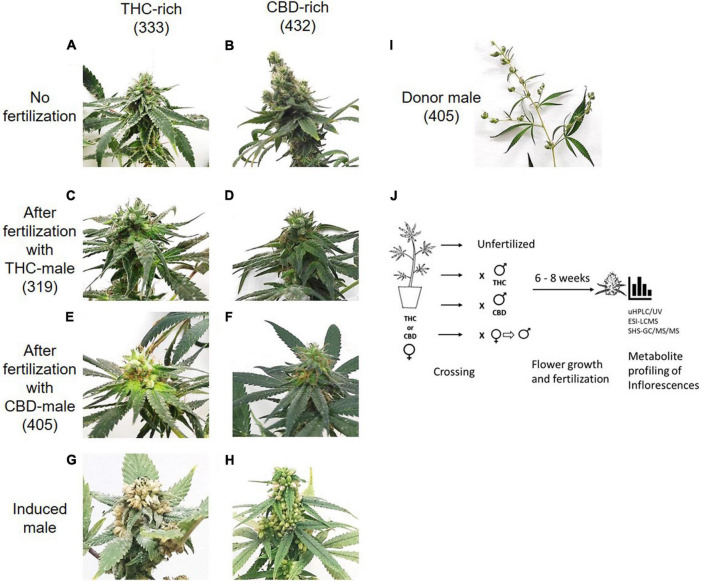
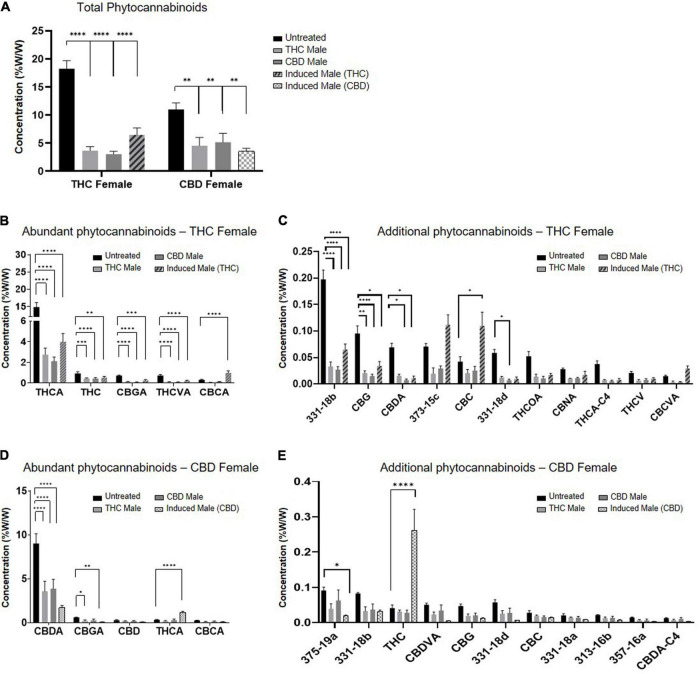
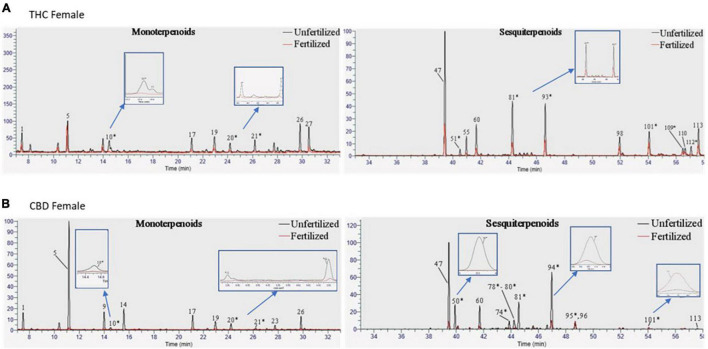
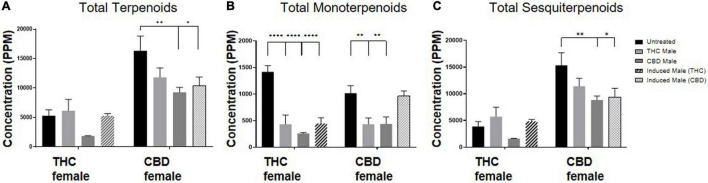
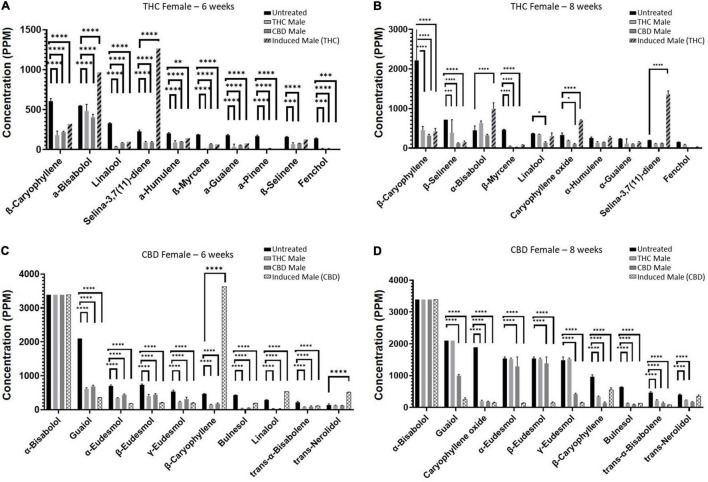
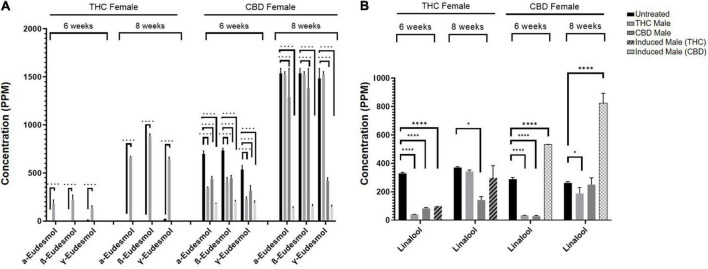
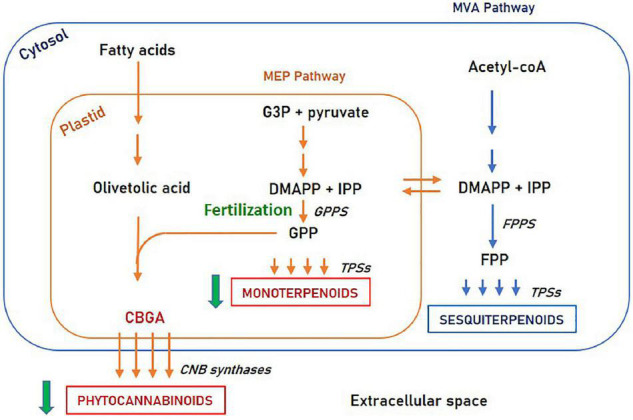
In the last decades, growing evidence showed the therapeutic capabilities of Cannabis plants. These capabilities were attributed to the specialized secondary metabolites stored in the glandular trichomes of female inflorescences, mainly phytocannabinoids and terpenoids. The accumulation of the metabolites in the flower is versatile and influenced by a largely unknown regulation system, attributed to genetic, developmental and environmental factors. As Cannabis is a dioecious plant, one main factor is fertilization after successful pollination. Fertilized flowers are considerably less potent, likely due to changes in the contents of phytocannabinoids and terpenoids; therefore, this study examined the effect of fertilization on metabolite composition by crossbreeding (-)-Δ9-trans-tetrahydrocannabinol (THC)- or cannabidiol (CBD)-rich female plants with different male plants: THC-rich, CBD-rich, or the original female plant induced to develop male pollen sacs. We used advanced analytical methods to assess the phytocannabinoids and terpenoids content, including a newly developed semi-quantitative analysis for terpenoids without analytical standards. We found that fertilization significantly decreased phytocannabinoids content. For terpenoids, the subgroup of monoterpenoids had similar trends to the phytocannabinoids, proposing both are commonly regulated in the plant. The sesquiterpenoids remained unchanged in the THC-rich female and had a trend of decrease in the CBD-rich female. Additionally, specific phytocannabinoids and terpenoids showed an uncommon increase in concentration followed by fertilization with particular male plants. Our results demonstrate that although the profile of phytocannabinoids and their relative ratios were kept, fertilization substantially decreased the concentration of nearly all phytocannabinoids in the plant regardless of the type of fertilizing male. Our findings may point to the functional roles of secondary metabolites in Cannabis.

Keywords: Cannabis; analytical—methods; cannabinoids; chromatography/mass spectrometry; gas chromatography; high pressure liquid chromatography; secondary metabolites; terpenoids.


Conflict of interest statement

The authors declare that the research was conducted in the absence of any commercial or financial relationships that could be construed as a potential conflict of interest.

Figures

FIGURE 1
FIGURE 1
Study design. Differences in inflorescences between THC-rich and CBD-rich plants without (A,B) and after fertilization with either THC-rich male (strain 319) (C,D) or CBD-rich male (strain 405) (E,F) and their respective induced-male plants (G,H). (I) Representative image of a male donor plant (strain 405). To capture images, the plants were placed on the same white background and photographed individually. (J) Experimental design. Female Cannabis plants of two distinct types, THC- or CBD-rich chemovars, were subjected to fertilization by three different male Cannabis plants: THC- or CBD-rich plants, and an induced-male plant achieved by application of ethylene inhibitor. Female and male plants were incubated together for 6–8 weeks. The profile of their secondary metabolites was analyzed by UHPLC/UV and ESI-LC/MS for phytocannabinoids and SHS-GC/MS/MS for terpenoids.
FIGURE 2
FIGURE 2
Phytocannabinoids quantity predominantly decreases after fertilization with all types of males. (A) Total phytocannabinoid concentrations and (B–E) Individual phytocannabinoid concentrations after fertilization relative to unfertilized control. Abundant phytocannabinoid concentrations were considered > 0.2% (B,D) and additional phytocannabinoid concentrations were 0.001–0.2% (C,E) in the unfertilized plants. Data are presented as mean ± SEM (n = 4–6, %w/w) and statistically analyzed by two-way ANOVA followed by Dunnett’s multiple comparison test (*p ≤ 0.05; **p ≤ 0.01; ***p ≤ 0.001; ****p ≤ 0.0001). Significance in C, E was calculated after excluding THCA and CBDA, respectively, from the data.
FIGURE 3
FIGURE 3
Terpenoid profiles of Cannabis strains before and after fertilization. Overlay of chromatograms of the unfertilized and fertilized samples of (A) THC-rich and (B) CBD-rich female plants were performed by the same scales [retention time (RT); relative abundance of the signal intensity; weight of the samples (10 mg)], showing monoterpenoids on the left and sesquiterpenoids on the right. * Terpenoids that were semi-quantified.
FIGURE 4
FIGURE 4
Terpenoid quantity varies after fertilization. Terpenoid concentrations as quantified by SHS-GC/MS/MS of (A) total identified terpenoids, (B) total monoterpenoids and (C) total sesquiterpenoids. Data are reported as mean ± SEM of terpenoid concentrations (n = 3–4, ppm). Statistically significant differences between treatments and control (unfertilized) were calculated by two-way ANOVA followed by Dunnett’s multiple comparison test (*p ≤ 0.05; **p ≤ 0.01; ****p ≤ 0.0001).
FIGURE 5
FIGURE 5
Individual terpenoid concentrations in THC- and CBD-rich female plants at 6 or 8 weeks. Abundant terpenoids in the unfertilized female flowers and their concentrations at 6 weeks (A,C) and 8 weeks (B,D). Data are reported as mean ± SEM of terpenoid concentration (n = 2–3, except THC-female fertilized by induced male (THC) at 6 weeks). Statistically significant differences between treatments and control (unfertilized) were calculated by two-way ANOVA followed by Dunnett’s multiple comparison test (*p ≤ 0.05; **p ≤ 0.01; ***p ≤ 0.001; ****p ≤ 0.0001). Values presented without SEM exceeded the maximal detection limit (maximum limits of detection for terpenoids appear in Supplementary Table 5).
FIGURE 6
FIGURE 6
Specific terpenoids are increased following fertilization. (A) α-, β-, and γ-Eudesmol and (B) Linalool concentrations in THC-rich and CBD-rich females at 6-weeks and 8-weeks after fertilization (n = 2–3, except THC-female fertilized by induced male (THC) at 6 weeks). Statistically significant differences between treatments and control (unfertilized) were calculated by two-way ANOVA followed by Dunnett’s multiple comparison test (*p ≤ 0.05; ****p ≤ 0.0001).
FIGURE 7
FIGURE 7
Phytocannabinoids and terpenoids biosynthesis pathways. Fertilization affects the MEP pathway in an enzymatic step upstream to GPP synthase. MEP, Methylerythritol phosphate; MVA, Mevalonate; G3P, Glyceraldehyde 3-phosphate; DMAPP, Dimethylallyl diphosphate; IPP, Isopentenyl diphosphate; GPP, Geranyl diphosphate; FPP, Farnesyl diphosphate; GPPs, GPP synthase; FPPS, FPP synthase; TPSs, Terpene synthases.

References

    1. Adal A. M., Doshi K., Holbrook L., Mahmoud S. S. (2021). Comparative RNA-Seq analysis reveals genes associated with masculinization in female Cannabis sativa. Planta 253 1–17. 10.1007/S00425-020-03522-Y - DOI - PMC - PubMed
    1. Aizpurua-Olaizola O., Soydaner U., Öztürk E., Schibano D., Simsir Y., Navarro P., et al. (2016). Evolution of the cannabinoid and terpene content during the growth of Cannabis sativa plants from different chemotypes. J. Nat. Prod. 79 324–331. 10.1021/acs.jnatprod.5b00949 - DOI - PubMed
    1. Allen K. D., McKernan K., Pauli C., Roe J., Torres A., Gaudino R. (2019). Genomic characterization of the complete terpene synthase gene family from Cannabis sativa. PLoS One 14:e0222363. 10.1371/journal.pone.0222363 - DOI - PMC - PubMed
    1. Andre C. M., Hausman J. F., Guerriero G. (2016). Cannabis sativa: the plant of the thousand and one molecules. Front. Plant Sci. 7:19. 10.3389/fpls.2016.00019 - DOI - PMC - PubMed
    1. Berman P., Futoran K., Lewitus G. M., Mukha D., Benami M., Shlomi T., et al. (2018). A new ESI-LC/MS approach for comprehensive metabolic profiling of phytocannabinoids in Cannabis. Sci. Rep. 8:14280. 10.1038/s41598-018-32651-4 - DOI - PMC - PubMed