. 2021 Nov 4:12:689676.
doi: 10.3389/fgene.2021.689676. eCollection 2021.

Molecular Subclassification Based on Crosstalk Analysis Improves Prediction of Prognosis in Colorectal Cancer

Affiliations

Molecular Subclassification Based on Crosstalk Analysis Improves Prediction of Prognosis in Colorectal Cancer

Xiaohua Liu et al. Front Genet. .

Abstract

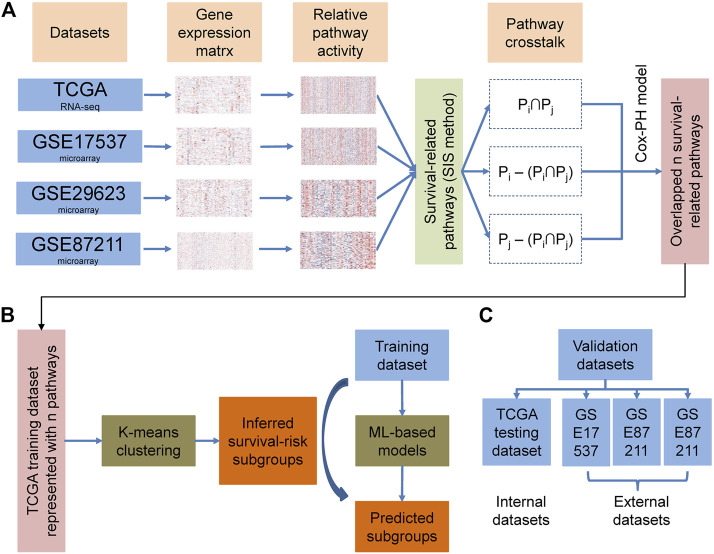
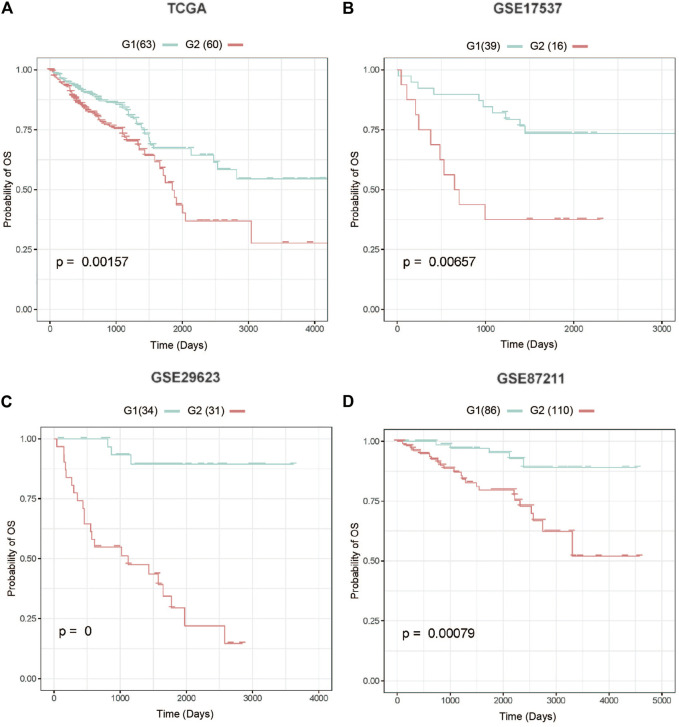
The poor performance of single-gene lists for prognostic predictions in independent cohorts has limited their clinical use. Here, we employed a pathway-based approach using embedded biological features to identify reproducible prognostic markers as an alternative. We used pathway activity score, sure independence screening, and K-means clustering analyses to identify and cluster colorectal cancer patients into two distinct subgroups, G2 (aggressive) and G1 (moderate). The differences between these two groups with respect to survival, somatic mutation, pathway activity, and tumor-infiltration by immunocytes were compared. These comparisons revealed that the survival rates in the G2 subgroup were significantly reduced compared to that in the G1 subgroup; further, the mutational burden rates in several oncogenes, including KRAS, DCLK1, and EPHA5, were significantly higher in the G2 subgroup than in the G1 subgroup. The enhanced activity of the critical pathways such as MYC and epithelial-mesenchymal transition may also lead to the progression of colorectal cancer. Taken together, we established a novel prognostic classification system that offers meritorious insights into the hallmarks of colorectal cancer.

Keywords: colorectal cancer; overall survival; pathways deregulation score; personalized medicine; signature.


Conflict of interest statement

The authors declare that the research was conducted in the absence of any commercial or financial relationships that could be construed as a potential conflict of interest.

Figures

FIGURE 1
FIGURE 1
Overall workflow describing the design and validation processes used in this study.
FIGURE 2
FIGURE 2
Subtyping analysis of the Cancer Genome Atlas-colorectal cancer (TCGA-CRC) patients. (A) K-means clustering analysis split these patients into two subgroups. The optimal number of clusters was determined using three parameters: The C index for prognostic differences, the Silhouette index, and the Calinski–Harabasz criterion. (B) Performance of K-means clustering when k was set at 2. (C) There were significant differences in survival rates between these two CRC subtypes.
FIGURE 3
FIGURE 3
Four test cohorts demonstrating significant differences in survival rates. (A) The Cancer Genome Atlas (TCGA) test cohort, (B) GSE17537 cohort, (C) GSE29623 cohort, (D) GSE87211 cohort. G2: aggressive (higher-risk survival) subtype; G1: moderate (lower-risk survival) subtype.
FIGURE 4
FIGURE 4
The Oncoprint demonstrating the differences between G2 and G1 subgroups at the genetic level. G2: aggressive (higher-risk survival) subtype; G1: moderate (lower-risk survival) subtype. The p values from the Fisher-exact test are displayed on the right as a bar plot. The red line indicates p = 0.05.
FIGURE 5
FIGURE 5
The differentially expressed genes between G1 and G2 subgroups. (A) Volcano plot displaying the differentially expressed genes between G2 and G1 subgroups. (B) Principal component analysis (PCA) analysis describing the differences in clustering between the G1 and G2 subgroups. Hallmark (C) and Kyoto Encyclopedia of Genes and Genomes (KEGG) (D) analyses for the differentially expressed genes. G2: aggressive (higher-risk survival) subtype; G1: moderate (lower-risk survival) subtype.

Similar articles

Cited by

References

    1. Alcaraz N., List M., Batra R., Vandin F., Ditzel H. J., Baumbach J. (2017). De Novo pathway-based Biomarker Identification. Nucleic Acids Res. 45 (16), e151. 10.1093/nar/gkx642 - DOI - PMC - PubMed
    1. Arango D., Mariadason J. M., Wilson A. J., Yang W., Corner G. A., Nicholas C., et al. (2003). c-Myc Overexpression Sensitises colon Cancer Cells to Camptothecin-Induced Apoptosis. Br. J. Cancer 89 (9), 1757–1765. 10.1038/sj.bjc.6601338 - DOI - PMC - PubMed
    1. Artale S., Sartore-Bianchi A., Veronese S. M., Gambi V., Sarnataro C. S., Gambacorta M., et al. (2008). Mutations of KRAS and BRAF in Primary and Matched Metastatic Sites of Colorectal Cancer. Jco 26 (25), 4217–4219. 10.1200/jco.2008.18.7286 - DOI - PubMed
    1. Bates R. C., Pursell B. M., Mercurio A. M. (2007). Epithelial-mesenchymal Transition and Colorectal Cancer: Gaining Insights into Tumor Progression Using LIM 1863 Cells. Cells Tissues Organs 185 (1-3), 29–39. 10.1159/000101300 - DOI - PubMed
    1. Bhandari V., Hoey C., Liu L. Y., Lalonde E., Ray J., Livingstone J., et al. (2019). Molecular Landmarks of Tumor Hypoxia across Cancer Types. Nat. Genet. 51 (2), 308–318. 10.1038/s41588-018-0318-2 - DOI - PubMed