. 2021 Nov 4:12:769723.
doi: 10.3389/fgene.2021.769723. eCollection 2021.

Metabolic Imbalance Effect on Retinal Müller Glial Cells Reprogramming Capacity: Involvement of Histone Deacetylase SIRT6

Affiliations

Metabolic Imbalance Effect on Retinal Müller Glial Cells Reprogramming Capacity: Involvement of Histone Deacetylase SIRT6

L Francisco Sanhueza Salas et al. Front Genet. .

Abstract

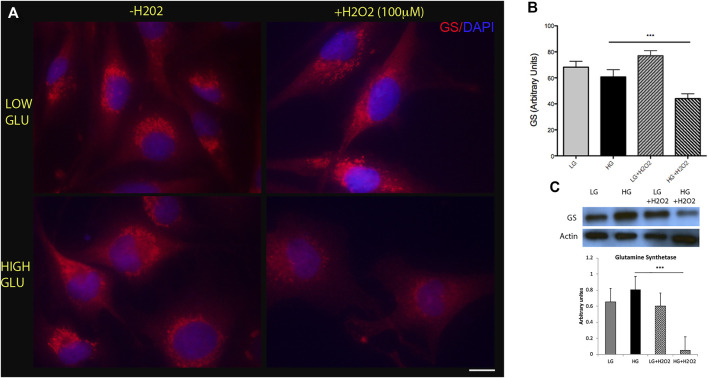
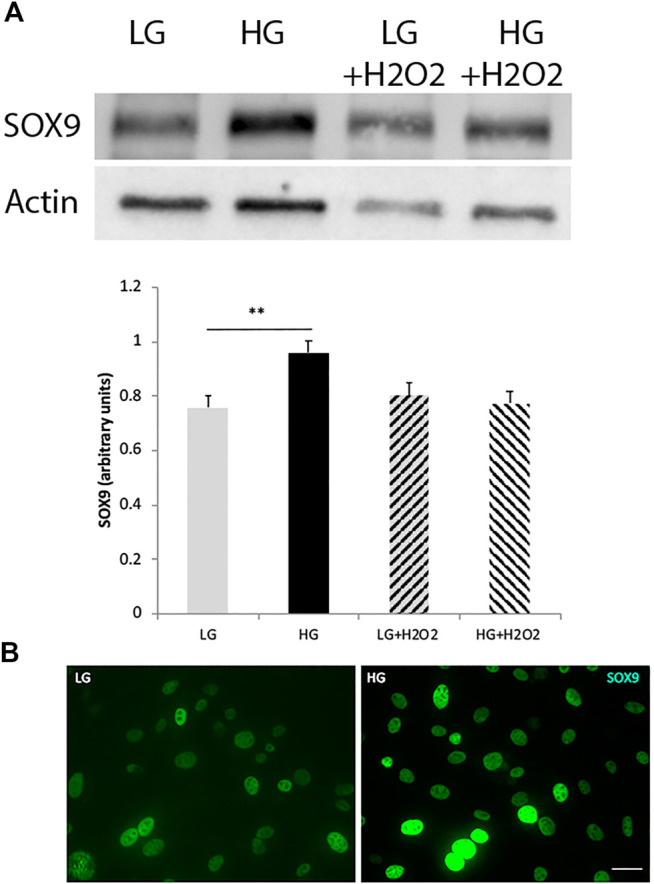
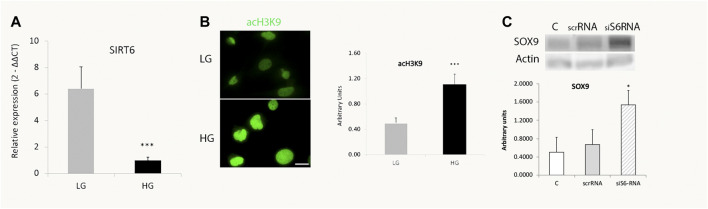
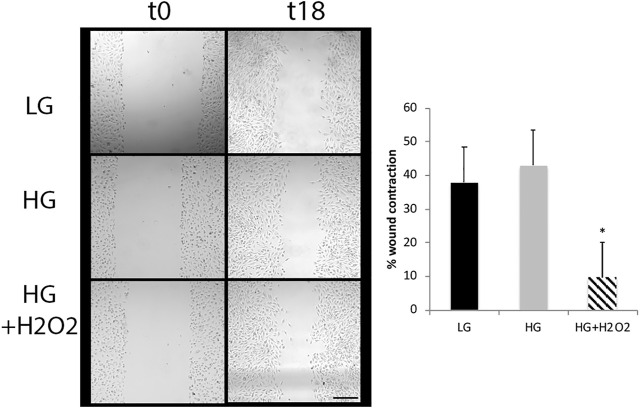
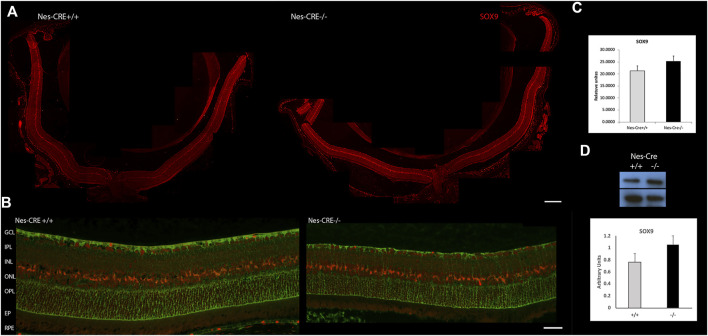
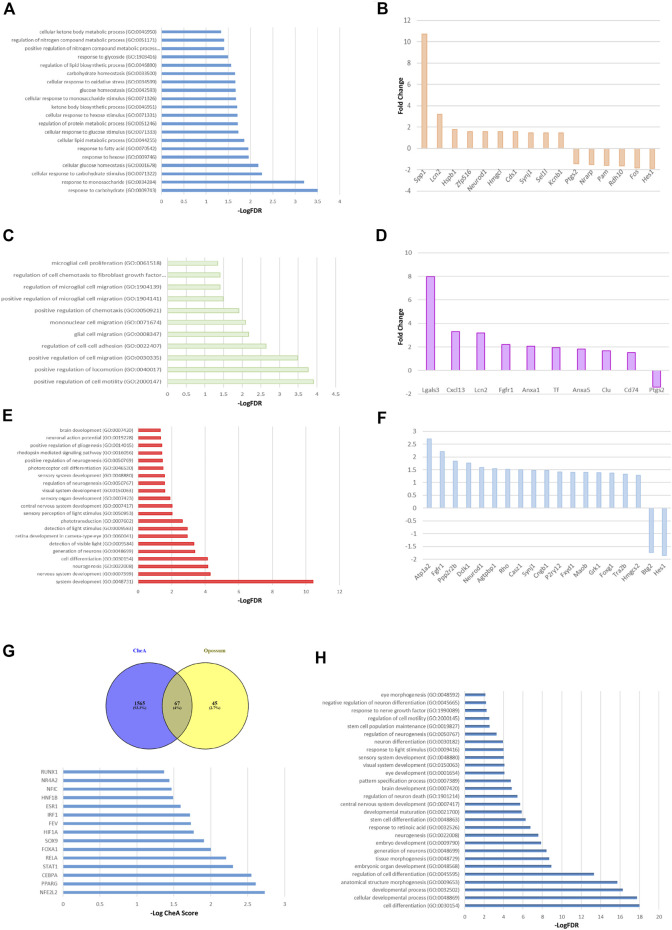
Retinal Müller glial cells (MGs) are among the first to demonstrate metabolic changes during retinal disease and are a potential source of regenerative cells. In response to a harmful stimulus, they can dedifferentiate acquiring neural stem cells properties, proliferate and migrate to the damaged retinal layer and differentiate into lost neurons. However, it is not yet known how this reprogramming process is regulated in mammals. Since glucose and oxygen are important regulatory elements that may help directing stem cell fate, we aimed to study the effect of glucose variations and oxidative stress in Müller cells reprogramming capacity and analyze the participation the histone deacetylase SIRT6, as an epigenetic modulator of this process. We found that the combination of high glucose and oxidative stress induced a decrease in the levels of the marker glutamine synthetase, and an increase in the migration capacity of the cells suggesting that these experimental conditions could induce some degree of dedifferentiation and favor the migration ability. High glucose induced an increase in the levels of the pluripotent factor SOX9 and a decrease in SIRT6 levels accompanied by the increase in the acetylation levels of H3K9. Inhibiting SIRT6 expression by siRNA rendered an increase in SOX9 levels. We also determined SOX9 levels in retinas from mice with a conditional deletion of SIRT6 in the CNS. To further understand the mechanisms that regulate MGs response under metabolic impaired conditions, we evaluated the gene expression profile and performed Gene Ontology enrichment analysis of Müller cells from a murine model of Diabetes. We found several differentially expressed genes and observed that the transcriptomic change involved the enrichment of genes associated with glucose metabolism, cell migration, development and pluripotency. We found that many functional categories affected in cells of diabetic animals were directly related to SIRT6 function. Transcription factors enrichment analysis allowed us to predict several factors, including SOX9, that may be involved in the modulation of the differential expression program observed in diabetic MGs. Our results underline the heterogeneity of Müller cells response and the challenge that the study of metabolic impairment in vivo represents.

Keywords: SIRT6; metabolism; müller cells; reprogramming; retina.


Conflict of interest statement

The authors declare that the research was conducted in the absence of any commercial or financial relationships that could be construed as a potential conflict of interest.

Figures

FIGURE 1
FIGURE 1
High glucose and oxidative stress induce a decrease in glutamine synthetase (GS) levels. (A) Representative immunofluorescence showing GS levels (red) in MGs cultured under low glucose (LG, 5 mM) or high glucose (HG, 25 mM) concentrations with (+H2O2, 100 μM) or without (−H2O2). DAPI was used for nuclei staining. Scale bar: 10 μm. (B) Quantification was performed using the ImageJ program and differences were analyzed using the GraphPad Prism 5 software (One-way ANOVA followed by Bonferroni’s multiple comparison test). (C) Representative Western blot of GS levels. β-actin was used for normalization. Quantification of bands was performed using the ImageJ program. Images show a representative picture from three independent experiments. Data are mean ± SE, ***p < 0.001.
FIGURE 2
FIGURE 2
The levels of the reprogramming factor SOX9 increase under high glucose concentrations. (A) Western blot analysis showed an increase in SOX9 levels in MGs cultured with high glucose (HG, 25 mM), while oxidative stress (H2O2 100 μM) had no effect on this factor’s levels. Quantification of bands was performed using the ImageJ program. β-actin was used for normalization. Data are mean ± SE of three independent experiments, **p < 0.01. (B) Representative immunofluorescence confirmed the increase in SOX9 levels (green). Scale bar: 20 μm. Images show a representative picture from three independent experiments.
FIGURE 3
FIGURE 3
SIRT6 levels decrease in high glucose treated cells. (A) qPCR analysis revealed a decrease in SIRT6 mRNA levels in MGs cultured with high glucose (HG, 25 mM) compared to low glucose (LG, 5 mM). (B). Representative immunofluorescence shows the acetylation levels of SIRT6 substrate H3H9 (green) in MGs cultured under low glucose (LG, 5 mM) or high glucose (HG, 25 mM). Quantification was performed using the ImageJ program. Scale bar: 10 μm. (C) Müller glia response to SIRT6 silencing. SIRT6 siRNA was transiently transfected and the levels of SOX9 were determined by Western blot. β-actin was used for normalization. Data are mean ± SE and images show a representative picture from three independent experiments. *p < 0.05, ***p < 0.001.
FIGURE 4
FIGURE 4
High glucose and oxidative stress induce migration of Müller cells. The wound healing assay was performed in MGs cultured under low glucose (LG, 5 mM) or high glucose (HG, 25 mM) concentrations with or without H2O2 (100 μM). Images show a representative picture from three independent experiments (three parallel scratch lesions were done in each well for each experiment) and the wound contraction was quantified as the area of the gap between wound boundaries at different time points (t0 and t18) using the ImageJ software. Data are mean ± SE, *p < 0.05. Scale bar: 200 μm.
FIGURE 5
FIGURE 5
SOX9 levels in retinas from mice with a conditional deletion of SIRT6 from the CNS. (A) Representative immunofluorescence of SOX9 levels (red) in Nes-Cre+/+ (left panel, n = 4) and Nes-Cre−/− (right panel, n = 5) whole retinal sections. Scale bar: 100 μm. (B) Higher magnification photos show colocalization of SOX9 with glutamine synthetase (green) in Müller cells and RPE. Scale bar, 50 μm Ganglion Cell Layer (GCL), Inner Plexiform Layer (IPL), Inner nuclear Layer (INL), Outer Plexiform Layer (OPL), Outer Nuclear Layer (ONL), Retinal Pigment Epithelium (RPE). (C) Fluorescence intensity was quantified using the ImageJ program. (D) Representative Western blot of SOX9 levels from retinal extracts of Nes-Cre animals. β-actin was used for normalization. Quantification of bands was performed using the ImageJ program. Data are mean ± SE.
FIGURE 6
FIGURE 6
Transcriptomic analysis of Müller glial cells from a murine model of Diabetes. GO enrichment analysis of the 163 altered mRNAs shows the GO terms associated with metabolic processes (A), migration and motility pathways (C) and cellular differentiation processes (E), specially focused on neurogenesis, brain and visual sensory organs development. The top ten of upregulated and downregulated genes associated with the metabolic processes, glial cells migration and cell reprogramming are described in panels (B, D, F) respectively. (G) The top panel shows the transcription factors that could explain the changes in diabetic MGs gene expression shared between ChEA and Opossum enrichment analysis. Lower panel depicts the top 15 transcription factors, in terms of ChEA score, that explain the transcriptome of diabetic MGs. (H) GO analysis using the 67 predicted transcription factors. Only the GO terms associated with development, specially brain and eye development, are shown.

References

    1. Altmann C., Schmidt M. (2018). The Role of Microglia in Diabetic Retinopathy: Inflammation, Microvasculature Defects and Neurodegeneration. Int. J. Mol. Sci. 19 (1), 110. 10.3390/ijms19010110 - DOI - PMC - PubMed
    1. Bigarella C. L., Liang R., Ghaffari S. (2014). Stem Cells and the Impact of ROS Signaling. Development 141 (22), 4206–4218. 10.1242/dev.107086 - DOI - PMC - PubMed
    1. Bringmann A., Iandiev I., Pannicke T., Wurm A., Hollborn M., Wiedemann P., et al. (2009). Cellular Signaling and Factors Involved in Müller Cell Gliosis: Neuroprotective and Detrimental Effects. Prog. Retin. Eye Res. 28 (6), 423–451. 10.1016/j.preteyeres.2009.07.001 - DOI - PubMed
    1. Burda J. E., Sofroniew M. V. (2014). Reactive Gliosis and the Multicellular Response to CNS Damage and Disease. Neuron 81 (2), 229–248. 10.1016/j.neuron.2013.12.034 - DOI - PMC - PubMed
    1. Das A. V., Mallya K. B., Zhao X., Ahmad F., Bhattacharya S., Thoreson W. B., et al. (2006). Neural Stem Cell Properties of Müller Glia in the Mammalian Retina: Regulation by Notch and Wnt Signaling. Develop. Biol. 299 (1), 283–302. 10.1016/j.ydbio.2006.07.029 - DOI - PubMed