. 2021 Nov 11:2021:1806344.
doi: 10.1155/2021/1806344. eCollection 2021.

Metformin Corrects Glucose Metabolism Reprogramming and NLRP3 Inflammasome-Induced Pyroptosis via Inhibiting the TLR4/NF- κ B/PFKFB3 Signaling in Trophoblasts: Implication for a Potential Therapy of Preeclampsia

Affiliations

Metformin Corrects Glucose Metabolism Reprogramming and NLRP3 Inflammasome-Induced Pyroptosis via Inhibiting the TLR4/NF- κ B/PFKFB3 Signaling in Trophoblasts: Implication for a Potential Therapy of Preeclampsia

Yang Zhang et al. Oxid Med Cell Longev. .

Abstract

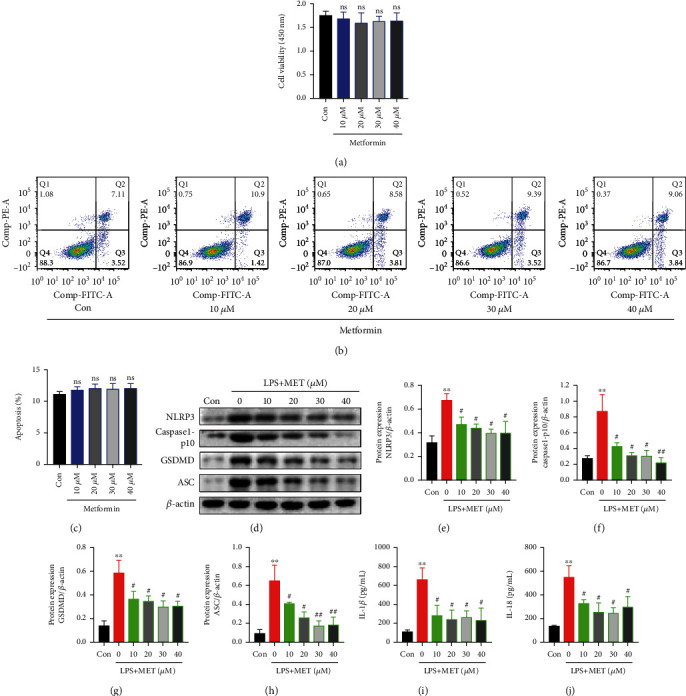
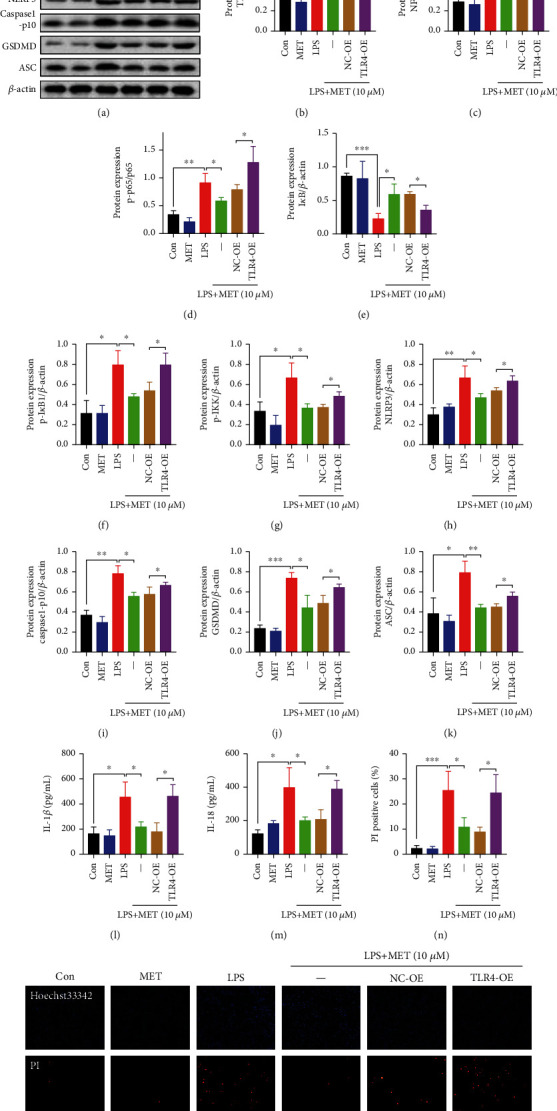
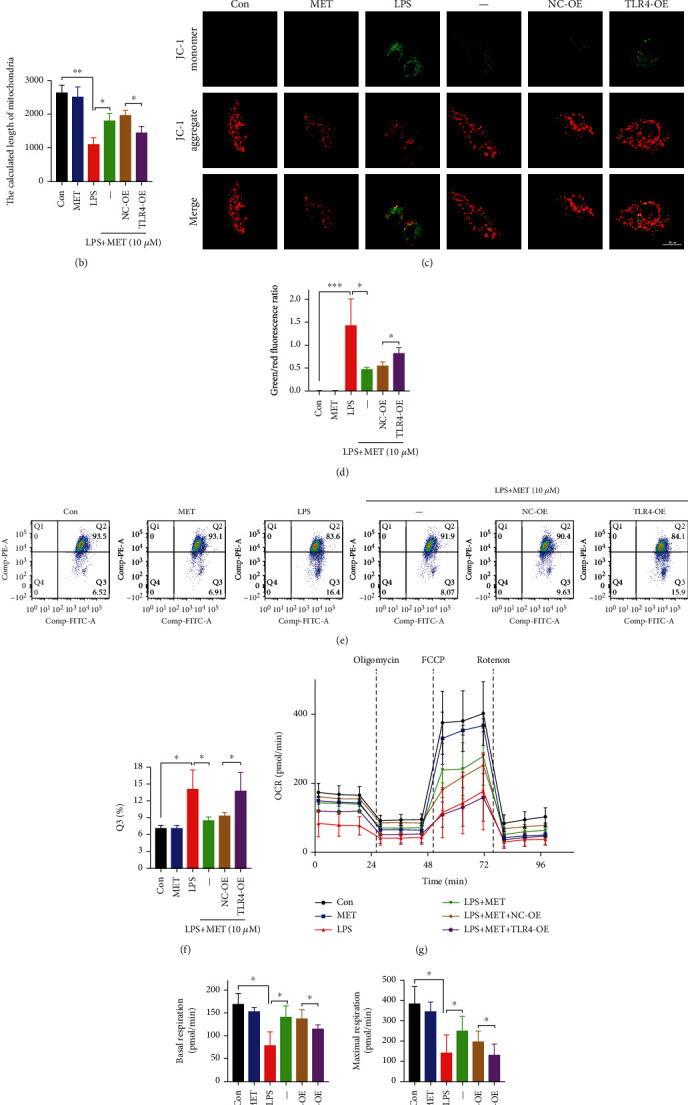
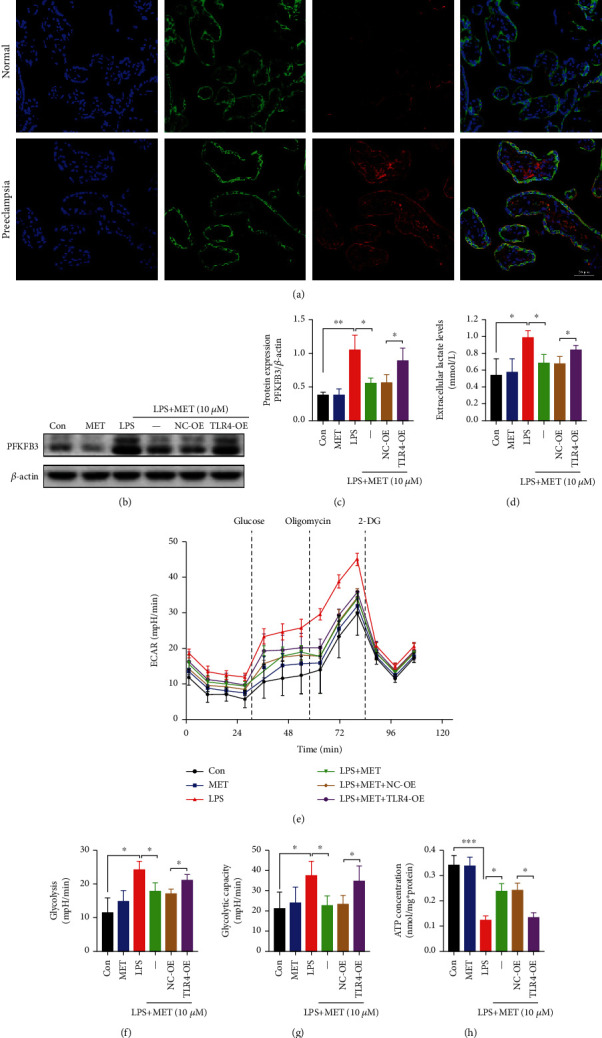
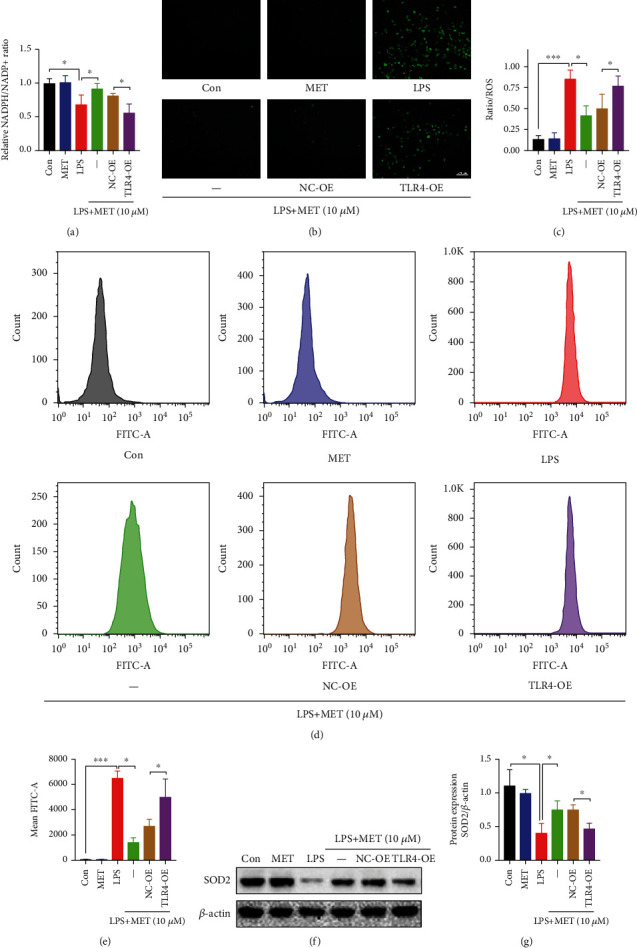
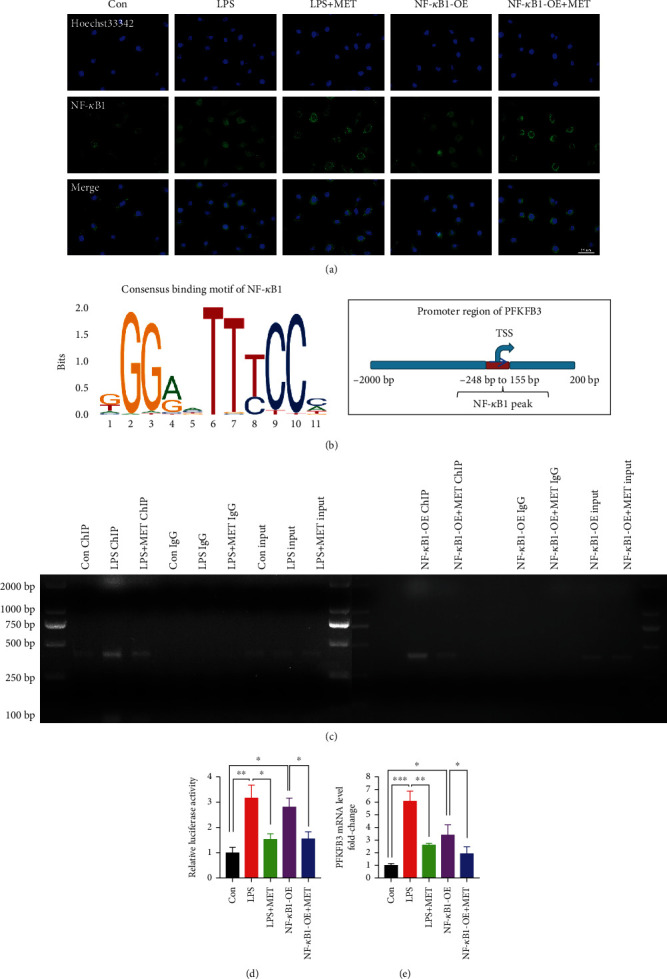
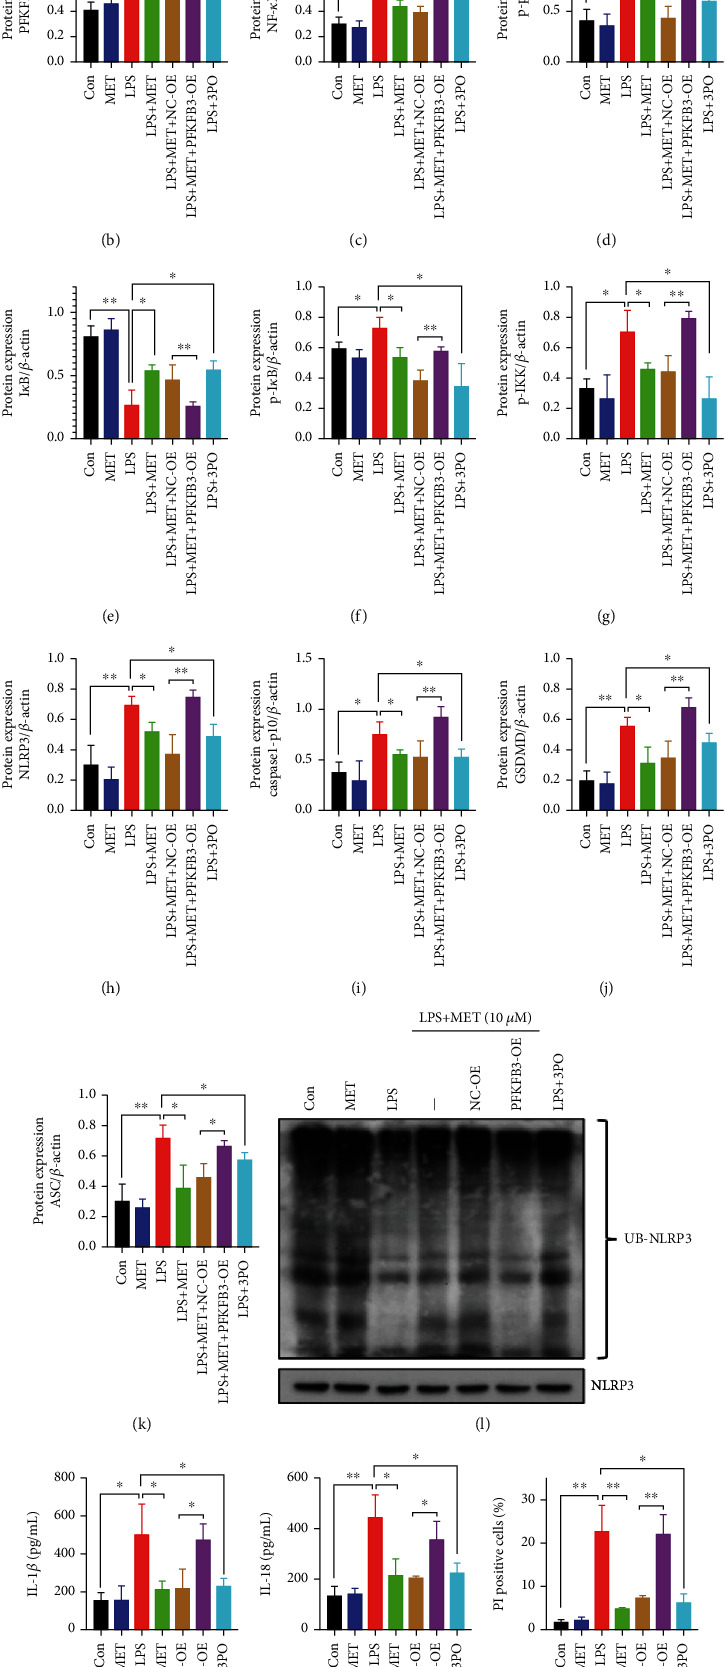
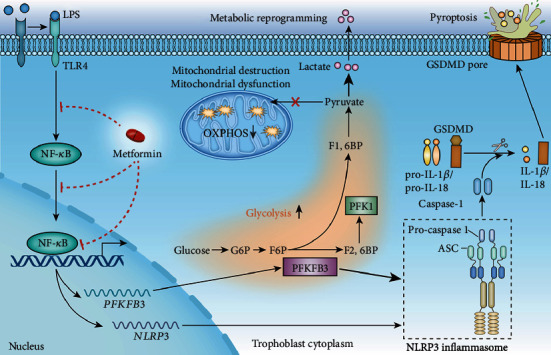
NOD-like receptor family, pyrin domain-containing protein 3 (NLRP3) inflammasome-mediated pyroptosis is a crucial event in the preeclamptic pathogenesis, tightly linked with the uteroplacental TLR4/NF-κB signaling. Trophoblastic glycometabolism reprogramming has now been noticed in the preeclampsia pathogenesis, plausibly modulated by the TLR4/NF-κB signaling as well. Intriguingly, cellular pyroptosis and metabolic phenotypes may be inextricably linked and interacted. Metformin (MET), a widely accepted NF-κB signaling inhibitor, may have therapeutic potential in preeclampsia while the underlying mechanisms remain unclear. Herein, we investigated the role of MET on trophoblastic pyroptosis and its relevant metabolism reprogramming. The safety of pharmacologic MET concentration to trophoblasts was verified at first, which had no adverse effects on trophoblastic viability. Pharmacological MET concentration suppressed NLRP3 inflammasome-induced pyroptosis partly through inhibiting the TLR4/NF-κB signaling in preeclamptic trophoblast models induced via low-dose lipopolysaccharide. Besides, MET corrected the glycometabolic reprogramming and oxidative stress partly via suppressing the TLR4/NF-κB signaling and blocking transcription factor NF-κB1 binding on the promoter PFKFB3, a potent glycolytic accelerator. Furthermore, PFKFB3 can also enhance the NF-κB signaling, reduce NLRP3 ubiquitination, and aggravate pyroptosis. However, MET suppressed pyroptosis partly via inhibiting PFKFB3 as well. These results provided that the TLR4/NF-κB/PFKFB3 pathway may be a novel link between metabolism reprogramming and NLRP3 inflammasome-induced pyroptosis in trophoblasts. Further, MET alleviates the NLRP3 inflammasome-induced pyroptosis, which partly relies on the regulation of TLR4/NF-κB/PFKFB3-dependent glycometabolism reprogramming and redox disorders. Hence, our results provide novel insights into the pathogenesis of preeclampsia and propose MET as a potential therapy.


Conflict of interest statement

The authors have declared that no competing interest exists.

Figures

Figure 1
Figure 1
Pharmacological MET concentrations alleviated LPS-induced NLRP3 inflammasome formation and trophoblastic pyroptosis. (a) CCK-8 assays of HTR-8/SVneo cells treated with the indicated concentration of MET for 24 h. (b, c) Flow cytometry assays and quantitative analysis were performed to determine the apoptotic rates in HTR-8/SVneo cells treated with the indicated MET concentration for 24 h. (d–h) Western blot analysis of NLRP3, caspase1-p10, GSDMD, and ASC protein expression and densitometry quantification of NLRP3 (e), caspase1-p10 (f), GSDMD (g), and ASC (h) levels in HTR-8/SVneo cells were cultured with 200 ng/ml LPS and MET at different concentrations, respectively (10, 20, 30, and 40 μM). (i, j) ELISA analysis of IL-1β (i) and IL-18 (j) concentrations in cell culture medium. Data are shown as the mean ± SD from three independent experiments. ns: not significant compared with the Con group. ∗∗P < 0.01 compared with the Con group. #P < 0.05 compared with the LPS group. ##P < 0.01 compared with the LPS group by Student's t-test. SD: standard deviation.
Figure 2
Figure 2
Pharmacological MET concentration suppressed NLRP3 inflammasome-induced pyroptosis partly through inhibiting the TLR4/NF-κB signaling. HTR-8/SVneo cells were transfected with TLR4 plasmid for overexpression or negative vector; 200 ng/ml LPS and 10 μM MET were subsequently incubated. (a–k) Western blot analysis of TLR4, NF-κB1, p65, p-p65, IκB, p-IκB, p-IKK, NLRP3, caspase1-p10, GSDMD, and ASC protein expression and densitometry quantification of TLR4 (b), NF-κB1 (c), p-p65/p65 (d), IκB (e), p-IκB (f), p-IKK (g), NLRP3 (h), caspase1-p10 (i), GSDMD (j), and ASC (k) levels. (l, m) ELISA analysis of IL-1β (l) and IL-18 (m) concentrations in cell culture medium from different groups. (n, o) Representative immunofluorescence images and quantification of double-fluorescent staining with PI (red) and Hoechst33342 (blue). Scale bar: 100 μm. Data are shown as the mean ± SD from three independent experiments. P < 0.05, ∗∗P < 0.01, and ∗∗∗P < 0.001 by Student's t-test. SD: standard deviation; NC-OE: negative vector; TLR4-OE: TLR4 overexpression plasmid.
Figure 3
Figure 3
Pharmacological concentration of MET preserved mitochondrial homeostasis in trophoblasts partly via the suppression of the TLR4/NF-κB signaling. HTR-8/SVneo cells were transfected with TLR4 plasmid for overexpression or negative vector; 200 ng/ml LPS and 10 μM MET were subsequently incubated. (a, b) HTR-8/SVneo cells in different groups were observed by a transmission electron microscope to evaluate the mitochondrial structure, and the mitochondrial length was analyzed quantitatively. Scale bar: 500 nm. (c, d) MMP was evaluated by a confocal microscope. The ratio of green/red puncta was calculated to assess the MMP changes. At least 6 images per condition were analyzed. Scale bar: 20 μm. (e, f) Flow cytometry assays and quantitative analysis were also performed to determine the MMP of HTR-8/SVneo cells in different groups. (g–i) The OCR assay was used to observe the mitochondrial respiratory function. Data are shown as the mean ± SD from three independent experiments. P < 0.05, ∗∗P < 0.01, and ∗∗∗P < 0.001 by Student's t-test. SD: standard deviation; NC-OE: negative vector; TLR4-OE: TLR4 overexpression plasmid.
Figure 4
Figure 4
Pharmacological concentration of MET suppressed overactive glycolysis in trophoblasts partly via inhibiting the TLR4/NF-κB signaling. (a) Double labeling the immunofluorescence analysis of PFKFB3 (red) protein expression and localization in the placentae from full-term normal pregnancies and preeclampsia patients. DAPI (blue) and CK7 (green) for trophoblast localization. Scale bar: 50 μm. (b, c) Western blot analysis of PFKFB3 protein expression and the densitometry quantification. (d) Extracellular lactate release determination. (e–g) Glycolysis and glycolysis capacity were both detected by ECAR assay. (h) Cellular ATP concentration determination. Data are shown as the mean ± SD from three independent experiments. P < 0.05, ∗∗P < 0.01, and ∗∗∗P < 0.001 by Student's t-test. SD: standard deviation; NC-OE: negative vector; TLR4-OE: TLR4 overexpression plasmid.
Figure 5
Figure 5
Pharmacological concentration of MET restored the trophoblastic redox homeostasis partly through the inhibition of the TLR4/NF-κB signaling. HTR-8/SVneo cells were transfected with TLR4 plasmid for overexpression or negative vector; 200 ng/ml LPS and 10 μM MET were subsequently incubated. (a) The cellular levels of NADPH were measured in HTR-8/SVneo cells in different groups. (b, c) Representative images showing DCFH-DA fluorescence signals (green) indicative of ROS and the comparison of mean fluorescence intensities across different groups. Scale bar: 100 μm. (d, e) Flow cytometry analysis and quantitative analysis of cellular ROS content in different groups. (f, g) Western blot analysis of SOD2 protein expression and the densitometry quantification. Data are shown as the mean ± SD from three independent experiments. P < 0.05, ∗∗P < 0.01, and ∗∗∗P < 0.001 by Student's t-test. SD: standard deviation; NC-OE: negative vector; TLR4-OE: TLR4 overexpression plasmid.
Figure 6
Figure 6
Pharmacological concentration of MET reduced the transcription of PFKFB3 via blocking transcription factor NF-κB1 directly binding on PFKFB3 promoter. HTR-8/SVneo cells were transfected with NF-κB1 plasmid for overexpression; 200 ng/ml LPS and 10 μM MET were subsequently incubated. (a) Representative images of NF-κB1 immunostaining in HTR-8/SVneo cells in different groups. At least 6 images per condition were analyzed. Scale bar: 50 μm. (b) Consensus binding motif of NF-κB1 from the JASPAR database and the NF-κB1 peak in the PFKFB3 promoter were found using the USCS database. (c) In the ChIP assay, PCR products of PFKFB3 in different groups are shown. DNA ChIP-ed with nonspecific IgG was used as a negative control. (d) Dual-luciferase reporter assays were performed to determine the PFKFB3 promoter activity in HTR8/SVneo cells in different groups. (e) qRT-PCR analysis of PFKFB3 mRNA levels in HTR-8/SVneo cells in different groups. Data are shown as the mean ± SD from three independent experiments. P < 0.05, ∗∗P < 0.01, and ∗∗∗P < 0.001 by Student's t-test. SD: standard deviation; NF-κB1-OE: NF-κB1 overexpression plasmid.
Figure 7
Figure 7
PFKFB3 modulated the NF-κB signaling as well as the NLRP3 inflammasome-induced pyroptosis while the pharmacological concentration of MET suppressed pyroptosis partly via inhibiting PFKFB3. HTR-8/SVneo cells were transfected with PFKFB3 plasmid for overexpression or negative vector; 200 ng/ml LPS, 10 μM MET, and 10 μM 3PO were subsequently incubated. (a–k) Western blot analysis of PFKFB3, NF-κB1, p65, p-p65, IκB, p-IκB, p-IKK, NLRP3, caspase1-p10, GSDMD, and ASC protein expression and densitometry quantification of PFKFB3 (b), NF-κB1 (c), p-p65/p65 (d), IκB (e), p-IκB (f), p-IKK (g), NLRP3 (h), caspase1-p10 (i), GSDMD (j), ASC (k) levels. (l) Analysis of NLRP3 ubiquitination levels in HTR-8/SVneo cells of different groups. (m, n) ELISA analysis of IL-1β (m) and IL-18 (n) concentrations in cell culture medium. (o, p) Representative immunofluorescence images and quantification of double-fluorescent staining with PI (red) and Hoechst33342 (blue). Scale bar: 100 μm. Data are shown as the mean ± SD from three independent experiments. P < 0.05, ∗∗P < 0.01, and ∗∗∗P < 0.001 by Student's t-test. SD: standard deviation; NC-OE: negative vector; PFKFB3-OE: PFKFB3 overexpression plasmid.
Figure 8
Figure 8
A mechanism diagram. LPS-induced TLR4/NF-κB activation caused NLRP3 inflammasome-induced pyroptosis in trophoblasts. Besides, the TLR4/NF-κB signaling caused mitochondrial destruction and dysfunction; meanwhile, it reprogrammed the glycometabolism to glycolysis with increased PFKFB3 expression. The TLR4/NF-κB signaling induced PFKFB3 expression by transcriptional factor NF-κB1 binding PFKFB3 promoter region. Glycolytic enzyme PFKFB3 further exacerbated NLRP3 inflammasome-induced pyroptosis, leading to positive feedback. Metformin inhibited the TLR4/NF-κB/PFKFB3 signaling to break the vicious circle, expected to be a novel candidate for preeclamptic therapies.

References

    1. Ives C. W., Sinkey R., Rajapreyar I., Tita A. T. N., Oparil S. Preeclampsia--Pathophysiology and Clinical Presentations: Journal of the American College of Cardiology . 2020;76(14):1690–1702. doi: 10.1016/j.jacc.2020.08.014. - DOI - PubMed
    1. Shirasuna K., Karasawa T., Takahashi M. Role of the NLRP3 inflammasome in preeclampsia. Frontiers in Endocrinology . 2020;11:p. 80. doi: 10.3389/fendo.2020.00080. - DOI - PMC - PubMed
    1. Socha M. W., Malinowski B., Puk O., Dubiel M., Wiciński M. The NLRP3 inflammasome role in the pathogenesis of pregnancy induced hypertension and preeclampsia. Cell . 2020;9(7):p. 1642. doi: 10.3390/cells9071642. - DOI - PMC - PubMed
    1. Liu D., Zeng X., Li X., Mehta J. L., Wang X. Role of NLRP3 inflammasome in the pathogenesis of cardiovascular diseases. Basic Research in Cardiology . 2018;113(1) doi: 10.1007/s00395-017-0663-9. - DOI - PubMed
    1. Lebeaupin C., Proics E., de Bieville C. H. D., et al. ER stress induces NLRP3 inflammasome activation and hepatocyte death. Cell Death & Disease . 2015;6(9, article e1879) doi: 10.1038/cddis.2015.248. - DOI - PMC - PubMed

MeSH terms