. 2021 Nov 17;8(11):210488.
doi: 10.1098/rsos.210488. eCollection 2021 Nov.

Early intervention is the key to success in COVID-19 control

Affiliations

Early intervention is the key to success in COVID-19 control

Rachelle N Binny et al. R Soc Open Sci. .

Abstract

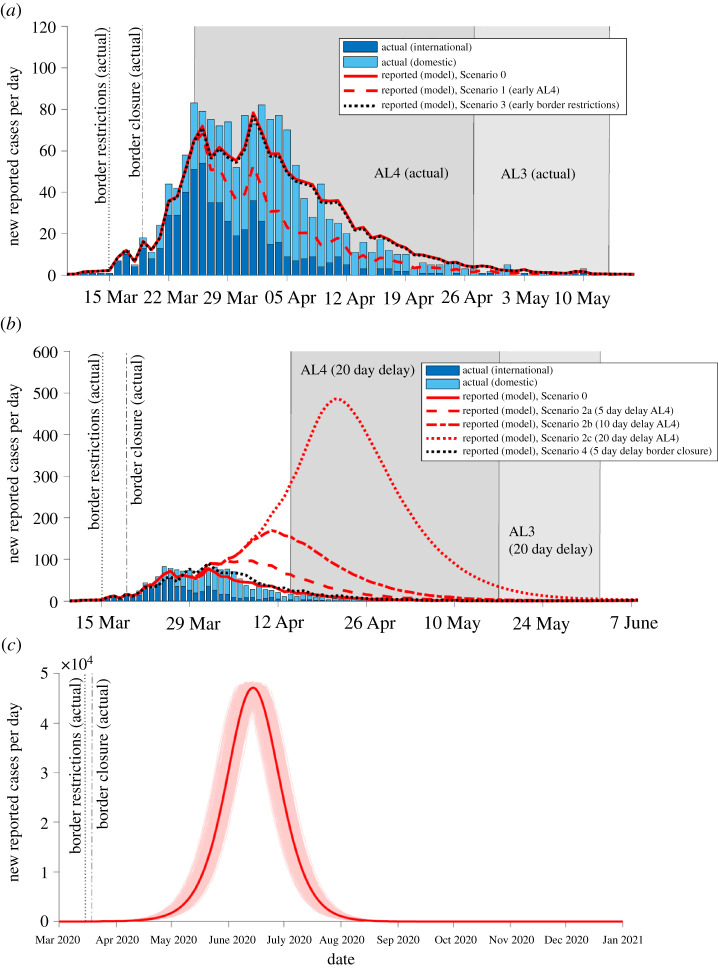
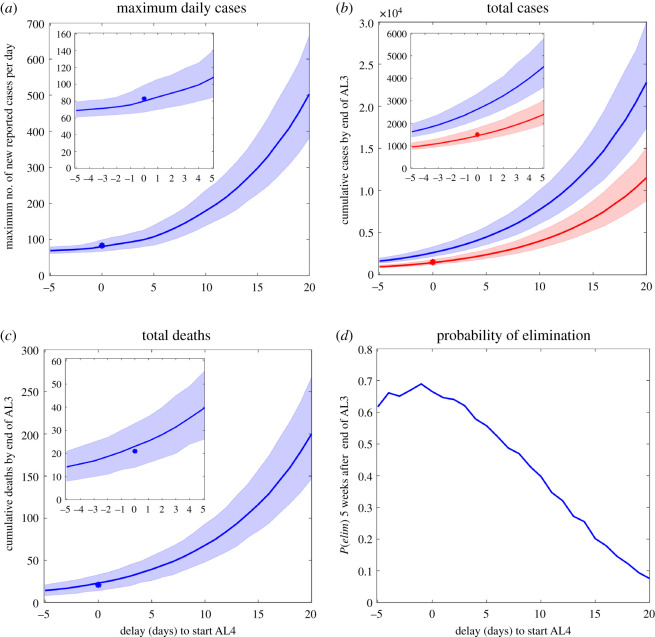
New Zealand responded to the COVID-19 pandemic with a combination of border restrictions and an Alert Level (AL) system that included strict stay-at-home orders. These interventions were successful in containing an outbreak and ultimately eliminating community transmission of COVID-19 in June 2020. The timing of interventions is crucial to their success. Delaying interventions may reduce their effectiveness and mean that they need to be maintained for a longer period. We use a stochastic branching process model of COVID-19 transmission and control to simulate the epidemic trajectory in New Zealand's March-April 2020 outbreak and the effect of its interventions. We calculate key measures, including the number of reported cases and deaths, and the probability of elimination within a specified time frame. By comparing these measures under alternative timings of interventions, we show that changing the timing of AL4 (the strictest level of restrictions) has a far greater impact than the timing of border measures. Delaying AL4 restrictions results in considerably worse outcomes. Implementing border measures alone, without AL4 restrictions, is insufficient to control the outbreak. We conclude that the early introduction of stay-at-home orders was crucial in reducing the number of cases and deaths, enabling elimination.

Keywords: COVID-19; border restrictions; coronavirus; infectious disease outbreak; non-pharmaceutical interventions; stochastic model.


Figures

Figure 1.
Figure 1.
Effect of alternative timings of interventions on the trajectory of the outbreak. Number of new reported cases per day predicted by the model (averaged over 5000 simulations) alongside observed reported domestic (light blue bars) and international cases (dark blue bars) (data source: MoH). Model simulated for interventions implemented on their actual start dates and for alternative scenarios with different timings of AL4, border restrictions or border closure (a) Scenario with AL4 started 5 days early (border restrictions and closure on actual start dates) (red dashed; Scenario 1) compared with a scenario where border restrictions were implemented five days early (border closure on actual start date) (black dotted; Scenario 3). (b) Delayed start to AL4 (delays of 5, 10 and 20 days; Scenarios 2a–c; red broken lines) (with border restrictions and closure on actual start dates). Five-day delay to border closure (with border restrictions and AL4 on actual start dates) (black dotted; Scenario 4). (c) No AL4/3 restrictions (border restrictions and closure on actual start dates; Scenario 6) results in an uncontrolled outbreak; faint red lines show the outbreak in individual realizations of the model, the bold red line is the average over all 5000 simulations. Note, x- and y-axis scale differs between figures.
Figure 2.
Figure 2.
Sensitivity of predicted cases and deaths to varying the delay until start of Alert Level 4, up to a maximum delay of 20 days. A negative delay of 5 days represents starting AL4 5 days early (20 March 2020). Border restrictions and closure were implemented on the same dates as actually occurred. (a) Maximum number of new reported cases per day predicted by the model (blue line) and actual maximum number of daily reported cases (asterisk). (b) Cumulative number of infected individuals (both clinical and sub-clinical) (blue line) and reported cases (red line) predicted by the model and actual number of reported cases (red asterisk). (c) Cumulative number of deaths predicted by the model (blue line) and actual number (blue asterisk). (d) Probability of elimination, P(elim), five weeks after the end of AL3. Shaded regions indicate the interval range in which 90% of simulation results are contained. Note, y-axis scale differs between figures. Insets show close-ups of results for delays from –5 to 5 days.

References

    1. Desvars-Larrive A, et al. 2020. CCCSL: Complexity Science Hub Covid-19 Control Strategies List. Version 2.0. See https://github.com/amel-github/covid19-interventionmeasures. (accessed 20 August 2020).
    1. Flaxman S, et al. 2020. Estimating the effects of non-pharmaceutical interventions on COVID-19 in Europe. Nature 584, 257-261. ( 10.1038/s41586-020-2405-7) - DOI - PubMed
    1. Hsiang S, et al. 2020. The effect of large-scale anti-contagion policies on the COVID-19 pandemic. Nature 584, 262-267. ( 10.1038/s41586-020-2404-8) - DOI - PubMed
    1. Hendy SC, Steyn N, James A, Plank MJ, Binny RN, Lustig A. 2021. Mathematical modelling to inform New Zealand's COVID-19 response. J. R. Soc. N. Z. 51(sup1), S86-S106. ( 10.1080/03036758.2021.1876111) - DOI
    1. Brauner JM, et al. 2021. Inferring the effectiveness of government interventions against COVID-19. Science 371, eabd9338. ( 10.1126/science.abd9338) - DOI - PMC - PubMed